Anthracite Market Size and Share
Market Overview
| Study Period | 2021 - 2031 |
|---|---|
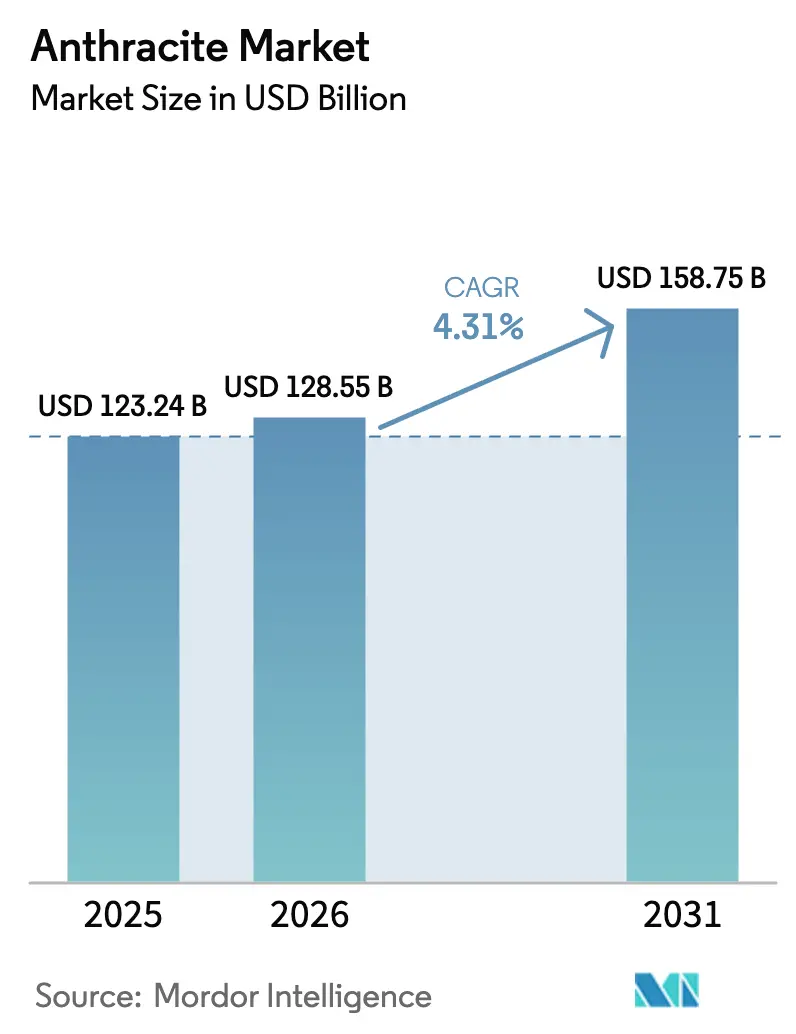
| Market Size (2026) | USD 128.55 Billion |
| Market Size (2031) | USD 158.75 Billion |
| Growth Rate (2026 - 2031) | 4.31% CAGR |
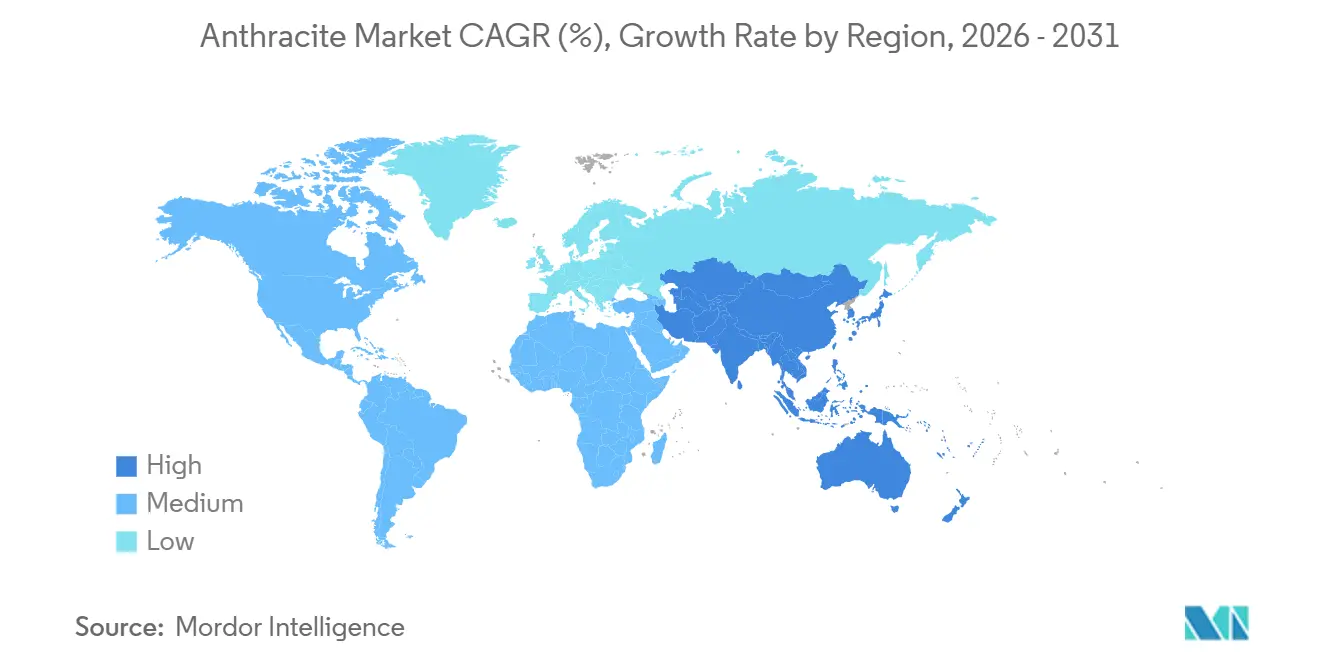
| Fastest Growing Market | Asia Pacific |
| Largest Market | Asia Pacific |
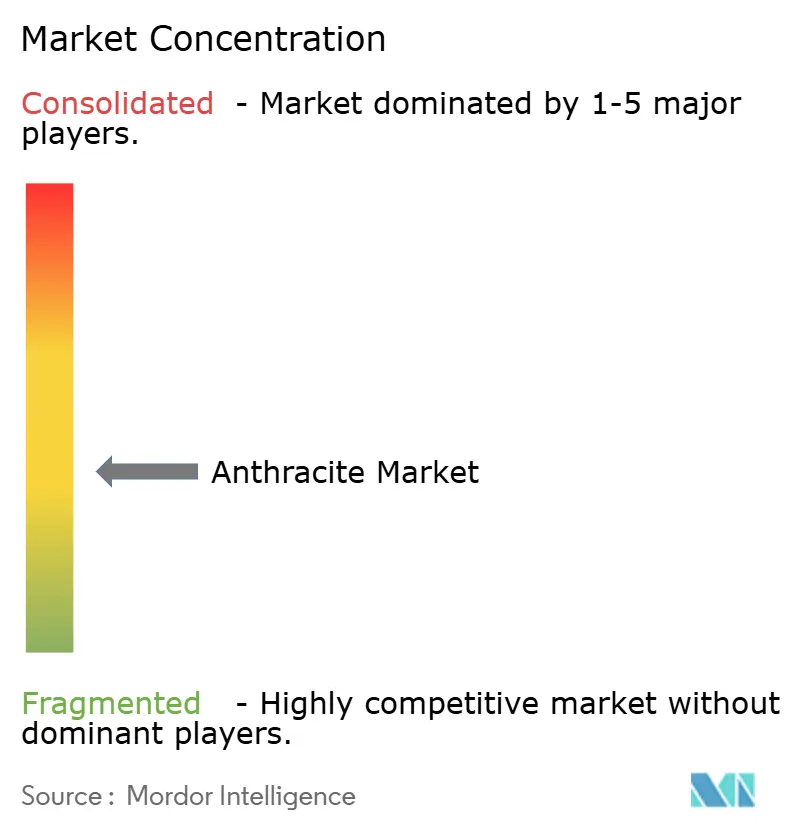
| Market Concentration | Medium |
Major Players *Disclaimer: Major Players sorted in no particular order Image © Mordor Intelligence. Reuse requires attribution under CC BY 4.0. | |
Anthracite Market Analysis by Mordor Intelligence
The Anthracite Market size was valued at USD 123.24 billion in 2025 and is estimated to grow from USD 128.55 billion in 2026 to reach USD 158.75 billion by 2031, at a CAGR of 4.31% during the forecast period (2026-2031). Robust policy support for low-carbon steelmaking, battery material localization, and dual-media drinking-water filtration is redirecting demand away from bulk thermal uses and toward precision-engineered, high-purity grades that command price premiums in the anthracite market. Investment momentum is visible in Pennsylvania, South Africa, and Siberia, where asset acquisitions have concentrated ultra-high-grade reserves into vertically integrated hands. Fragmented producer structures and rising freight-rate volatility sustain regional price differentials that savvy buyers arbitrage through multi-year offtake contracts. Consolidation, autonomous longwall mining, and calcination capacity expansion together bolster cost competitiveness, allowing the anthracite market to defend share against cheaper petroleum-coke and emerging bio-carbon substitutes.
Key Report Takeaways
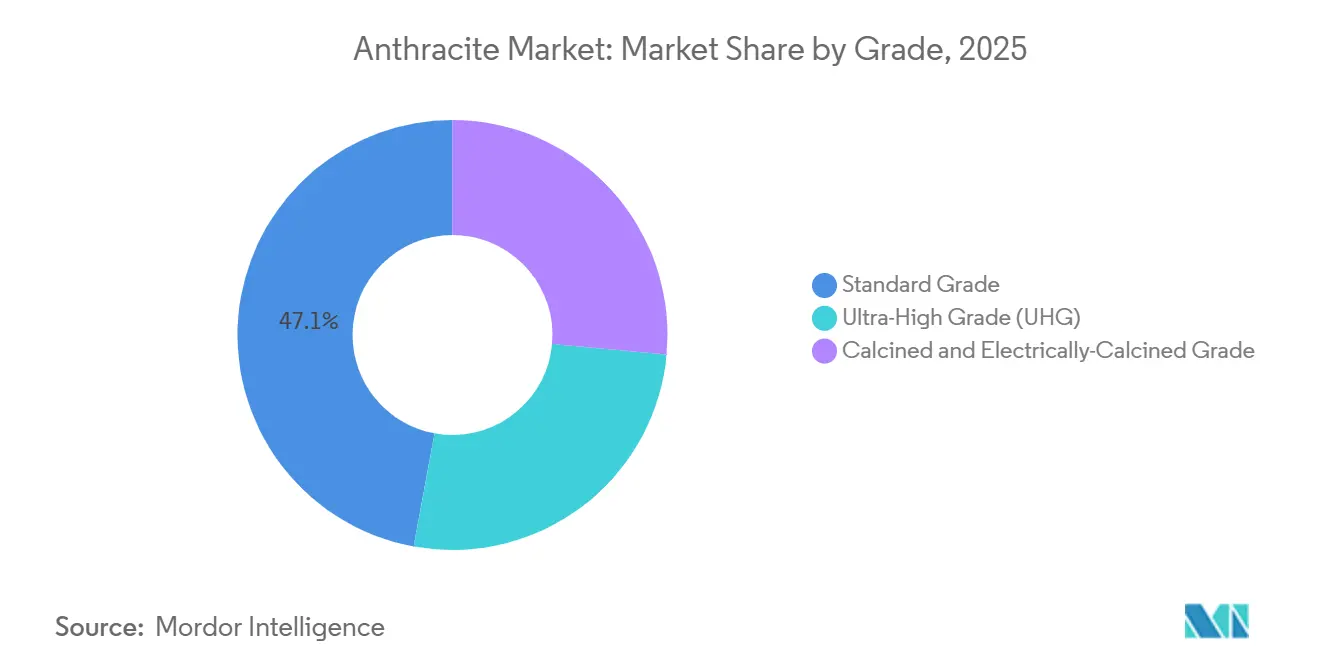
- By grade, standard grade captured 47.12% of the anthracite market share in 2025, while calcined and electrically-calcined grade is advancing at a 5.12% CAGR through 2031.
- By application, metallurgy led with 56.21% of the anthracite market share in 2025; other applications are projected to expand at a 5.41% CAGR to 2031.
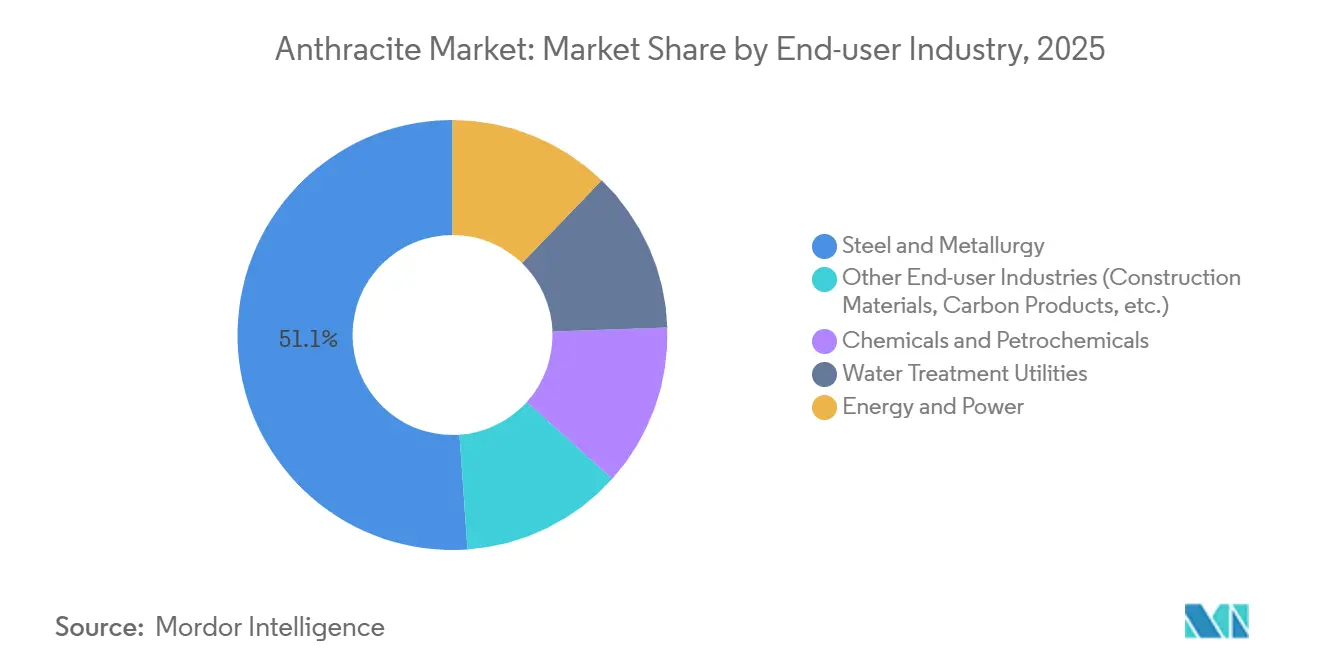
- By end-user industry, steel and metallurgy accounted for 51.11% of the anthracite market share in 2025, and energy and power is forecast to grow at a 5.56% CAGR through 2031.
- By geography, Asia-Pacific held 53.24% of the anthracite market share in 2025and is set to rise at a 4.47% CAGR through 2031.
Note: Market size and forecast figures in this report are generated using Mordor Intelligence’s proprietary estimation framework, updated with the latest available data and insights as of January 2026.
Global Anthracite Market Trends and Insights
Drivers Impact Analysis*
| Driver | (~) % Impact on CAGR Forecast | Geographic Relevance | Impact Timeline |
|---|---|---|---|
| Mandates for ultra-low-ash carbon additives in green-steel processes | +0.6% | Global, with early adoption in EU, Japan, South Korea | Medium term (2-4 years) |
| Municipal shift to dual-media (anthracite + sand) filtration beds | +0.5% | North America, Europe, APAC urban centers | Long term (≥ 4 years) |
| Growth of electrically-calcined anthracite in Li-ion anodes | +0.8% | China, Japan, South Korea, with spill-over to North America | Short term (≤ 2 years) |
| High-density carbon-brick demand from refractory retrofits | +0.7% | APAC core (China, India), spill-over to MEA steel hubs | Medium term (2-4 years) |
| Autonomous long-wall mining boosting cost-competitiveness | +0.9% | Russia, Australia, United States (Pennsylvania anthracite belt) | Long term (≥ 4 years) |
| Source: Mordor Intelligence | |||
Mandates for Ultra-Low-Ash Carbon Additives in Green-Steel Processes
Steelmakers moving toward hydrogen DRI and electric arc furnaces need carbon additives with less than 8% ash and below 0.4% sulfur to minimize slag volumes and maintain bath chemistry. Recent acquisitions in Pennsylvania explicitly target these ultra-high-grade deposits to supply U.S. and European EAF expansions. China’s plan to raise EAF share to 20% by 2030 intensifies global competition for low-volatile feedstocks, sustaining premium pricing even as mid-grade thermal anthracite faces substitution from natural-gas DRI and bio-carbon.
Municipal Shift to Dual-Media (Anthracite + Sand) Filtration Beds
North American and European utilities are retrofitting conventional sand filters with a coarse anthracite cap that extends run length up to 50% and cuts backwash costs. Sacramento’s 2025 contract amendment and the Water Research Foundation’s USD 500,000 PFAS project underscore the long-cycle, specification-driven nature of this demand[1]City of Sacramento, “Contract Amendment PRC003286,” cityofsacramento.org. The operational savings shield procurement budgets from price shocks, anchoring a resilient slice of the anthracite market.
Growth of Electrically-Calcined Anthracite in Li-Ion Anodes
Peer-reviewed work published in early 2026 shows that blending Taixi anthracite with needle coke and graphitizing at 3,000 °C reaches 97.58% graphitization and 95% Coulombic efficiency, validating anthracite as a scalable synthetic-graphite precursor. Downstream cell makers in China, Japan, and the United States are piloting electrically-calcined anthracite routes that bypass constrained natural-graphite supplies and reduce dependence on petroleum needle coke, widening the addressable anthracite market.
High-Density Carbon-Brick Demand from Refractory Retrofits
Ladle and tundish upgrades in Indian blast furnaces are shifting toward magnesia-carbon bricks requiring anthracite with ≥90% fixed carbon. Coal India’s USD 430 million washeries program will raise washed-coal availability but also tighten the supply of alternative reductants, indirectly lifting demand for high-purity anthracite. The result is a differentiated price ladder in which refractory-grade anthracite outperforms standard fuel grades.
Restraints Impact Analysis*
| Restraint | (~) % Impact on CAGR Forecast | Geographic Relevance | Impact Timeline |
|---|---|---|---|
| Petroleum-coke and bio-carbon price discounting | -0.4% | Global, with acute pressure in North America cement and industrial fuel segments | Short term (≤ 2 years) |
| Seaborne freight-rate volatility and Red-Sea rerouting premiums | -0.3% | Seaborne trade routes (Asia-Europe, Asia-Middle-East, intra-Asia) | Short term (≤ 2 years) |
| Impending EU Carbon-Border Adjustment on embedded coal carbon | -0.2% | EU importers and third-country exporters (Russia, South Africa, Australia, China) | Medium term (2-4 years) |
| Source: Mordor Intelligence | |||
Petroleum-Coke and Bio-Carbon Price Discounting
High-sulfur U.S. Gulf Coast petcoke has traded as low as USD 60 per tonne in 2024-2026, slicing into anthracite’s share of cement kilns and industrial boilers. Pilot-scale bio-carbon trials in Swedish EAFs promise net-zero emissions and could accelerate displacement if supply chains mature. Producers counter by lengthening contract tenors and highlighting anthracite’s low ash and volatile-matter specs, where quality, not price, governs adoption.
Seaborne Freight-Rate Volatility and Red-Sea Rerouting Premiums
Conflict-related diversions around the Cape of Good Hope have added up to USD 15 per tonne in voyage surcharges since late 2025. Asian buyers holding destination-inclusive contracts pass the premium back to exporters, crimping margins and encouraging regional self-sufficiency strategies that could cap import growth in the anthracite market.
*Our forecasts treat driver/restraint impacts as directional, not additive. The impact forecasts reflect baseline growth, mix effects, and variable interactions.
Segment Analysis
By Grade: Calcined Variants Accelerate High-Purity Growth
Standard grade retained 47.12% share of the anthracite market in 2025, buoyed by traditional water-treatment, residential heating, and mid-tier metallurgy demand. The sub-segment’s margin, however, narrowed as petcoke undercut it in cement kilns and boilers. By contrast, calcined and electrically-calcined grades are forecast to rise at a 5.12% CAGR through 2031, capturing lithium-ion, sodium-ion, and fuel-cell anode orders that value fixed-carbon levels above 95%. Early-stage supply agreements between Chinese cell makers and Pennsylvanian and Siberian producers point to steady uptake that will lift the overall anthracite market size allocated to calcined grades during the forecast window.
Ultra-High Grade (UHG) anthracite, defined by ≥92% fixed carbon and ≤5% volatiles, sits at the apex of the value ladder and trades at premiums of 20-40% over Standard Grade. Menar’s Springlake Colliery purchase in 2025 added 720,000 tons per year of export-quality UHG material to global supply. Tight spec ranges make UHG indispensable in ferroalloy reduction and EAF injection, safeguarding a niche that absorbs freight shocks and regulatory costs better than lower-grade peers.


By Application: Metallurgy Dominates, Emergent Niches Multiply
Metallurgy consumed 56.21% of global anthracite in 2025, reflecting the material’s unmatched reductant performance in blast furnaces and ladle chemistry. Electric arc steel, ferro-silicon, and refractory manufacture collectively anchor base-load demand, yet their share is edging lower as non-traditional outlets expand. Other Applications, such as spanning ceramics, fuel cells, etc., are forecast to record a 5.41% CAGR through 2031, adding incremental volume and higher unit margins to the anthracite market. Municipal filtration retrofits and battery-grade graphite conversions stand out as two of the most lucrative pockets, each insulated from thermal-coal downturn dynamics.
Water and wastewater utilities keep procurement stable through multi-year contracts that hedge volatility, while activated-carbon producers benefit from anthracite’s micro-porosity and low ash that elevate adsorption capacity. Thermal power generation remains in structural decline across the OECD, but Eastern Europe and selected ASEAN grids still order spot volumes for combined-heat-and-power units compatible with local coal quality, preserving a shrinking but not yet obsolete demand tranche.
By End-user Industry: Steel Anchors, Energy Emerges Fastest
Steel and metallurgy accounted for 51.11% of 2025 revenue, an anchor that underpins global baseline demand and lends predictability to investment in new mines. Yet the energy and power is poised for the quickest growth at a 5.56% CAGR through 2031 as district-heating retrofits and coal-to-chemicals projects employ ultra-high grade anthracite to meet clean-coal mandates in India, Vietnam, and parts of Eastern Europe. For these operators, anthracite’s low ash boosts boiler efficiency and simplifies downstream flue-gas treatment, justifying premium freight differentials.
Chemicals and petrochemicals add another resilient layer through activated-carbon, carbon-black, and phosphorous reduction applications. Water utilities secure supply on reliability rather than price, recognizing the operational payoff from longer filter runs. A long tail of construction-material, electrode, and emerging battery-anode firms rounds out demand, offering producers diversification benefits that shelter the anthracite market from single-sector shocks.
Geography Analysis
Asia-Pacific dominated the anthracite market with 53.24% of 2025 demand and will post a 4.47% CAGR through 2031, propelled by China’s coal-to-chemicals rollouts and India’s 1 billion-tonne production target for FY 2028-29. China Shenhua’s restructuring, adding 13 subsidiaries for USD 35 billion, secures logistics and power assets that streamline supply from mine to port while expanding reserves by 25%. ASEAN states, notably Indonesia and Vietnam, continue to sanction coal-fired power and clinker capacity where imported anthracite’s high calorific value and low impurity profile confer advantages over domestic lignite.
North America’s anthracite market leans on Pennsylvania’s century-old basin, where Delta Dunia’s 2024 purchase of Atlantic Carbon Group united four ultra-premium mines under a USD 122.4 million umbrella[2]World Coal, “Atlantic Carbon Acquisition,” world-coal.com. Exports to Europe and Asia have expanded at double-digit rates since 2014, reflecting points of differentiation in volatile-matter content and low sulfur. Domestic thermal demand wanes as renewables and cheap gas capture utility capacity, but the filter-media and specialty-carbon niches sustain baseline throughput.
Europe witnesses contracting thermal demand yet retains a vibrant specialty segment. The EU’s Carbon Border Adjustment Mechanism nudges importers toward certified-low-emission cargoes, opening space for U.S. and South African suppliers able to document mine-site efficiencies. Eastern European district heating and Nordic water-treatment plants continue spot purchases, but long-run volumes hinge on the pace of coal phase-out policies. South America, led by Brazil, oscillates with currency swings and freight costs; Australian cargoes surged to 30% share in 2025-2026 after Russian supply faced geopolitical barriers. Africa’s epicenter is South Africa, where Menar’s expansion gives the region an export-oriented, ultra-high-grade anchor, even as Transnet reforms open third-party rail slots that could lower FOB costs and grow volumes into the anthracite market.

Competitive Landscape
The anthracite market remains structurally fragmented; the top five producers collectively control about 24% of global output in 2025, assigning bargaining power to large buyers but also enabling regional arbitrage. Recent M&A, however, signals tightening concentration in ultra-high-grade assets. Delta Dunia’s Atlantic Carbon Group and Menar’s Springlake acquisitions illustrate how strategic buyers are ring-fencing low-impurity ore bodies to guarantee supply for low-carbon steel and battery material customers. Similarly, Shenhua’s asset consolidation aligns reserves with captive power and rail, leveraging scale to weather CBAM fees and freight surcharges.
Technology deployment further differentiates cost curves. Sibanthracite’s remote-operated longwalls in Novosibirsk reduce manual exposure and deliver up to 15% cost savings, while Reading Anthracite pilots selective-mining software that minimizes dilution and raises average fixed carbon. Compliance capabilities add a new layer of competition: ISO-accredited labs for water-media testing and third-party CBAM verification have become prerequisites for European tenders, shutting out many smaller exporters.
White-space opportunities emerge in electrically-calcined capacity. Early customers include Japanese anode fabricators seeking alternative precursors amid supply-chain de-risking, positioning first movers to capture loyalty and premium margins before commoditization sets in.
Anthracite Industry Leaders
CHINA SHENHUA
Sibanthracite Group
Blaschak Anthracite
Coal India Limited
Xcoal Energy & Resources
- *Disclaimer: Major Players sorted in no particular order

Recent Industry Developments
- January 2026: Reading & Northern Railroad (R&N) in Pennsylvania transported over a million tons of anthracite coal for the third consecutive year. This achievement was driven by a nearly 20% increase in demand from U.S. steel producers, prompting R&N to acquire new covered hopper cars to manage the higher volumes.
- June 2024: BUMA International Group completed its acquisition of Atlantic Carbon Group, Inc. (ACG), based in Pennsylvania, for USD 122.4 million. This move ensured a consistent supply of ultra-high-grade (UHG) anthracite to meet the growing demands of electric arc furnace (EAF) steelmaking.


Global Anthracite Market Report Scope
Anthracite, also referred to as "hard coal," is the highest rank of coal. It is distinguished by its high carbon content (86–98%), brilliant metallic luster, and low volatile matter. This dense, hard metamorphic rock burns slowly, producing a hot, pale blue, smokeless flame.
The Anthracite Market is segmented by grade, application, end-user industry, and geography. By grade, the market is segmented into standard grade, ultra-high grade (UHG), and calcined and electrically-calcined grade. By application, the market is segmented into metallurgy (steel, ferro-alloys, refractories), water and waste-water filtration, thermal power generation and combined heat and power (CHP), chemical feedstock and carbon products, and other applications (ceramics, fuel cells, etc.). By end-user industry, the market is segmented into steel and metallurgy, chemicals and petrochemicals, water treatment utilities, energy and power, and other end-user industries (construction materials, carbon products, etc.). The report also covers the market size and forecasts for anthracite in 17 countries across major regions. For each segment, the market sizing and forecasts have been done on the basis of value (USD).
| Standard Grade |
| Ultra-High Grade (UHG) |
| Calcined and Electrically-Calcined Grade |
| Metallurgy (Steel, Ferro-alloys, Refractories) |
| Water and Waste-Water Filtration |
| Thermal Power Generation and CHP |
| Chemical Feedstock and Carbon Products |
| Other Applications (Ceramics, Fuel Cells, etc.) |
| Steel and Metallurgy |
| Chemicals and Petrochemicals |
| Water Treatment Utilities |
| Energy and Power |
| Other End-user Industries (Construction Materials, Carbon Products, etc.) |
| Asia-Pacific | China |
| Japan | |
| India | |
| South Korea | |
| ASEAN Countries | |
| Rest of Asia-Pacific | |
| North America | United States |
| Canada | |
| Mexico | |
| Europe | Germany |
| United Kingdom | |
| France | |
| Italy | |
| Spain | |
| Russia | |
| NORDIC Countries | |
| Rest of Europe | |
| South America | Brazil |
| Argentina | |
| Rest of South America | |
| Middle-East and Africa | Saudi Arabia |
| South Africa | |
| Rest of Middle-East and Africa |
| By Grade | Standard Grade | |
| Ultra-High Grade (UHG) | ||
| Calcined and Electrically-Calcined Grade | ||
| By Application | Metallurgy (Steel, Ferro-alloys, Refractories) | |
| Water and Waste-Water Filtration | ||
| Thermal Power Generation and CHP | ||
| Chemical Feedstock and Carbon Products | ||
| Other Applications (Ceramics, Fuel Cells, etc.) | ||
| By End-user Industry | Steel and Metallurgy | |
| Chemicals and Petrochemicals | ||
| Water Treatment Utilities | ||
| Energy and Power | ||
| Other End-user Industries (Construction Materials, Carbon Products, etc.) | ||
| By Geography | Asia-Pacific | China |
| Japan | ||
| India | ||
| South Korea | ||
| ASEAN Countries | ||
| Rest of Asia-Pacific | ||
| North America | United States | |
| Canada | ||
| Mexico | ||
| Europe | Germany | |
| United Kingdom | ||
| France | ||
| Italy | ||
| Spain | ||
| Russia | ||
| NORDIC Countries | ||
| Rest of Europe | ||
| South America | Brazil | |
| Argentina | ||
| Rest of South America | ||
| Middle-East and Africa | Saudi Arabia | |
| South Africa | ||
| Rest of Middle-East and Africa | ||


Key Questions Answered in the Report
What is the size of the anthracite market?
The anthracite market stands at USD 128.55 billion in 2026 and is projected to reach USD 158.75 billion by 2031.
Which grade of anthracite is growing fastest through 2031?
Calcined and electrically-calcined grade is set to expand at a 5.12% CAGR through 2031 on the strength of battery-anode and ultra-low-ash steel demand.
Why is Asia-Pacific the leading growth region through 2031?
China’s coal-to-chemicals build-out and India’s push toward 1 billion tons of coal output by FY 2028-29 anchor over half of global demand and keep the region on a 4.47% CAGR path to 2031.
How does the EU Carbon Border Adjustment Mechanism affect anthracite exporters?
From 2026, importers must buy certificates priced to EU ETS allowances for a default 98.3 tons CO₂/TJ factor, raising delivered costs unless exporters document lower actual emissions.
Page last updated on:


