America Cancer Immunotherapy Market Size and Share
Market Overview
| Study Period | 2020 - 2031 |
|---|---|
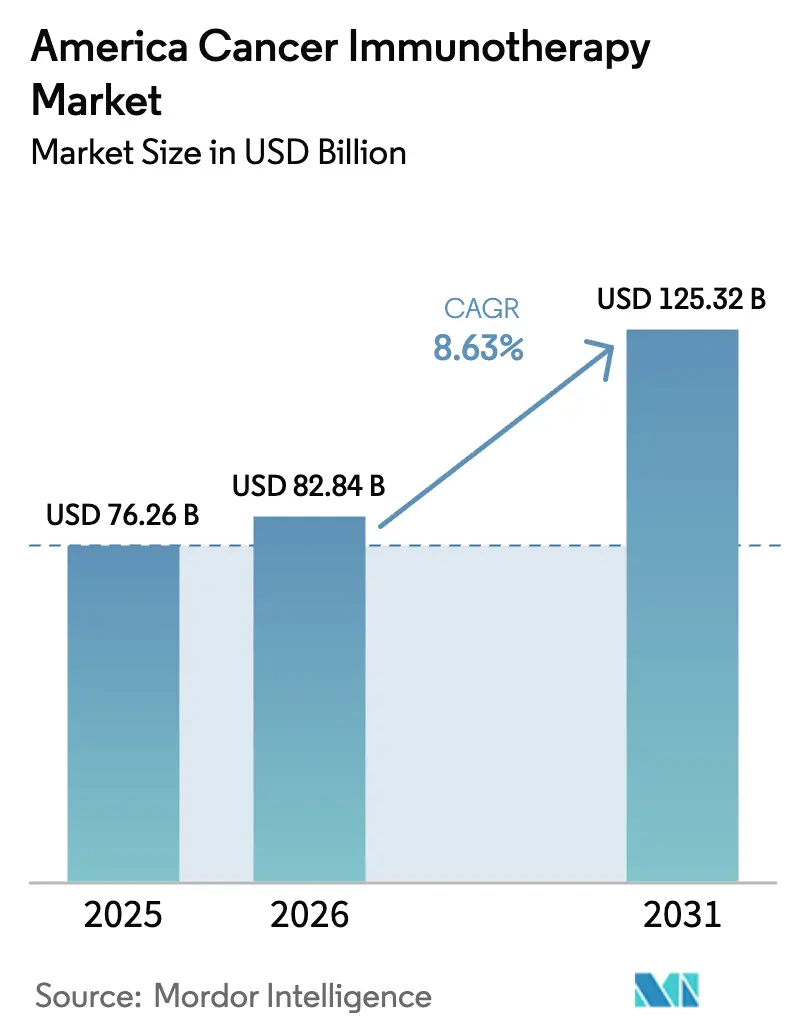
| Base Year Market Size (2025) | USD 76.26 Billion |
| Market Size (2026) | USD 82.84 Billion |
| Market Size (2031) | USD 125.32 Billion |
| Growth Rate (2026 - 2031) | 8.63% CAGR |
| Fastest Growing Market | South America |
| Largest Market | North America |
Major Players *Disclaimer: Major Players sorted in no particular order Image © Mordor Intelligence. Reuse requires attribution under CC BY 4.0. | |
America Cancer Immunotherapy Market Analysis by Mordor Intelligence
America cancer immunotherapy market size in 2026 is estimated at USD 82.84 billion, growing from 2025 value of USD 76.26 billion with 2031 projections showing USD 125.32 billion, growing at 8.63% CAGR over 2026-2031. Breakthrough approvals in cell-based therapies, rapid adoption of AI-guided biomarker discovery, and an FDA push for optimized oncologic dosing collectively reshape the treatment landscape. Increased manufacturing capacity investments, such as Gilead’s plans to quadruple CAR-T output by 2026, signal a transition from niche procedures to scalable care across the region. Competitive pressure intensifies as large biopharma players secure licensing deals for bispecifics and neoantigen platforms to diversify pipelines. Regulatory convergence between the FDA and ANVISA reduces duplication of pivotal studies, quickening time-to-market for innovative modalities. Capacity constraints for autologous cell therapies remain the chief bottleneck; however, automated production alliances are beginning to resolve supply imbalances.
Key Report Takeaways
- By therapy type, monoclonal antibodies led with 44.90% of America cancer immunotherapy market share in 2025, while cell-based therapies are projected to expand at a 17.70% CAGR through 2031.
- By cancer type, lung cancer accounted for 26.23% of the America cancer immunotherapy market size in 2025; hematologic malignancies are expected to grow fastest at 16.64% CAGR to 2031.
- By geography, North America held 55.12% revenue share in 2025, whereas South America is poised for the highest 13.94% CAGR between 2026-2031.
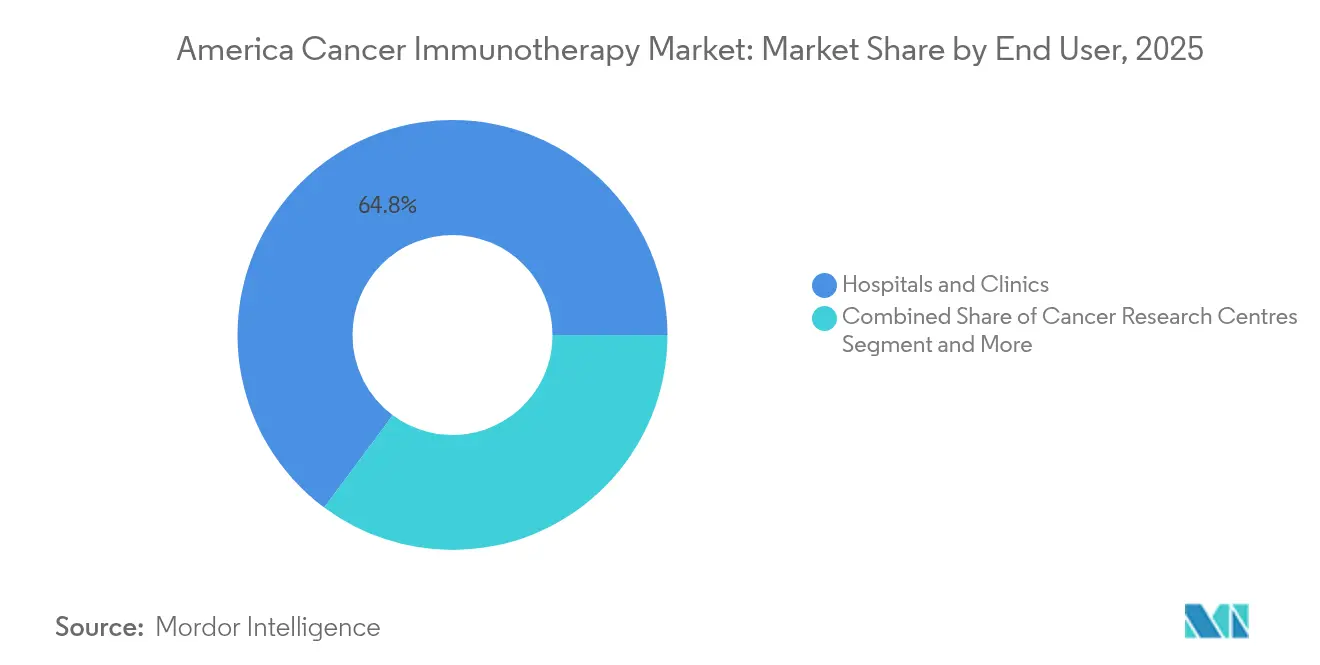
- By end user, hospitals and clinics captured 64.82% of the America cancer immunotherapy market share in 2025, while academic and cancer research centers register a 10.31% CAGR through 2031.
- By route of administration, intravenous products secured 64.95% share of the America cancer immunotherapy market size in 2025; subcutaneous and intratumoral formats advance at a 11.98% CAGR to 2031.
Note: Market size and forecast figures in this report are generated using Mordor Intelligence’s proprietary estimation framework, updated with the latest available data and insights as of 2026.
America Cancer Immunotherapy Market Trends and Insights
Drivers Impact Analysis*
| Driver | (~) % Impact on CAGR Forecast | Geographic Relevance | Impact Timeline |
|---|---|---|---|
| Rapid R&D Productivity Gains | 2.1% | Global, with concentration in North America | Medium term (2-4 years) |
| High & Rising Cancer Incidence | 1.8% | Americas-wide, particularly aging populations | Long term (≥ 4 years) |
| Expansion Of FDA/ANVISA Approvals | 1.5% | North America primary, South America emerging | Short term (≤ 2 years) |
| Uptake Of Immune-Checkpoint Inhibitors | 1.3% | North America and urban South America | Medium term (2-4 years) |
| Personalised Neoantigen Vaccines Pipeline | 0.9% | North America and select South American centers | Long term (≥ 4 years) |
| AI-Driven Biomarker Discovery For Responder ID | 0.7% | Technology hubs in North America | Medium term (2-4 years) |
| Source: Mordor Intelligence | |||
Rapid R&D Productivity Gains
AI-enhanced biomarker analytics, adaptive trial protocols, and automated cell-therapy production lines shorten clinical development cycles. Merck and Moderna secured FDA Breakthrough Therapy Designation for their mRNA-4157/V940 personalized vaccine in high-risk melanoma just two years after first-in-human dosing, underscoring this acceleration. As late-stage failure risk falls, capital efficiency improves and more novel assets progress into pivotal studies. Automated cell-therapy platforms, such as Cellares’ system reserved by Bristol Myers Squibb for USD 380 million, further compress production timelines[1]Bristol Myers Squibb, “Bristol Myers Squibb and Cellares Announce a $380M Worldwide Capacity Reservation and Supply Agreement for the Manufacture of CAR T Cell Therapies,” news.bms.com. This virtuous cycle positions the America cancer immunotherapy market to bring first-in-class therapies to patients in 5-7 years instead of the historical decade-plus horizon.
High & Rising Cancer Incidence
An aging North American population and shifting lifestyle patterns across South America propel immunotherapy demand. Viral-infection-linked cancers among younger South Americans increase suitability for vaccine-based immunotherapies. Tumors with high mutational burden create abundant neoantigens, enhancing immunotherapy responsiveness. Health systems respond by adding immuno-oncology units and expanding diagnostic capacity, especially in urban centers with elevated environmental risk factors. As incidence grows faster than population, long-term service demand stays resilient, reinforcing revenue visibility for therapy developers.
Expansion of FDA/ANVISA Approvals
Harmonized guidance and broader use of real-world evidence enable dual-region filings based on unified data sets[2]Food and Drug Administration, “Optimizing the Dosage of Human Prescription Drugs and Biological Products for the Treatment of Oncologic Diseases,” fda.gov. Accelerated pathways support label expansions for checkpoint inhibitors and CAR-T constructs, shortening commercialization cycles. ANVISA’s alignment with FDA dosing-optimization protocols reduces redundant Phase 1 work, making South America more attractive for global trial sponsors. Breakthrough Therapy Designation frequency for immuno-oncology assets rises, further de-risking development expenditures.
Uptake of Immune-Checkpoint Inhibitors
Checkpoint inhibitors progress from mono-therapy toward rational combos targeting multiple resistance nodes. The Opdivo-ipilimumab-chemotherapy triple achieved durable 5-year overall-survival benefits in non-small-cell lung cancer. Next-wave bispecifics, such as BioNTech’s BNT327 targeting PD-L1 and VEGF-A, delivered 85.4% overall response in extensive-stage small cell lung cancer. Broader biomarker panels refine patient selection beyond PD-L1, increasing response probability and supporting earlier-stage deployment.
Restraints Impact Analysis*
| Restraint | (~) % Impact on CAGR Forecast | Geographic Relevance | Impact Timeline |
|---|---|---|---|
| Immune-Related Adverse Events | -1.2% | Global, with higher impact in resource-limited settings | Short term (≤ 2 years) |
| High Therapy & Management Costs | -0.8% | Americas-wide, particularly acute in South America | Medium term (2-4 years) |
| Reimbursement Uncertainty In LATAM | -0.6% | South America and Mexico | Medium term (2-4 years) |
| Tumour-Micro-Environment Resistance Heterogeneity | -0.4% | Global, affecting all therapeutic modalities | Long term (≥ 4 years) |
| Source: Mordor Intelligence | |||
Immune-Related Adverse Events
Combination regimens heighten risk of grade 3-4 irAEs, recorded in 52.8% of checkpoint-inhibitor recipients during 2025 studies. Hospitals must deploy multidisciplinary teams and predictive biomarkers to minimize morbidity. Prolonged hospitalization and immunosuppressant use inflate direct costs, potentially delaying adoption in smaller centers. Early-warning algorithms and tighter monitoring protocols are central to sustaining therapy uptake without compromising safety.
High Therapy & Management Costs
Autologous CAR-T infusions cost USD 400,000–500,000 per patient, exclusive of infrastructure, diagnostics, and after-care. Comprehensive tumor profiling adds USD 3,000–5,000 per case, stretching payer budgets in South America. Health systems respond by concentrating services in centers of excellence and piloting value-based contracts that link reimbursement to measurable outcomes. Nonetheless, high up-front costs may slow penetration in price-sensitive markets.
*Our forecasts treat driver/restraint impacts as directional, not additive. The impact forecasts reflect baseline growth, mix effects, and variable interactions.
Segment Analysis
By Therapy Type: Cell-Based Therapies Drive Innovation
Monoclonal antibodies held 44.90% of America cancer immunotherapy market share in 2025, retaining frontline status in solid tumors and hematologic malignancies. Cell-based therapies commanded the fastest 17.70% CAGR on expanding CAR-T indications and next-generation NK-cell products. Automated manufacturing alliances, including Bristol Myers Squibb’s USD 380 million reservation with Cellares, address historical supply shortfalls and position the modality for broader commercial scale. Personalized neoantigen vaccines emerge as complementary prophylactic-therapeutic tools, buoyed by AI-enabled target discovery. Oncolytic viruses deliver localized immunogenic cell death, enhancing checkpoint-inhibitor synergy in cold tumors.
Combination regimens integrate monoclonal antibodies, cell therapies, and immunomodulators to overcome resistance. Bispecific platforms such as BNT327 illustrate convergence of antibody engineering with multi-pathway blockade in solid tumors. Manufacturing efficiency gains lower cost per dose, supporting payer acceptance. Regulatory bodies craft specific CMC guidance for complex biologics, smoothing licensure pathways while ensuring safety. Consequently, the America cancer immunotherapy market anticipates steady diversification of mechanism portfolios through 2031.


By Cancer Type: Hematologic Malignancies Lead Growth
Lung cancer represented 26.23% of the America cancer immunotherapy market size in 2025, driven by checkpoint-inhibitor dominance in non-small-cell subtypes. Hematologic malignancies post the highest 16.64% CAGR as CAR-T and bispecific T-cell engagers secure durable responses in refractory blood cancers. Phase 1 PSCA-CAR-T data in metastatic prostate cancer broadens the therapeutic scope beyond classical B-cell targets. Melanoma remains a testbed for tumor-infiltrating lymphocyte therapy; lifileucel plus pembrolizumab continues to show promising efficacy.
Advances in tumor biology elucidate neoantigen landscapes, improving precision matching of immunotherapies to indications with high mutational burden. Biomarker-driven trial enrollment trims attrition rates and supports earlier-line use. Expanding into adjuvant and neoadjuvant settings elevates total addressable patients, ensuring the America cancer immunotherapy market sustains multi-cycle revenue gains.
By End User: Academic Centers Drive Innovation
Hospitals and clinics retained 64.82% market share in 2025, reflecting their embedded oncology infrastructure and payer contracting depth. Academic and cancer research centers register a 10.31% CAGR as they anchor complex trials and adopt cutting-edge personalized protocols. Integration of research with clinical practice attracts sponsor funding and high-acuity patients, reinforcing their growth trajectory. Real-world evidence programs promoted by the FDA elevate the importance of longitudinal outcome tracking, favoring data-rich academic ecosystems.
Tele-oncology partnerships extend specialty care to community practices, enabling decentralized infusion while preserving academic oversight. Workforce training initiatives bolster competency in cell-handling, adverse-event management, and genomic interpretation. As a result, the America cancer immunotherapy industry increasingly revolves around hybrid networks where academic hubs orchestrate care across multi-site consortia.
By Route of Administration: Subcutaneous Innovation
Intravenous products accounted for 64.95% of America cancer immunotherapy market share in 2025, remaining the default for biologics and cell infusions. Subcutaneous and intratumoral routes post 11.98% CAGR on convenience and emerging sustained-release formats. Nivolumab’s subcutaneous formulation reduces chair time and resource utilization, improving patient adherence. Intratumoral delivery concentrates agents at tumor sites, lowering systemic toxicity profiles in accessible lesions.
Near-infrared photoimmunotherapy combines localized light activation with antibody targeting, showing feasibility in unresectable head and neck cancer. Wearable pumps and implantable depots further diversify administration options, paving the way for home-based or ambulatory dosing models. Regulatory agencies develop bespoke guidance for novel delivery devices, facilitating broader uptake of patient-centric regimens within the America cancer immunotherapy market.
Geography Analysis
North America held 55.12% of America cancer immunotherapy market revenue in 2025, underpinned by a dense network of oncology centers, favorable reimbursement policies, and clear regulatory frameworks. United States performance hinges on blockbusters like Keytruda, which generated USD 25 billion sales in 2023, funding continued pipeline expansion. Canada benefits from single-payer purchasing leverage, accelerating adoption of cost-effective biosimilars. Mexico operates as a bridging market for multinational trials targeting wider Latin American enrollment. Ongoing capacity builds, including AstraZeneca’s USD 300 million cell-therapy plant in Maryland, mitigate supply bottlenecks.
South America posts the fastest 13.94% CAGR, reflecting regulatory alignment with the FDA and rising public-sector oncology budgets. Brazil spearheads adoption via partnerships such as ImmunityBio’s Cancer BioShield platform introduction, bolstering local manufacturing and training frameworks. Argentina’s biosimilar strategy reduces therapy acquisition costs, improving affordability across public hospitals. Chile pioneers value-based contracts linking payment to survival metrics, establishing a template for neighboring states.
Secondary South American markets - Colombia, Peru, and others - embrace tele-oncology networks and regional clinical-trial consortia to broaden access. Harmonized dossier requirements allow sponsors to repurpose North American data, shortening approval times. AI-assisted diagnostic solutions enable community clinics to identify eligible patients for sophisticated therapies, thereby enlarging the potential patient pool for the America cancer immunotherapy market.
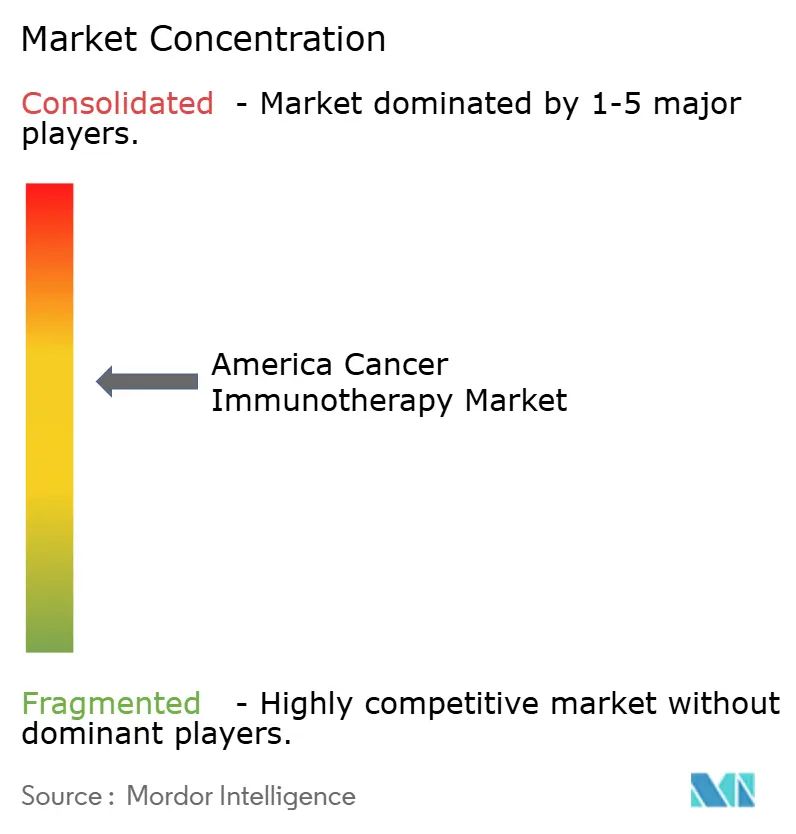
Competitive Landscape
The America cancer immunotherapy market remains moderately consolidated, with established players wielding scale advantages in manufacturing, distribution, and multi-indication study execution. Merck and Bristol Myers Squibb leverage deep clinical infrastructures to defend leading positions, while investing in bispecifics, neoantigen vaccines, and automated cell-therapy platforms to future-proof portfolios. Bristol Myers Squibb’s USD 11.1 billion partnership with BioNTech exemplifies megadeals that secure access to transformative technologies.
Emerging biotechnology firms differentiate through novel mechanisms and nimble development models. Cellares, Lyell Immunopharma, and AGC Biologics focus on automation and personalized vaccine manufacturing to lower cost-of-goods and expand throughput. The FDA’s standardized guidance on CAR-T development equalizes regulatory expectations, enabling smaller companies to advance assets without disproportionate compliance burdens.
White-space opportunities persist in tumors with immunologically cold microenvironments and in rare cancers lacking targeted options. Strategic licensing of regional commercialization rights and co-development agreements dominate deal flow, as large incumbents prioritize rapid access to breakthrough platforms. Portfolio pruning by major companies reallocates resources toward high-value immuno-oncology assets, cementing the modality as a core growth pillar within the America cancer immunotherapy market.
America Cancer Immunotherapy Industry Leaders
Amgen Inc.
Bayer AG
Bristol-Myers Squibb
Eli Lilly and Company
F. Hoffman La Roche Ltd
- *Disclaimer: Major Players sorted in no particular order

Recent Industry Developments
- June 2025: Bristol Myers Squibb and BioNTech entered a global partnership worth up to USD 11.1 billion to co-develop BNT327, a bispecific antibody targeting PD-L1 and VEGF-A for multiple solid tumors.
- March 2024: Gilead Sciences announced plans to quadruple CAR-T manufacturing capacity by 2026 to meet rising demand.


Research Methodology Framework and Report Scope
Market Definitions and Key Coverage
The study treats the America cancer immunotherapy market as all U.S., Canadian, Mexican, Brazilian, Argentinian, and other South American sales of medicines that prime, boost, or replace elements of the patient's immune system to recognize and destroy malignant cells, principally monoclonal antibodies, checkpoint inhibitors, cell-based therapies, vaccines, and immunomodulators. According to Mordor Intelligence, the market is valued at USD 76.26 billion in 2025 and is projected to reach USD 116.05 billion by 2030.
Scope Exclusions: supportive diagnostics, conventional chemotherapy, radiotherapy equipment, and non-oncology immunotherapies remain outside our remit.
Segmentation Overview
- By Therapy Type
- Monoclonal Antibodies
- Cancer Vaccines
- Immunomodulators (Cytokines, Adjuvants)
- Cell-based Therapies
- Oncolytic Virus Therapies
- Combination Regimens
- By Cancer Type
- Lung Cancer
- Breast Cancer
- Melanoma & Skin Cancers
- Prostate Cancer
- Hematologic Malignancies (Leukemia, Lymphoma, Myeloma)
- Others (CRC, Gastric, Renal, etc.)
- By End User
- Hospitals & Clinics
- Cancer Research Centres
- Speciality Oncology Centres
- Other End-Users
- By Route of Administration
- Intravenous
- Sub-cutaneous / Intratumoral
- Geography
- North America
- United States
- Canada
- Mexico
- South America
- Brazil
- Argentina
- Rest of South America
- North America
Detailed Research Methodology and Data Validation
Primary Research
Mordor analysts interviewed practicing oncologists, reimbursement advisors, hospital pharmacy buyers, and manufacturing executives across the United States, Canada, Brazil, and Mexico. These conversations validated dosing mix shifts, average treatment durations, emerging biomarker adoption, and the realistic speed at which new approvals penetrate formularies.
Desk Research
We compiled foundational statistics from open-access bodies such as the National Cancer Institute, CDC, Health Canada, Brazil's INCA, the WHO Cancer Observatory, and regional customs portals, then cross-checked trends against peer-reviewed journals (NEJM, Lancet Oncology) and key association portals such as ASCO and AACR. Commercial context was enriched through SEC 10-Ks, clinical trial registries, and curated hits from Dow Jones Factiva and D&B Hoovers. These sources provide incidence curves, therapy uptake rates, trial pipelines, and company revenue splits that anchor our baseline. The list above is illustrative, not exhaustive; numerous additional repositories were tapped for corroboration.
Market-Sizing & Forecasting
A top-down prevalence-to-treated-patient model converts national cancer incidence into immunotherapy candidate pools, adjusts for eligibility and payer acceptance, and multiplies by therapy penetration and weighted ASPs. Supplier roll-ups and channel checks provide bottom-up spot signals that fine-tune totals. Key variables include lung and breast cancer incidence trajectories, checkpoint inhibitor approval counts, median treatment cycles, LATAM reimbursement lag, and biosimilar ASP erosion. Multivariate regression combined with scenario analysis extends the forecast to 2030, with sensitivity around policy and pipeline milestones.
Data Validation & Update Cycle
Outputs pass three-stage peer review, variance checks against external spend trackers, and anomaly flags triggered by quarterly filings. Reports refresh annually; material events (e.g. landmark approvals) prompt interim revisions, and an analyst revalidates figures before client delivery.
Why Mordor's America Cancer Immunotherapy Baseline Earns Trust
Published 2024/25 estimates vary widely, USD 51.83 billion to USD 93.1 billion, because providers choose different geographies, product mixes, and ASP assumptions; one 2023 figure of USD 55.79 billion focuses only on North America hospital channels.
Benchmark comparison
| Market Size | Anonymized source | Primary gap driver |
|---|---|---|
| USD 76.26 bn (2025) | Mordor Intelligence | - |
| USD 55.79 bn (2023) | Regional Consultancy A | Excludes South America and cell therapies; uses hospital purchases only |
| USD 51.83 bn (2024) | Global Consultancy B | Omits Mexico and Argentina; applies flat ASP deflation across all classes |
| USD 93.10 bn (2024) | Trade Journal C | Blends global CAR-T revenue into regional total; converts at spot FX without historical averaging |
The comparison shows that when scope, product basket, and currency logic diverge, totals swing sharply. By anchoring to clear geographic borders, therapy definitions, and multi-variable ASP tracking, and by updating every twelve months, Mordor delivers a balanced, repeatable baseline decision-makers can rely on.


Key Questions Answered in the Report
What is the current size of the America cancer immunotherapy market?
The market totaled USD 82.84 billion in 2026 and is on track to reach USD 125.32 billion by 2031.
Which therapy class is expanding fastest?
Cell-based therapies, led by CAR-T products, post the highest 17.70% CAGR through 2031.
Which region will grow quickest within the market?
South America registers the fastest 13.94% CAGR, propelled by regulatory harmonization and new manufacturing partnerships.
Why are academic centers gaining market share?
Academic and cancer research centers drive clinical trial enrollment and personalized therapy development, supporting a 10.31% CAGR.
What is the main barrier to broader adoption of advanced cell therapies?
High manufacturing costs and complex logistics keep prices elevated, although automated capacity expansions are beginning to ease constraints.
How are regulatory agencies accelerating approvals?
The FDA and ANVISA employ aligned guidance documents, breakthrough designations, and real-world evidence frameworks to shorten review times for innovative immunotherapies.
Page last updated on:


