Ambulatory Infusion Centers Market Size and Share
Market Overview
| Study Period | 2020 - 2031 |
|---|---|
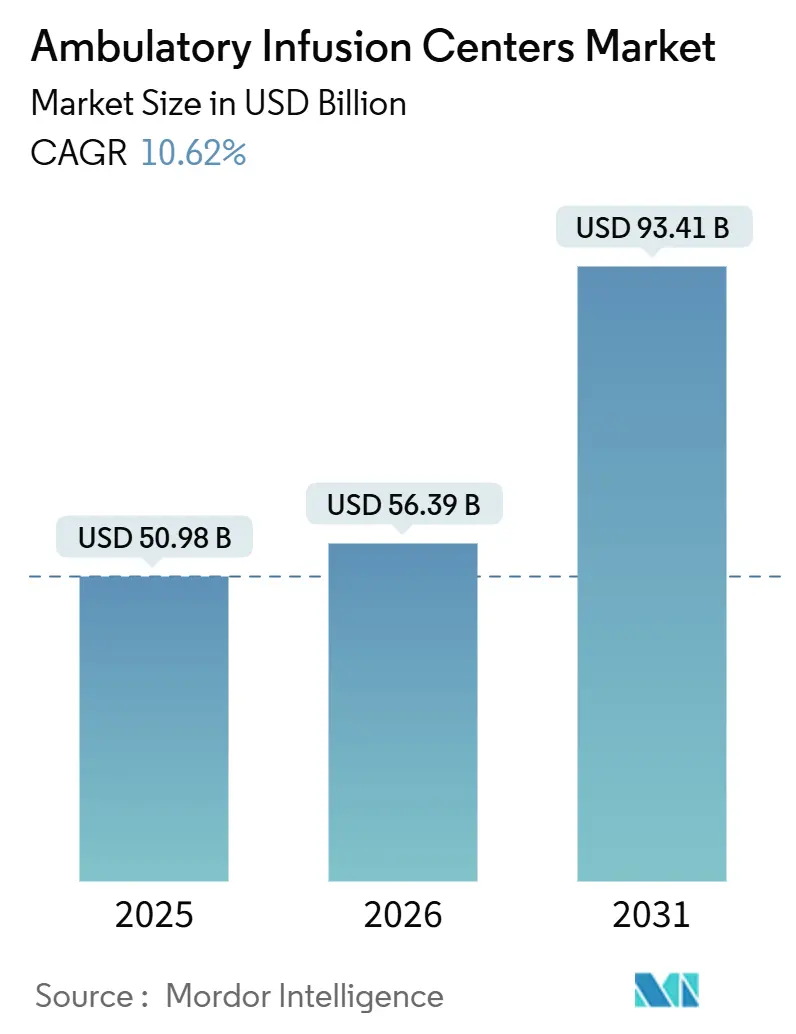
| Market Size (2026) | USD 56.39 Billion |
| Market Size (2031) | USD 93.41 Billion |
| Growth Rate (2026 - 2031) | 10.62% CAGR |
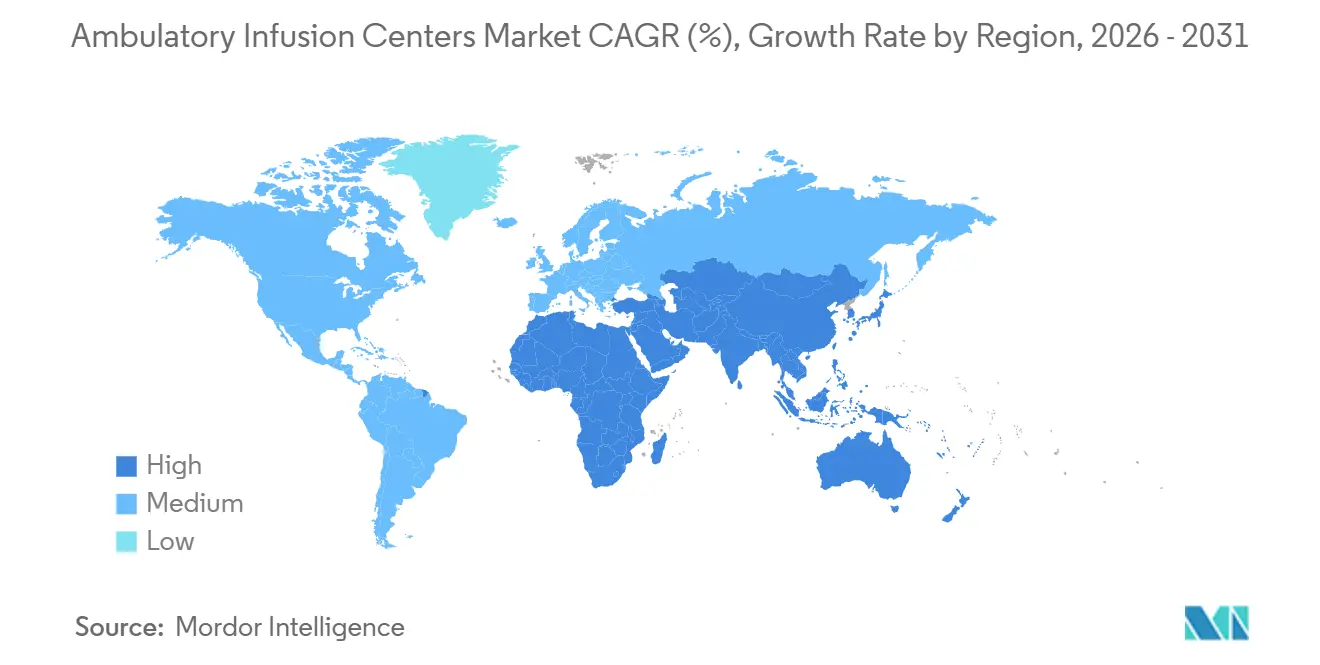
| Fastest Growing Market | Asia Pacific |
| Largest Market | North America |
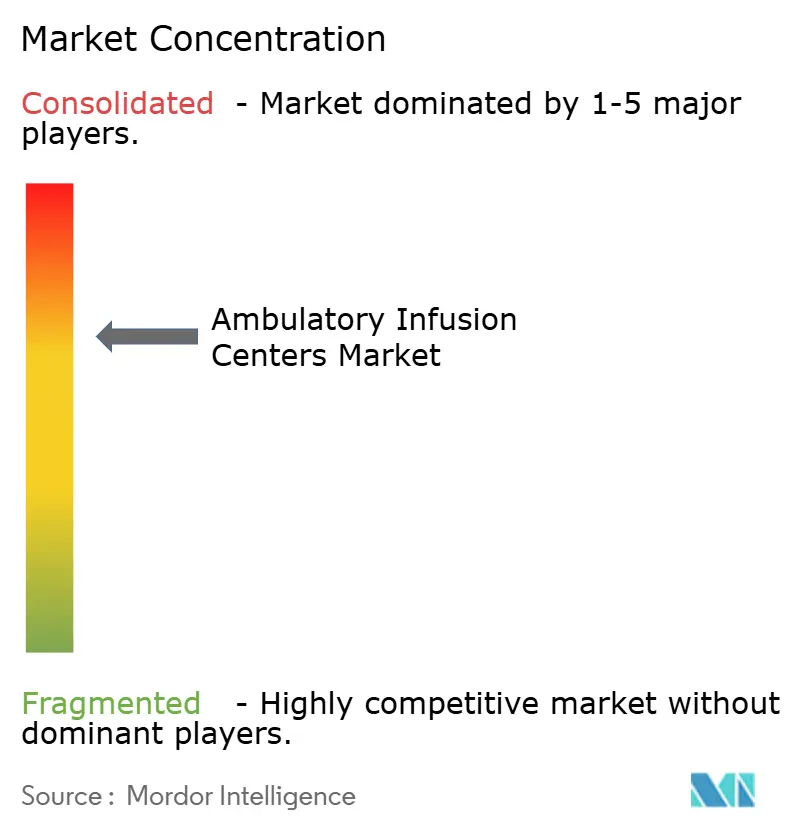
| Market Concentration | Medium |
Major Players *Disclaimer: Major Players sorted in no particular order Image © Mordor Intelligence. Reuse requires attribution under CC BY 4.0. | |
Ambulatory Infusion Centers Market Analysis by Mordor Intelligence
The Ambulatory Infusion Centers Market size is expected to increase from USD 50.98 billion in 2025 to USD 56.39 billion in 2026 and reach USD 93.41 billion by 2031, growing at a CAGR of 10.62% over 2026-2031.
Payer-driven site-neutral payment policies are accelerating patient migration from hospital outpatient departments to freestanding sites, compressing the reimbursement differential by 18% to 22% for the most common infusion codes. Immunoglobulin therapy dominated revenue in 2025, although antibiotic and anti-infective protocols now scale fastest as outpatient parenteral antimicrobial therapy replaces prolonged inpatient stays. Oncology retained the largest application share, yet neurology infusions are outpacing every other therapeutic area, as high-cost monoclonal antibodies require predictable scheduling and intensive monitoring, both of which are unavailable in crowded hospital pharmacies. Meanwhile, private-equity sponsors are consolidating regional operators, injecting capital for standardized workflows that deliver 30% to 40% per-infusion cost savings without compromising quality or safety.
Key Report Takeaways
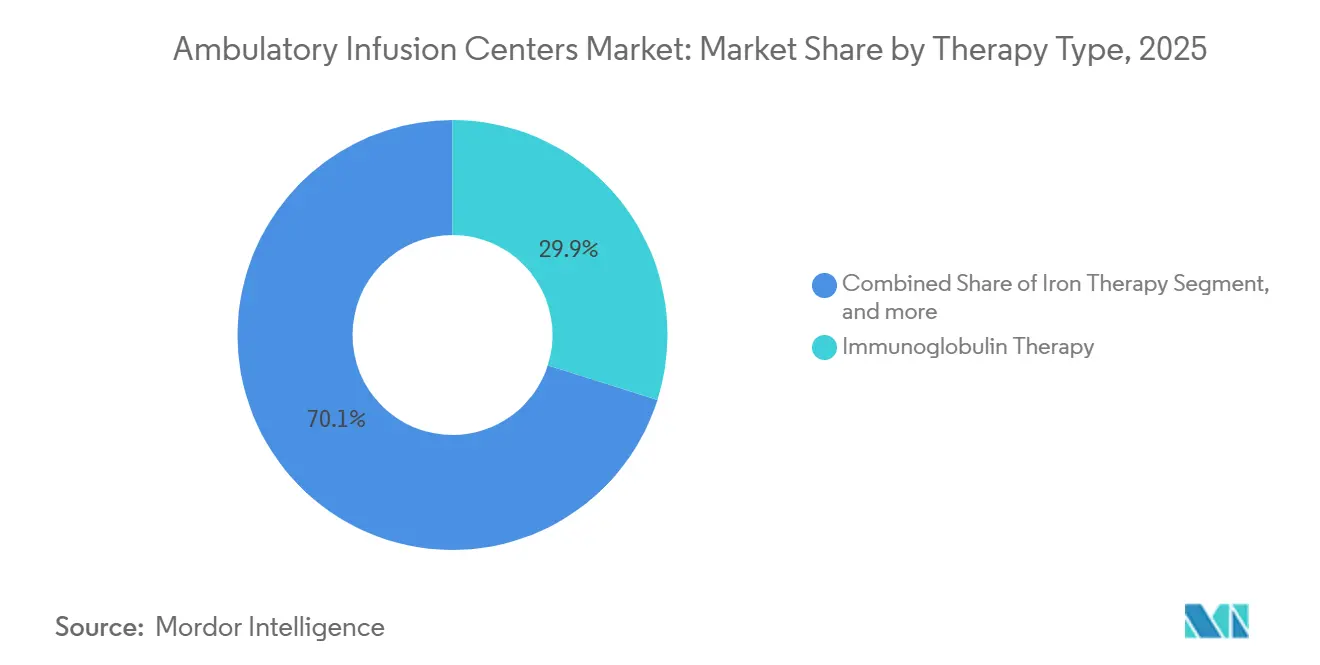
- By therapy type, immunoglobulin therapy led with 29.88% of the ambulatory infusion centers market share in 2025, while antibiotic and anti-infective infusions are projected to expand at a 12.76% CAGR through 2031.
- By application, oncology accounted for 33.09% of the ambulatory infusion centers market size in 2025, and neurology is advancing at a 13.21% CAGR through 2031.
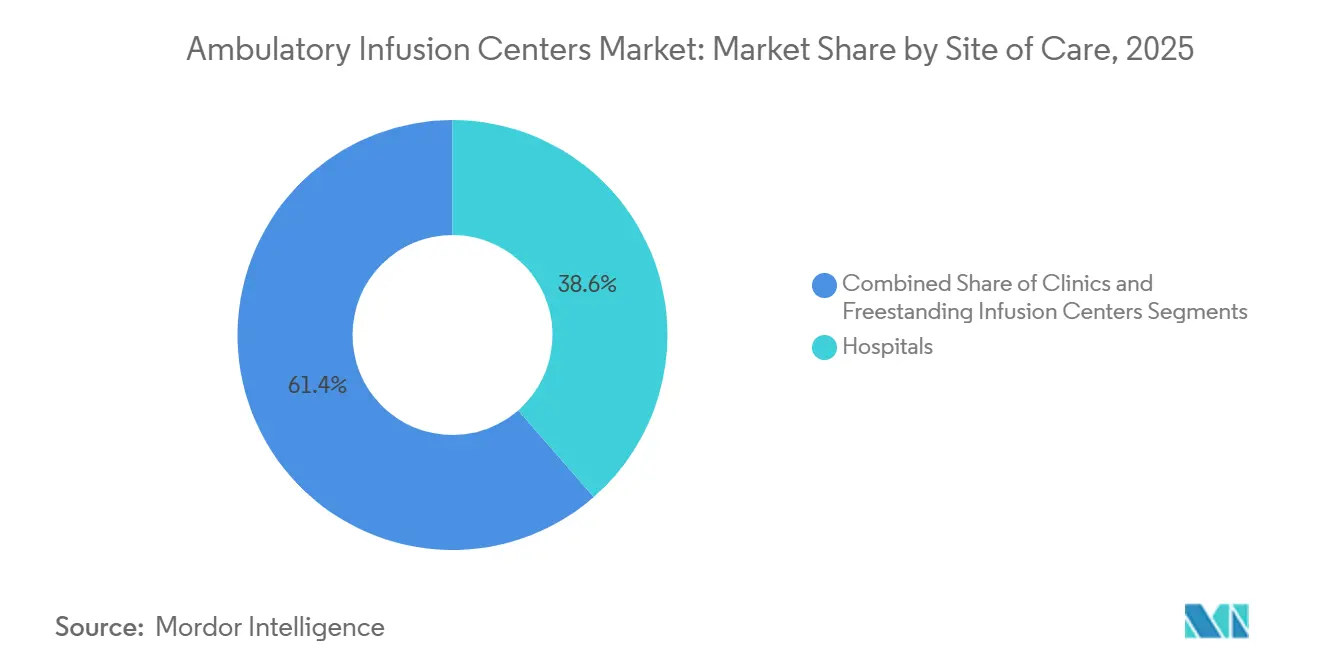
- By site of care, hospitals held 38.59% share of the ambulatory infusion centers market size in 2025, whereas freestanding centers are forecast to grow at a 12.54% CAGR between 2026 and 2031.
- By ownership model, hospital-owned centers commanded 40.21% share in 2025, yet independent specialty providers are projected to advance at a 13.22% CAGR through 2031.
- By geography, North America represented 43.43% revenue share in 2025 and Asia-Pacific is set to grow at an 11.54% CAGR to 2031.
Note: Market size and forecast figures in this report are generated using Mordor Intelligence’s proprietary estimation framework, updated with the latest available data and insights as of January 2026.
Global Ambulatory Infusion Centers Market Trends and Insights
Drivers Impact Analysis*
| Driver | (~) % Impact on CAGR Forecast | Geographic Relevance | Impact Timeline |
|---|---|---|---|
| Government-Led Healthcare Decentralization Policies | +2.3% | North America & Europe, spillover to APAC | Medium term (2-4 years) |
| Rising Global Burden of Chronic and Autoimmune Diseases | +2.1% | Global, with concentration in North America & Europe | Long term (≥4 years) |
| Payer Incentives for Cost-Efficient Outpatient Care | +1.9% | North America core, expanding to Europe & APAC | Short term (≤2 years) |
| Rapid Commercialization of Biosimilars and Specialty Biologics | +1.7% | Global, led by North America & Europe | Medium term (2-4 years) |
| Artificial Intelligence Adoption in Referral and Revenue Cycle Management | +1.2% | North America & Europe, early pilots in APAC | Medium term (2-4 years) |
| Private-Equity Consolidation Accelerating Network Expansion | +1.4% | North America dominant, emerging in Europe | Short term (≤2 years) |
| Source: Mordor Intelligence | |||
Government-Led Healthcare Decentralization Policies
Regulatory bodies are stripping away the reimbursement premium that hospital outpatient departments have long enjoyed. CMS expanded the Ambulatory Surgical Center fee schedule in 2025 to include complex biologic infusions, which introduced a 40% to 50% cost gap favoring freestanding centers. Eighteen U.S. states liberalized Certificate-of-Need laws during 2024-2025, opening previously restricted metropolitan areas. Germany followed suit with the Hospital Structure Act, which mandates parity payments for 12 high-cost biologics administered outside hospitals[1]Federal Ministry of Health, “Hospital Structure Act,” bundesgesundheitsministerium.de. Operators that pre-emptively secure locations near large specialist practices can establish referral density and lock in multi-year above-market returns once physician behavior hardens around lower-cost venues.
Rising Global Burden of Chronic and Autoimmune Diseases
Autoimmune prevalence climbed 3%-5% annually through 2025, now affecting roughly 8% of the global population[2]World Health Organization, “Global Autoimmune Disease Burden 2025,” who.int. Crohn’s disease and ulcerative colitis incidence rose 15% across Asia-Pacific between 2020 and 2025, boosting demand for infliximab and vedolizumab maintenance infusions. U.S. newborn screening doubled the number of patients with primary immunodeficiency who were diagnosed and needed lifelong immunoglobulin replacement. Oncology infusions remain volume leaders, but six novel monoclonal antibodies approved for multiple sclerosis and myasthenia gravis during 2024-2025 heightened neurology demand. Hospitals, already capacity-constrained, now triage acute care, leaving chronic-disease protocols to the ambulatory infusion centers market.
Payer Incentives for Cost-Efficient Outpatient Care
In 2025, UnitedHealthcare expanded its Specialty Pharmacy Oncology program to 47 infused therapies, applying a 30% coinsurance penalty for hospital use unless medically required. Anthem rolled out similar edits across 14 states, projecting annual savings of USD 180 million. Medicare Advantage enrollment reached 52% of beneficiaries, and pay centers receive 15%-25% more than fee-for-service Medicare while still realizing a 35%-45% discount versus hospital rates. Direct contracts bind regional networks to multi-year volumes, pushing centers to adopt actuarial discipline and population-health analytics.
Rapid Commercialization of Biosimilars and Specialty Biologics
The FDA cleared 14 new biosimilars for bevacizumab, rituximab, and trastuzumab in 2025, lifting biosimilar share of infliximab from 18% to 34% in one year. Acquisition-cost relief lets payers loosen prior-authorization criteria, broadening the treated patient pool. Simultaneously, 23 monoclonal antibodies entered Phase III trials during 2025 across oncology, neurology, and gastroenterology indications, each requiring temperature-controlled logistics that the ambulatory infusion centers market can orchestrate more reliably than hospital pharmacies. Centers winning preferred-biosimilar arrangements maintain gross margins above 40% despite top-line price deflation.
Restraints Impact Analysis*
| Restraint | (~) % Impact on CAGR Forecast | Geographic Relevance | Impact Timeline |
|---|---|---|---|
| Complex and Fragmented Reimbursement Landscape | -1.6% | North America dominant, moderate in Europe | Short term (≤2 years) |
| Shortage of Specialized Infusion Workforce | -1.3% | Global, acute in North America & Europe | Medium term (2-4 years) |
| Certificate-of-Need and Facility Licensing Barriers | -0.9% | U.S. regional (12 states), minimal elsewhere | Medium term (2-4 years) |
| Margin Compression from Upcoming Medicare Drug Price Negotiations | -1.1% | North America core, indirect spillover globally | Long term (≥4 years) |
| Source: Mordor Intelligence | |||
Complex and Fragmented Reimbursement Landscape
Administrative overhead reaches 18%-22% of revenue as centers juggle divergent authorization rules and claim formats. Part B payment for CPT 96365-96368 fell 3.2% in 2025 after CMS recalibrations, while commercial rates climbed 1.8%, widening payer-mix volatility. Prior-authorization success varied from 62% to 94% across the 10 largest commercial insurers, triggering erratic cash flow for small operators lacking actuarial modeling. National platforms absorb the turbulence; sub-scale players may exit or sell.
Shortage of Specialized Infusion Workforce
The U.S. faced a deficit of 78 000 infusion-certified nurses in 2025, forcing median wages to USD 42 per hour, 12% above prior-year levels. Turnover hit 22%, adding USD 18 000-24 000 per hire for onboarding. Staffing scarcity limits geographic rollouts, effectively capping supply and entrenching incumbents that run robust retention programs spanning tuition aid, flexible rosters, and internal career ladders.
*Our forecasts treat driver/restraint impacts as directional, not additive. The impact forecasts reflect baseline growth, mix effects, and variable interactions.
Segment Analysis
By Therapy Type: Biosimilar Waves Reshape Mix
Immunoglobulin therapy accounted for 29.88% of revenue in 2025, yet antibiotic and anti-infective infusions are poised to grow fastest at 12.76% annually. The ambulatory infusion centers market size for immunoglobulin is projected to expand steadily as plasma collection shortages ease by 2028. Meanwhile, iron therapy saw a 18% volume surge in 2025 after Medicare broadened coverage for anemia associated with chronic kidney disease.
Biosimilar uptake for rituximab and infliximab recalibrates economics, compressing price but expanding volume. Centers forging exclusive biosimilar deals with manufacturers can safeguard 38% gross margins and attract payer steerage. Although blood-product infusions remain hospital-centric, steroid infusions and clotting-factor replacement supply steady, albeit slower-growing, revenue streams within the ambulatory infusion centers market.


By Application: Neurology Disrupts Oncology Dominance
Oncology held 33.09% share in 2025, but neurology boasts a 13.21% CAGR, the highest among applications. The ambulatory infusion centers market share for neurology continues to rise as ocrelizumab and ublituximab protocols favor predictable outpatient settings. Gastro-intestinal infusions for IBD delivered 19% volume share in 2025 and remain sticky given lifelong maintenance intervals.
Nutrition support maintained an 11% slice of volume, yet growth moderates as stable patients transition to home infusion. Neurology’s ascent underscores payer recognition that regular ambulatory infusions cut emergency-department use by nearly one-third, a cost outcome hospitals cannot match.
By Site of Care: Freestanding Centers Gain Share
Hospitals still manage 38.59% of infusions, primarily complex oncology or transfusion-dependent cases, but their share is eroding. Freestanding centers show a 12.54% CAGR through 2031 as payers exploit the 30%-40% cost advantage. The ambulatory infusion centers market size for freestanding sites is projected to overtake hospital outpatient volume by 2029 if current trends hold.
Clinics affiliated with physician groups capture referral spillover, especially where integrated EHRs allow closed-loop ordering and documentation. Joint Commission accreditation signals quality and commands 8%-12% reimbursement premiums, giving accredited centers a competitive moat against office-based infusion suites.
By Ownership Model: Independents Capture Growth
Hospital-owned centers accounted for 40.21% of capacity in 2025 but grew more slowly than the market due to capital constraints. Independent specialty providers, often backed by private equity, are set to grow 13.22% annually and can deliver lean staffing ratios that keep EBITDA near 40%. The ambulatory infusion centers industry benefits as these independents introduce hub-and-spoke models servicing rural catchment areas otherwise sidelined by hospital networks.
Physician-owned sites hold 22% share, balancing autonomy with payer-contracting challenges. Many face a strategic fork: join national platforms for procurement leverage or double down on high-touch local service differentiation. IVX Health’s expansion exemplifies the scaling path, improving capacity use to 92% while maintaining specialty focus.
Geography Analysis
North America generated 43.43% of global revenue in 2025, supported by Medicare Advantage penetration above 52% and universal adoption of site-of-care editing by large commercial payers. The ambulatory infusion centers market size in Texas, California, Florida, and New York collectively represented 38% of U.S. capacity thanks to favorable Certificate-of-Need climates and dense specialty-physician clusters. Canada’s bundled-payment pilots spurred a 7.8% expansion in 2025 as provincial ministries outsourced overflow to accredited centers, while Mexico’s social-security institute added 12 million biosimilar-eligible lives, lifting national growth to 9.2%. Rural North American counties remain underserved, inviting hub-and-spoke entrants that can deliver within 30-minute drive times.
Asia-Pacific is forecast to grow 11.54% through 2031, the fastest regional pace. China licensed 340 freestanding centers in 2025 after Diagnosis Related Group reforms penalized long hospital stays[3]. India empaneled 1 200 centers under Ayushman Bharat, unlocking access for 500 million beneficiaries. Japan broadened reimbursement for 18 additional biologic infusions, shrinking hospital outpatient visits 14% year over year. Australia’s Pharmaceutical Benefits Scheme slashed out-of-pocket costs for infliximab biosimilars, fueling 9.8% growth. South Korea’s value-based contracts incentivize centers that hit patient-reported outcome targets, supporting double-digit expansion.
Europe captured 22% of global revenue and is advancing at 9.8% through 2031. Germany’s Hospital Structure Act induced hospital spin-offs into ambulatory entities. The U.K. Homecare Medicines program shortened wait times from eight weeks to three, reinforcing patient preference for convenient venues. France boosted reimbursement 6.2% for ambulatory infusions to accelerate biosimilar substitution. Middle East & Africa and South America together held 14% revenue in 2025, with Dubai, Johannesburg, São Paulo, and Buenos Aires launching pilot networks to relieve public hospital congestion.

Competitive Landscape
The ambulatory infusion centers market remains moderately fragmented; the five largest operators control roughly 35% of U.S. capacity. Option Care Health operates 180 sites and processed 4.2 million infusions in 2025, leveraging AI to achieve 89% clean-claim rates and a 41-day receivables cycle. Coram CVS integrates 108 suites with CVS Specialty Pharmacy, enabling same-day scheduling and reducing patient wait from 12 to four days. Optum Infusion expanded to 78 centers in 2025, aligning with Optum Health physician groups to capture both professional and technical fees.
Strategic differentiation rests on metropolitan density, therapeutic focus, and digital engagement. IVX Health specializes in autoimmune and gastroenterology protocols, offering same-visit nurse practitioner consultations that raised patient satisfaction scores to 96%. BrightSpring’s merged platform combines ambulatory and home infusion, appealing to payers piloting bundled care. Emerging disruptors include home-infusion platforms such as Medically Home Group, which implemented hospital-at-home programs in 37 markets during 2025 under the Acute Hospital Care at Home waiver.
White-space persists in rural corridors, demanding creative hub-and-spoke or mobile units. Joint Commission accreditation increasingly functions as a pay-to-play credential; KabaFusion’s system-wide accreditation in 2025 unlocked preferred-network status with 14 commercial insurers. Scale, technology, and quality credentials now dictate contract wins more than geographic happenstance.
Ambulatory Infusion Centers Industry Leaders
Option Care Health Inc.
Coram CVS / CVS Health
UnitedHealth Group
B. Braun Melsungen AG
Fresenius Kabi
- *Disclaimer: Major Players sorted in no particular order

Recent Industry Developments
- December 2025: New England Life Care launched its second ambulatory infusion suite, located at 374 Loudon Road in Concord, New Hampshire. The new suite represents a significant step forward in expanding access to high-quality, patient-centered infusion care across northern New England.
- September 2025: CVS Health launched CVS Infusion Care locations within select CVS retail stores to expand local access to specialty infusion and injectable services.


Research Methodology Framework and Report Scope
Market Definitions and Key Coverage
Our study defines the ambulatory infusion centers (AIC) market as the total annual revenue generated by freestanding or hospital-affiliated outpatient suites where trained nursing staff administer parenteral drugs, biologics, blood products, or nutrition therapies that require monitoring longer than a typical physician-office visit yet do not need full inpatient resources. The value captures drug mark-ups, facility fees, and ancillary pump or disposables income booked at the site of care, converted to constant 2025 USD.
Scope exclusion: dialysis clinics, home-infusion delivered inside a patient's residence, and short-duration IV pushes in physician offices are outside this boundary.
Segmentation Overview
- By Therapy Type
- Antibiotic / Anti-Infective
- Blood-Product Infusion
- Iron Therapy
- Steroid Infusion
- Immunoglobulin Therapy
- Clotting-Factor Replacement
- Plasmapheresis
- Other Therapy Types
- By Application
- Oncology
- Neurology
- Gastro-Intestinal Disorders
- Nutrition Support
- Other Applications
- By Site Of Care
- Hospitals
- Clinics
- Freestanding Infusion Centers
- By Ownership Model
- Hospital-Owned Infusion Centers
- Physician-Owned Centers
- Independent Specialty Providers
- Geography
- North America
- United States
- Canada
- Mexico
- Europe
- Germany
- United Kingdom
- France
- Italy
- Spain
- Rest of Europe
- Asia-Pacific
- China
- Japan
- India
- Australia
- South Korea
- Rest of Asia-Pacific
- Middle East & Africa
- GCC
- South Africa
- Rest of Middle East & Africa
- South America
- Brazil
- Argentina
- Rest of South America
- North America
Detailed Research Methodology and Data Validation
Primary Research
Mordor analysts interviewed infusion nurses, billing managers, payor contracting staff, and equipment vendors across North America, Europe, and Asia Pacific. These conversations tested throughput assumptions, payer shift ratios, and biosimilar adoption rates, filling gaps that desk work could not fully resolve.
Desk Research
We began with publicly available healthcare utilization datasets such as CMS Medicare Part B Outpatient Claims, OECD Health Statistics, and WHO Global Health Observatory that reveal infusion episodes and spend trends. Industry-specific sources such as the National Infusion Center Association benchmark report, US Bureau of Labor Statistics wage files, and national drug pricing compendia supplied cost, wage, and therapy-mix inputs. Paid databases like D&B Hoovers and Dow Jones Factiva helped us profile leading operator revenue and expansion pipelines. These sources, supplemented by SEC filings and state certificate-of-need registries, provided the backbone for our baseline; many additional references supported fact checks, though they are not exhaustively listed here.
Market-Sizing & Forecasting
A top-down model starts with national outpatient infusion encounters and average reimbursement to derive 2025 revenue. Then, results are corroborated with selective bottom-up roll-ups of leading chain revenues and sampled average selling price multiplied by visit volumes. Key variables include chronic disease prevalence driving therapy demand, payer-mandated site-of-care migration percentages, biosimilar penetration, average nurse labor cost index, new-clinic openings, and typical drug mix per visit. Multivariate regression projects each driver through 2030, scenario testing high and low reimbursement paths; missing operator data are bridged using regional utilization ratios validated in interviews.
Data Validation & Update Cycle
Outputs pass multi-step peer review, anomaly screens against independent drug sales and employment data, and senior analyst sign-off. Reports refresh every twelve months, with mid-cycle updates triggered by major reimbursement or regulatory changes; before delivery, one of us reruns core checks to ensure clients receive a current view.
Why Mordor's Ambulatory Infusion Centers Baseline Earns Trust
Published estimates often differ because each publisher chooses its own facility mix, revenue recognition logic, and forecast cadence.
Key gap drivers include whether hospital outpatient departments are classed as AICs, how home-infusion spillover is treated, the aggressiveness of biosimilar uptake curves, and currency conversion timing. Mordor uses a clearly demarcated scope and refreshes annually, while others may rely on static surveys or narrower therapy sets.
Benchmark comparison
| Market Size | Anonymized source | Primary gap driver |
|---|---|---|
| USD 50.98 Bn (2025) | Mordor Intelligence | |
| USD 50.63 Bn (2025) | Global Consultancy A | Includes hospital outpatient departments and partial home-infusion revenue |
| USD 20.30 Bn (2024) | Trade Journal B | Counts only physician-owned sites and omits oncology infusion sessions |
| USD 19.00 Bn (2024) | Industry Association C | Uses self-reported revenue without de-duplication across multisite operators |
Taken together, the comparison shows that when scope boundaries widen or narrow, values swing sharply. By aligning facility definitions with payer billing codes and validating with operator-level checks, Mordor delivers a balanced baseline clients can trace and replicate with confidence.


Key Questions Answered in the Report
How fast is the ambulatory infusion centers market expected to grow through 2031?
It is forecast to expand at a 10.62% CAGR, rising from USD 56.39 billion in 2026 to USD 93.41 billion by 2031.
Which therapy type currently generates the most revenue in the sector?
Immunoglobulin therapy led with 29.88% market share in 2025, driven by chronic inflammatory and immunodeficiency indications.
Why are payers steering patients away from hospitals for infusions?
Site-neutral payment rules and prior-authorization algorithms favor freestanding centers that deliver 30%-40% cost savings without compromising outcomes.
What region is projected to post the fastest growth?
Asia-Pacific is expected to grow at an 11.54% CAGR through 2031, propelled by payment reforms in China and coverage expansions in India.
Which ownership model is scaling most rapidly?
Independent specialty providers are projected to advance at a 13.22% CAGR as private-equity backing fuels network expansion and technology upgrades.
How will Medicare drug-price negotiations affect infusion centers?
Price cuts of 38%-60% for selected Part B biologics starting 2027 will narrow buy-and-bill margins, pressuring centers to renegotiate supply contracts or move to capitated payment models.
Page last updated on:


