Aluminum Cans Market Size and Share
Market Overview
| Study Period | 2020 - 2031 |
|---|---|
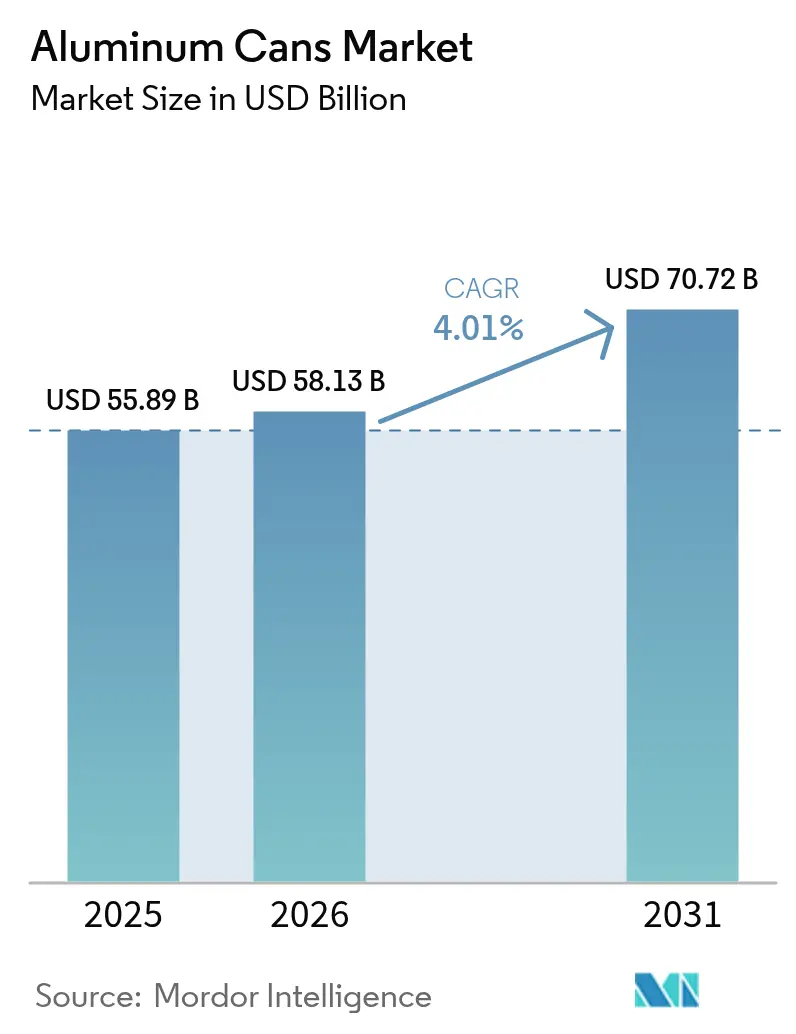
| Market Size (2026) | USD 58.13 Billion |
| Market Size (2031) | USD 70.72 Billion |
| Growth Rate (2026 - 2031) | 4.01% CAGR |
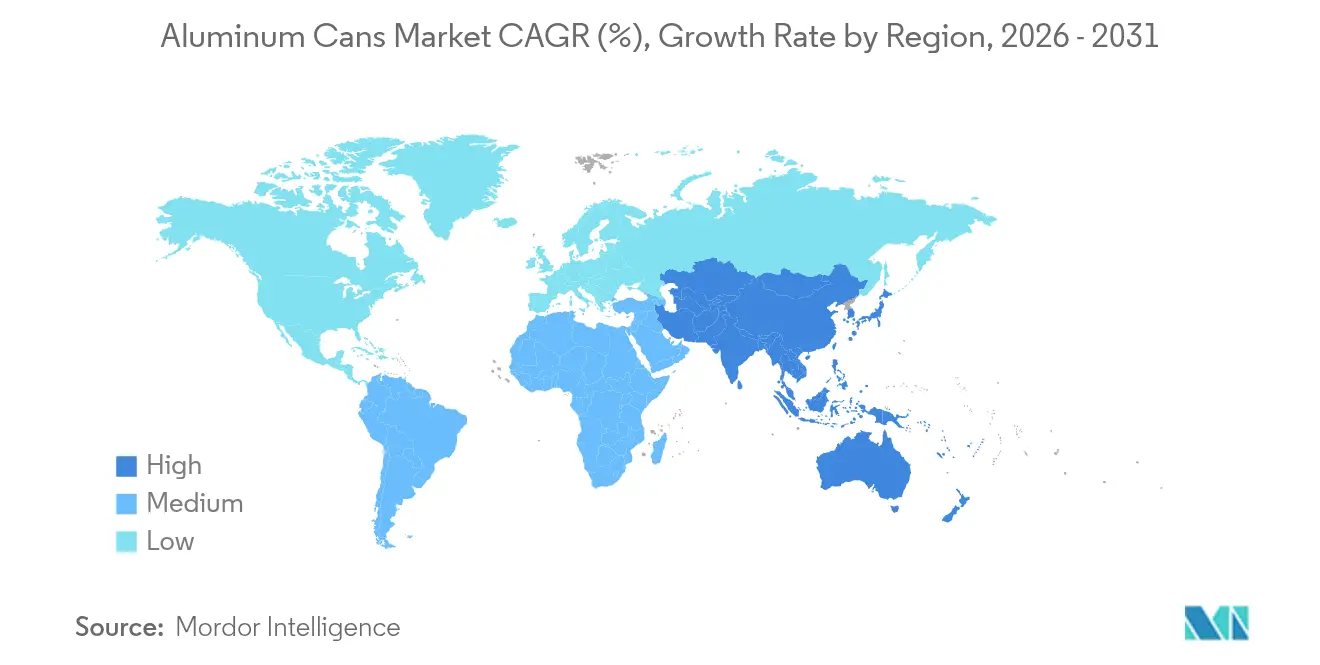
| Fastest Growing Market | Asia Pacific |
| Largest Market | Asia Pacific |
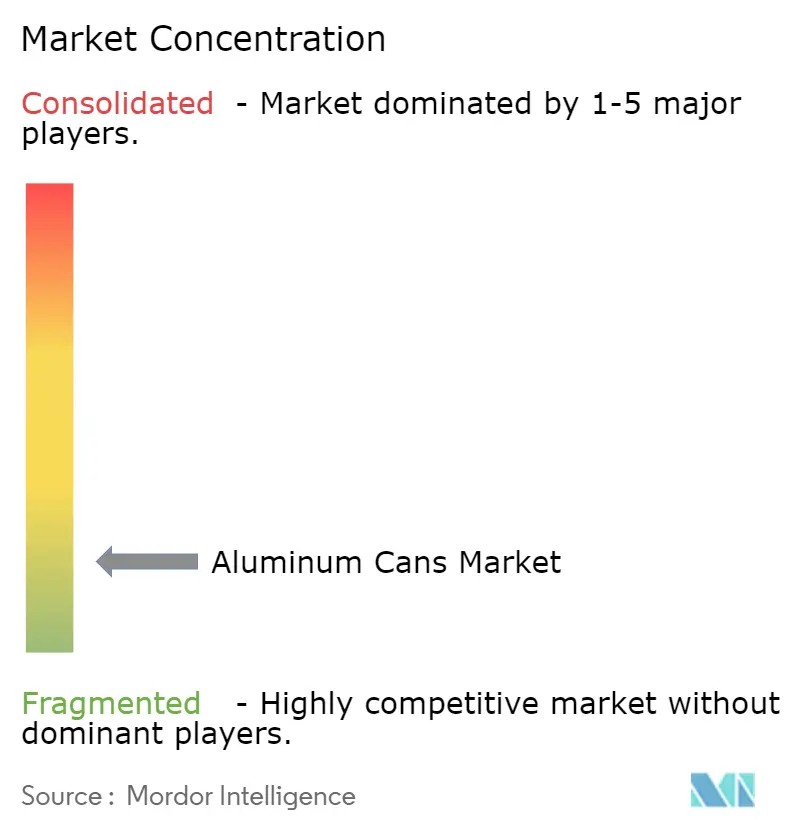
| Market Concentration | Low |
Major Players *Disclaimer: Major Players sorted in no particular order Image © Mordor Intelligence. Reuse requires attribution under CC BY 4.0. | |
Aluminum Cans Market Analysis by Mordor Intelligence
The global aluminum cans market size in 2026 is estimated at USD 58.13 billion, growing from 2025 value of USD 55.89 billion with 2031 projections showing USD 70.72 billion, growing at 4.01% CAGR over 2026-2031. Sustained policy pressure favoring circular packaging, rapid adoption by beverage producers shifting away from PET and glass, and capacity additions in high-growth regions collectively underpin this steady expansion. Deposit return systems that guarantee 90% collection by 2029 across the European Union sharply improve recycling economics, prompting brand owners and converters to accelerate investments in closed-loop can manufacturing. Asia Pacific retains its leadership position thanks to rising urban disposable incomes, while North America and Europe leverage premiumization and evolving sustainability mandates to support value growth. Capacity bottlenecks persist, yet recent acquisitions and greenfield builds point to a gradually improving supply balance. At the same time, premium beverage launches, wine-in-can initiatives, and e-commerce demand for dent-resistant formats create additional tailwinds that lift the aluminum cans market well beyond traditional carbonated soft drink applications.
Key Report Takeaways
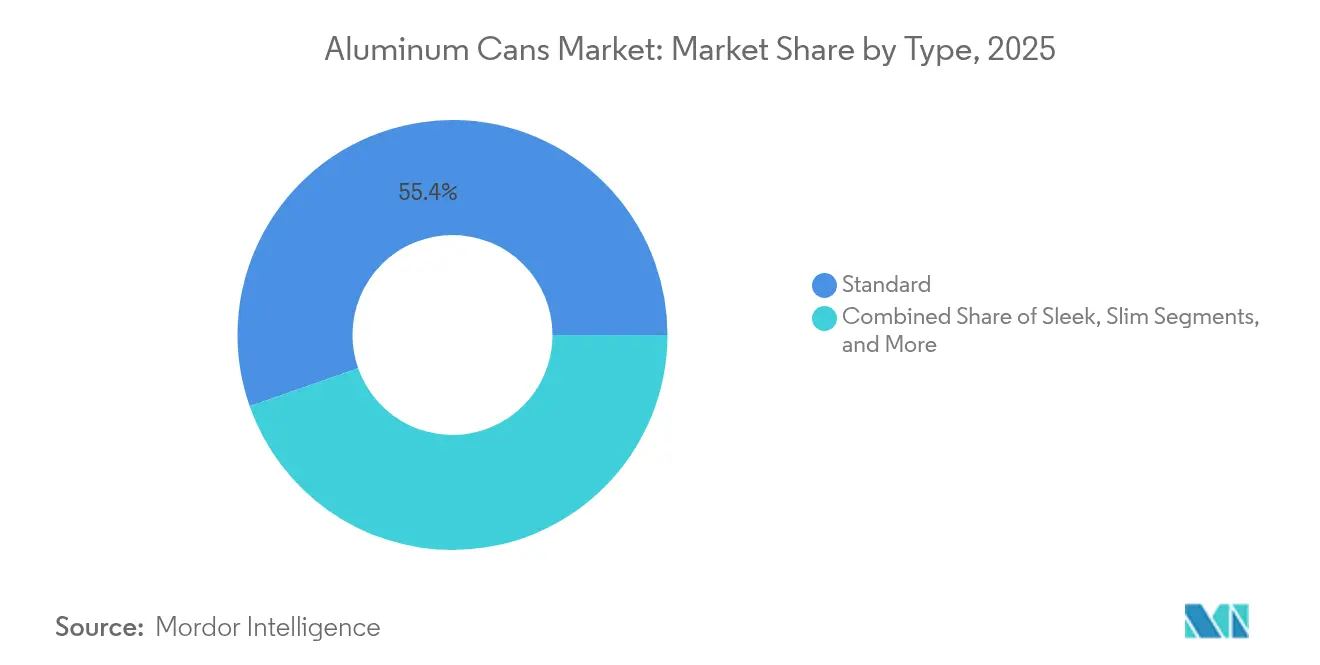
- By type, standard formats controlled 55.38% revenue in 2025, whereas sleek variants are set to advance at a 4.06% CAGR through 2031.
- By end-user industry, beverages captured 48.35% of the aluminum cans market share in 2025, while aerosol applications exhibit the highest projected CAGR of 5.21% over the same period.
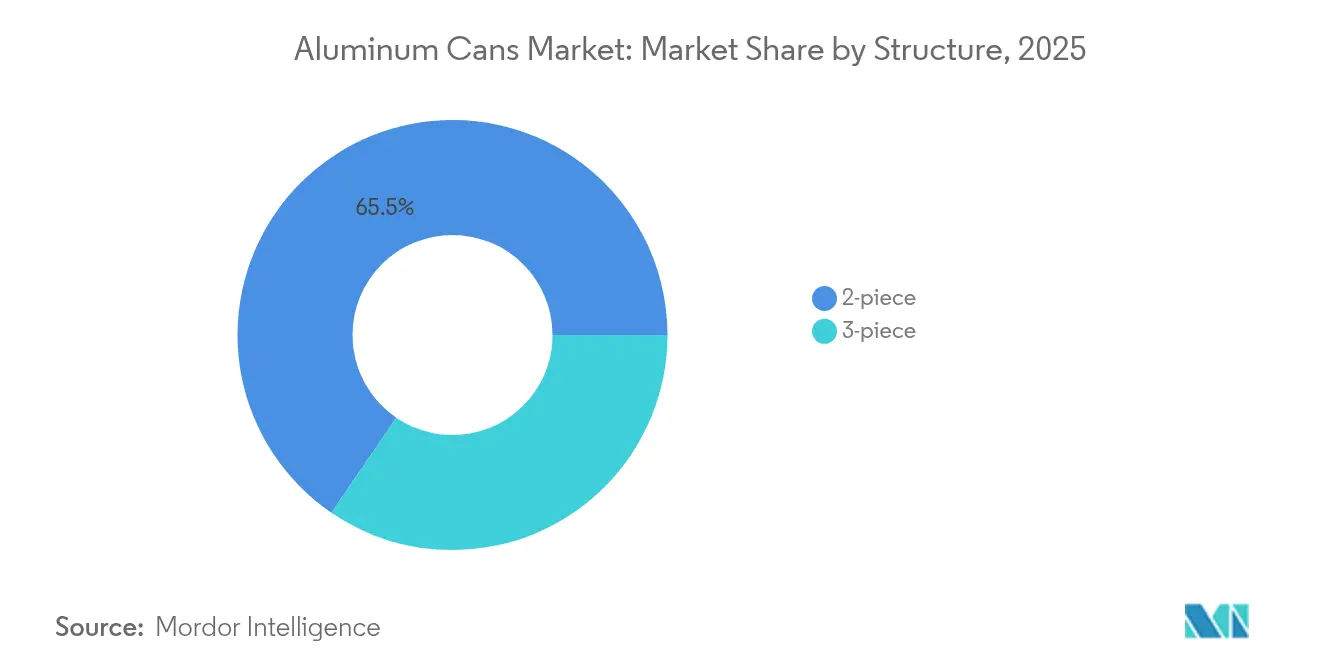
- By structure, 2-piece technology held 65.48% share of the aluminum cans market size in 2025 and should grow 4.48% annually to 2031.
- By capacity, the 251-500 mL range accounted for 52.57% of 2025 revenues, yet up-to-250 mL formats are forecast to outpace at 4.16% CAGR through 2031.
- By geography, Asia Pacific led with 40.74% market share in 2025, and its aluminum cans market size is primed to rise 5.52% annually between 2026 and 2031.
Note: Market size and forecast figures in this report are generated using Mordor Intelligence’s proprietary estimation framework, updated with the latest available data and insights as of 2026.
Global Aluminum Cans Market Trends and Insights
Drivers Impact Analysis*
| Driver | (~) % Impact on CAGR Forecast | Geographic Relevance | Impact Timeline |
|---|---|---|---|
| High recyclability and closed-loop recovery systems | +1.20% | Global, early leadership in the EU & North America | Long term (≥ 4 years) |
| Shift from PET/glass to aluminum amid EPR and plastics-tax mandates | +1.50% | Europe & North America, spreading to APAC | Medium term (2-4 years) |
| Boom in RTD, craft, and functional beverages | +0.90% | North America & Europe, spill-over to APAC | Short term (≤ 2 years) |
| Rapid growth of can-friendly wine and spirits packaging | +0.30% | North America, Europe, Australia | Medium term (2-4 years) |
| E-commerce’s need for dent-resistant primary packaging | +0.20% | Global urban centers | Medium term (2-4 years) |
| Source: Mordor Intelligence | |||
High Recyclability and Closed-Loop Recovery Systems
Aluminum retains its metallurgical properties indefinitely, enabling genuine material circularity that plastic and glass cannot match. The Can Manufacturers Institute notes that 75% of all aluminum ever produced remains in active use today, and remelting secondary aluminum consumes 95% less energy than primary smelting.[1]Can Manufacturers Institute, “Aluminum Beverage Can Remains Most Recycled Drinks Package,” canc entral.com European smelters Constellium, Elval, Novelis, and Speira harmonized alloy specifications in April 2024 to allow beverage cans with up to 100% recycled content, cutting carbon emissions by 2.6 tons of CO₂ per ton of metal and lowering operating costs for fillers committed to science-based climate targets. U.S. recycling rates slipped to 43% in 2023, but industry-backed investments aim to lift recovery to 70% by 2030 and 90% by 2050, ensuring long-term feedstock security for can plants. Deposit return programs covering more than 40 billion containers annually in Europe, Canada, and select U.S. states materially raise collection volumes, translating into lower scrap premiums and stronger margins for integrated can makers. These structural advantages collectively add 1.2 percentage points to forecast CAGR, cementing aluminum’s reputation as the definitive circular beverage package.
Shift from PET/Glass to Aluminum Amid EPR and Plastics-Tax Mandates
Extended Producer Responsibility schemes fundamentally reshape material cost hierarchies. The United Kingdom’s 2025 base EPR fee is set at GBP 266 per tonne for aluminum, far below levies applied to PET, multilayer pouches, or difficult-to-recycle flexibles. California expanded its Container Redemption Value program to wine and spirits in January 2024, immediately widening the addressable beverage can universe by 400 million units a year. Meanwhile, EU rules compel 90% collection of single-use beverage containers by 2029, a benchmark that heavily favors aluminum due to its high post-consumer scrap value. Australia will require 80% recycled content in food-grade aluminum by 2040, again reinforcing demand visibility along the entire Pacific Rim. These converging policies collectively boost aluminum’s attractiveness and inject an additional 1.5 percentage point lift into medium-term growth forecasts.
Boom in RTD, Craft, and Functional Beverages
Canned juice revenues jumped 8.5% to USD 1.43 billion in 2024, even as broader beverage volumes stagnated. Crown Holdings reports that 75% of new drink launches now choose cans for North American rollouts, citing oxygen-barrier performance and full-body branding real estate as decisive factors. Energy drinks, spiked seltzers, and adaptogen-infused functional beverages deeply value aluminum’s light weight and quick-chill properties, allowing cold-chain efficiency that glass cannot deliver. Mexico’s beer market reached 80% can penetration in 2024, while Brazil is tracking for 64% by 2026, validating can momentum across Latin America. The swift rise in performance beverages enriches product mix and lifts filling line utilization, adding roughly 0.9% to global CAGR during the first half of the forecast period.
Rapid Growth of Can-Friendly Wine and Spirits Packaging
California wineries introduced 90-gram aluminum bottles that slash transport-phase carbon versus 500-gram glass, winning shelf listings at major grocery chains seeking sustainable premium SKUs. The U.S. Alcohol and Tobacco Tax and Trade Bureau removed fill-size barriers in January 2025, formally legalizing a wide variety of can volumes for wine and distilled spirits. Portion-control trends align neatly with 187-mL and 250-mL formats, expanding aluminum’s presence in single-serve hospitality channels. Technical hurdles, such as aluminum ion migration in high-strength spirits, are being mitigated by FDA-approved epoxy-free internal liners, enabling safe multi-year shelf life. Although the current driver impact is modest, accelerating brand adoption adds 0.3% to CAGR potential in medium-term horizons.
Restraints Impact Analysis*
| Restraint | ( ~) % Impact on CAGR Forecast | Geographic Relevance | Impact Timeline |
|---|---|---|---|
| Competition from flexible PET and carton formats | -0.80% | Global, most severe in cost-sensitive markets | Short term (≤ 2 years) |
| Price and supply volatility of primary aluminum | -0.60% | Global, import-dependent regions hit hardest | Medium term (2-4 years) |
| Regional can-making capacity bottlenecks | -0.40% | North America, Europe, and selective APAC zones | Medium term (2-4 years) |
| Rising Scope-3 decarbonization compliance costs | -0.30% | Europe & North America, expanding globally | Long term (≥ 4 years) |
| Source: Mordor Intelligence | |||
Competition from Flexible PET and Carton Formats
Multilayer cartons and lightweight PET bottles continue to dominate price-sensitive segments, especially for private-label juices, dairy drinks, and shelf-stable water, where brand owners prioritize unit cost over recyclability. New glycol-modification techniques have extended PET shelf life for carbonation and sensitive nutrient blends, narrowing aluminum’s functional advantage. In developing economies, consumer willingness to pay sustainability premiums remains low, restraining penetration in commoditized categories. However, upcoming bans on non-recyclable plastic formats across the EU and Canada, alongside hard-to-reach EPR thresholds, will gradually erode the competitive edge of flexibles. Net effect is a temporary 0.8% drag on the aluminum cans market CAGR from 2025-2027.
Price and Supply Volatility of Primary Aluminum
London Metal Exchange prices oscillated between USD 2,100-2,300 per tonne throughout 2024 amid geopolitical tensions and energy cost spikes.[2]Aluminium Journal, “LME Price Volatility Commentary 2024,” aluminiumjournal.com Boston Consulting Group projects a 16-million-ton deficit by 2030 without USD 60-90 billion in new smelting capacity, raising cost-of-capital hurdles for downstream converters. Small and mid-tier can makers lack financial instruments to hedge price swings, slowing greenfield projects in Africa and Southeast Asia. On the flip side, secondary aluminum now represents over 70% of beverage-can body sheet in mature regions, cushioning volatility. Overall, metal cost uncertainty still subtracts 0.6% from mid-term growth forecasts until additional recycling capacity or energy-efficient smelters come online.
*Our forecasts treat driver/restraint impacts as directional, not additive. The impact forecasts reflect baseline growth, mix effects, and variable interactions.
Segment Analysis
By Type: Standard Formats Dominate, Sleek Designs Accelerate
Standard 330-mL and 355-mL bodies retained 55.38% of 2025 revenue, a share underpinned by filling-line compatibility, the highest line speeds, and optimal pallet density. The segment also capitalizes on broad end-user familiarity, which reduces changeover costs for global bottlers. Nevertheless, sleek cans, typified by 250-mL and 310-mL footprints, are advancing swiftly at a 4.06% CAGR thanks to their premium visual ratio and enhanced billboard effect in crowded retail aisles. Beverage formulators serving functional, low-calorie, and alcohol-ready-to-drink segments prize the elongated profile for differentiated shelf blocking and cold-box visibility. Ball’s Dynamark variable-graphics platform lets marketers design limited-run art across both standard and sleek formats without line-stopovers, trimming inventory risk and fostering campaign agility. As printing technology lowers per-unit cost, sleek cans should secure incremental penetration in higher-margin SKUs. Specialty shapes and tactile embossing remain nascent but reflect ongoing innovation that further enriches consumer experience. Altogether, the aluminum cans market expects continued coexistence of standard mass-volume formats and sleek premium variants, with the latter responsible for outsized revenue gains relative to capacity installed.
Standard bodies still benefit from superior logistics economics: a 24-count case of 355-mL cans weighs 20% less than an equivalent glass pack, cutting freight emissions and reducing shelf-stack injuries for retailers. Their thicker gauge, tooled since the 1990s, affords converters a stable margin capture even at high metal premiums. Yet brand owners are willing to absorb a slight cost uplift for sleek cans targeting lifestyle positioning where visual disruption and perceived health cues trump per-ounce value. By 2030, sleek units are likely to reach double-digit market share, adding breadth to packaging portfolios while maintaining backward compatibility with legacy line equipment. As such, type diversification reinforces the broader aluminum cans market’s resilience and keeps switching costs low for bottlers contemplating entry into niche beverage sub-categories.


By End-User Industry: Beverages Predominate, Aerosols Surge
Beverages claimed 48.35% of global revenues in 2025, mirroring a century-long symbiosis between carbonated drinks and lightweight metal containers. Carbonated soft drinks, energy shots, and sports hydration products remain workhorse volumes that secure economies of scale for can-sheet rolling mills. Sustained double-digit launches of spiked seltzers, CBD-infused tonics, and nitro-coffee further widen beverage category breadth, allowing can lines to run at near-full utilization even during off-season contractions for mainstream sodas. Meanwhile, aerosol fillings from deodorants to cooking sprays are forecast to post a 5.21% CAGR, marking them the fastest mover within the aluminum cans market. Brand owners appreciate aluminum’s corrosion resistance for formulations containing oils, propellants, or alcohols that degrade tinplate alternatives. Enhanced wall ironing processes enable pressure ratings up to 18 bar, paving the way for mousse, paint, and whipped-cream formats as well.
Pet food and human canned foods hold a smaller slice but deliver stable year-round demand anchored in inventory rotation and emergency-stock purchasing behaviors. Silgan Holdings witnessed double-digit pet food can revenue growth in 2024, illustrating premium pet nutrition’s alignment with metal’s oxygen-barrier features. Pharmaceutical and nutraceutical applications occupy an emerging frontier, leveraging tamper-evidence and precise metering features of small-volume aluminum vials. Collectively, end-user diversification further insulates the aluminum cans market against single-category downturns while providing multiple growth vectors that absorb manufacturing overhead and accelerate asset payback.
By Structure: 2-Piece Technology Commands Efficiency
The aluminum cans market size for 2-piece bodies represented 65.48% of global revenues in 2025 and will expand at 4.48% through 2031 as draw-and-wall-iron lines run above 2,000 cans per minute with minimal scrap rates. Removing a longitudinal seam eliminates an entire weld and inspection step, slashing energy consumption and lowering inclusion defects. Continuous lightweighting cuts can body thickness by 35% relative to 2000-era gauges, producing significant metal savings without sacrificing top-load strength. Crown’s 2024 deployment of high-speed two-piece lines in Brazil illustrates a large-scale commitment to the platform [CROWNCORK.COM]. While 3-piece constructions remain useful for oversize formats or intricate shapes, they experience sub-3% growth as beverage brands increasingly standardize on 2-piece bodies for CAPEX optimization.
Emerging draw-redraw (DRD) and impact-extrusion processes open additional avenues for shaped aerosol, wine, and spirits bottles where brand identity commands premium shelf prices. Ball’s acquisition of Spain-based Alucan adds DRD expertise that dovetails with aspirational personal-care and household categories. Over the forecast period, structural innovations look set to consolidate around 2-piece tactility complemented by niche extruded offerings, a mix that preserves efficiency while satisfying brand-driven differentiation demands. Consequently, production planners maintain high asset turnover, while suppliers of compounds, rings, and ends anchor MRO ecosystems that support sustained equipment uptime.
By Capacity: Mid-Size Leads, Small-Format Grows Fastest
Cans ranging from 251-500 mL accounted for 52.57% of global revenue in 2025, cementing their role as the universal single-serve drink size across most cultures. Their geometry perfectly balances refreshment volume, brand artwork surface area, and pack out density on standard pallets. Even so, sub-250 mL formats, including 150 mL mini-sodas and 187 mL wine spritzers, are witnessing the steepest climb at 4.16% CAGR through 2031. Health-conscious consumers perceive smaller servings as portion-controlled and calorie-responsible, enabling premium price points on a per-ounce basis. Craft cocktail brands exploit mini-cans for mix-and-match variety packs that encourage trade-up and exploration.
Conversely, cans above 500 mL serve large family or value-seeking segments, yet they wrestle with cooler-door real estate and incremental taxation in markets assessing volumetric alcohol duties. Still, 568 mL “tall-boys” remain culturally entrenched in several European beer segments, offering opportunistic volume growth aligned with sporting events and festival seasons. On the manufacturing front, one format does not cannibalize another; modern body makers can swap tooling within a shift, allowing plants to flex output in line with regional merchandising programs. Hence, diversified capacity enables the aluminum cans market to accommodate both premium micro-serves and mainstream thirst-quenchers.
Geography Analysis
Asia Pacific contributes 40.74% of global sales, and its aluminum cans market size is projected to advance 5.52% annually to 2031, underwritten by rising middle-class disposable incomes, urban convenience culture, and authoritative restrictions on single-use plastics in China, India, and Japan. China retains pole position with in-house rolling capacity and a vibrant domestic beverage sector that collectively eclipses import dependence. Hindalco’s USD 10 billion expansion amplifies India’s domestic metal supply in anticipation of can adoption by local cola, energy drink, and alcopop producers. Japan’s mature beverage environment spurs innovation in premium tea and craft coffee cans, aided by Asahi Group’s net-zero pledges driving procurement switch-overs. Southeast Asia is equally dynamic; NS-Siam United Steel allocated USD 58.5 million to bolster tinplate output, yet concurrently partners with foreign can-sheet suppliers, signaling blended development paths for both ferrous and aluminum supply chains.
North America ranks second in absolute size, though its unit volumes plateau. Instead, the region focuses on trading up to sleek, slim, and specialty thermochromic cans that fetch higher margins. Ball shipped roughly 49 billion containers in 2023, representing 36% regional aluminum cans market share and delivering significant recycled content progress as reclamation systems scale. U.S. state-level container deposit expansions plus Canada’s EPR rollouts strengthen secondary scrap supply, raising recycled content in can body sheet to record highs and lowering metal purchase costs for converters.
Europe, while mature, leans heavily on regulatory levers to accelerate modal shift from PET to aluminum. With the EU’s 90% collection target looming, brand owners pre-pay for compliance by booking multi-year aluminum can supply contracts that stabilize converter order books. The United Kingdom’s upcoming deposit return program will funnel 14 billion metal containers into closed-loop paths yearly, solidifying feedstock security. Germany and France aggressively promote wine-in-can pilots, expanding beyond beer’s established foothold. These factors allow European producers to deploy new capacity while raising line speeds and integrating on-site renewable energy, ensuring that the aluminum cans market in the bloc grows in value even where volumes edge upward modestly.

Competitive Landscape
The aluminum cans market shows high concentration; Ball Corporation, Crown Holdings, and Ardagh Metal Packaging together hold about 60% of global revenues, enabling economies of scale in can-sheet sourcing, end-manufacturing, and logistics. Ball commands roughly 36% of North America, shipping 49 billion units in 2023 via 13 regional plants that offer just-in-time deliveries to the continent’s largest fillers. Crown Holdings leverages geographic diversification, deriving more than 40% of segment income from Latin America after recent plant expansions in Brazil. Ardagh maintains long-term sheet supply agreements, most recently extending a North American pact with Novelis in January 2024, signaling buyer strength in upstream metal procurement.
Consolidation continues: Sonoco acquired Eviosys for USD 3.9 billion in December 2024, instantly combining Europe’s second-largest food-can network with Sonoco’s North American base, unlocking USD 100 million synergy potential. Ball purchased Florida Can Manufacturing and Spain-based Alucan to fortify regional supply networks and obtain extruded aerosol technology, respectively. Smaller regional players seek competitive footholds through specialty printing, quick-changeover capability, or local-government incentives that offset higher scrap premiums. Technology races center on bisphenol-free internal coatings, hydrogen-ready annealing furnaces, and AI-enabled vision inspection that together drive down defect rates and bolster sustainability credentials. With brand owners tightening Scope-3 accounting, suppliers that demonstrate high recycled content and low carbon footprints enjoy preferred-vendor status.
Overall, the aluminum can industry balances economies of scale with targeted innovation, ensuring that even as top players consolidate, niches remain open for agile entrants focusing on design, sustainability, or regional service niches. Anti-trust regulators in major jurisdictions maintain watchful eyes on M&A trends, but to date, plant divestitures and contract manufacturing partnerships have kept market contestability intact.
Aluminum Cans Industry Leaders
Ball Corporation
Crown Holdings, Inc.
Silgan Holdings Inc.
Ardagh Group S.A.
CAN-PACK S.A.
- *Disclaimer: Major Players sorted in no particular order

Recent Industry Developments
- May 2025: Crown added a high-speed line in Ponta Grossa, Brazil, to satisfy Latin American beverage growth.
- January 2025: Ball Corporation acquired Florida Can Manufacturing, enhancing supply responsiveness within the southeastern United States.
- January 2025: The U.S. Alcohol and Tobacco Tax and Trade Bureau added aluminum can sizes to standards of fill for wine and distilled spirits, opening new category frontiers.
- November 2024: Ball Corporation completed the purchase of Alucan, expanding impact-extruded aerosol capacity in Spain and Belgium.
- October 2024: Arnest Packaging unveiled a USD 100 million greenfield aluminum can plant to tackle regional supply shortages.
- October 2024: Ball launched Dynamark Advanced Pro variable graphics across EMEA lines, amplifying personalization capabilities for beverage brands.


Global Aluminum Cans Market Report Scope
Aluminum cans are used due to their sustainability characteristics. They have higher recycling rates and more recycled content than competing package types. Aluminum cans are lightweight, stackable, and strong, allowing brands to package and transport more products using less material.
The aluminum cans market is segmented by type (slim, sleek, and standard), by end-user industry (beverage, food, and aerosol), and by geography (North America (the United States and Canada), Europe (the United Kingdom, Germany, France, Spain, and Rest of Europe), Asia-Pacific (China, India, Japan, South Korea, Thailand, and Rest of Asia Pacific), Latin America (Brazil, Mexico, and Rest of Latin America), and Middle East and Africa (United Arab Emirates, Saudi Arabia, South Africa, and Rest of Middle East and Africa). The market sizes and forecasts are provided in terms of value (USD) for all the above segments.
| Standard |
| Sleek |
| Slim |
| Other Types |
| Beverage | Alcoholic Beverages |
| Non-alcoholic Beverages | |
| Food | Canned Food |
| Pet Food (Wet and Treats) | |
| Aerosol | |
| Other End-user Industries |
| 2-piece |
| 3-piece |
| Up to 250 ml |
| 251 - 500 ml |
| More than 500 ml |
| North America | United States | |
| Canada | ||
| Mexico | ||
| South America | Brazil | |
| Argentina | ||
| Chile | ||
| Rest of South America | ||
| Europe | United Kingdom | |
| Germany | ||
| France | ||
| Italy | ||
| Spain | ||
| Russia | ||
| Rest of Europe | ||
| Asia Pacific | China | |
| India | ||
| Japan | ||
| South Korea | ||
| Australia | ||
| Malaysia | ||
| Rest of Asia Pacific | ||
| Middle East and Africa | Middle East | Saudi Arabia |
| United Arab Emirates | ||
| Turkey | ||
| Rest of Middle East | ||
| Africa | South Africa | |
| Nigeria | ||
| Rest of Africa | ||
| By Type | Standard | ||
| Sleek | |||
| Slim | |||
| Other Types | |||
| By End-user Industry | Beverage | Alcoholic Beverages | |
| Non-alcoholic Beverages | |||
| Food | Canned Food | ||
| Pet Food (Wet and Treats) | |||
| Aerosol | |||
| Other End-user Industries | |||
| By Structure | 2-piece | ||
| 3-piece | |||
| By Capacity | Up to 250 ml | ||
| 251 - 500 ml | |||
| More than 500 ml | |||
| By Geography | North America | United States | |
| Canada | |||
| Mexico | |||
| South America | Brazil | ||
| Argentina | |||
| Chile | |||
| Rest of South America | |||
| Europe | United Kingdom | ||
| Germany | |||
| France | |||
| Italy | |||
| Spain | |||
| Russia | |||
| Rest of Europe | |||
| Asia Pacific | China | ||
| India | |||
| Japan | |||
| South Korea | |||
| Australia | |||
| Malaysia | |||
| Rest of Asia Pacific | |||
| Middle East and Africa | Middle East | Saudi Arabia | |
| United Arab Emirates | |||
| Turkey | |||
| Rest of Middle East | |||
| Africa | South Africa | ||
| Nigeria | |||
| Rest of Africa | |||


Key Questions Answered in the Report
What is the projected value of the aluminum cans market by 2031?
It is forecast to reach USD 70.72 billion by 2031, growing at a 4.01% CAGR.
Which region leads demand growth for aluminum beverage cans?
Asia Pacific tops both current share and forecast growth, expanding at a 5.52% CAGR through 2031.
Why are sleek cans gaining popularity among beverage brands?
Sleek formats support premium positioning, deliver distinctive shelf presence, and are expected to grow 4.06% annually.
How do deposit return systems influence aluminum can demand?
Mandated 90% collection rates raise recycled content, lowering material costs and strengthening preference for aluminum containers.
What is the biggest restraint facing can makers today?
Volatility in primary aluminum prices, coupled with supply deficits forecast for 2030, poses the greatest cost pressure.
Which end-user segment is expected to expand fastest?
Aerosol applications lead with a 5.21% CAGR as personal care and household brands pursue recyclable metal packaging.
Page last updated on:


