Data Annotation Tools Market Size and Share
Market Overview
| Study Period | 2020 - 2031 |
|---|---|
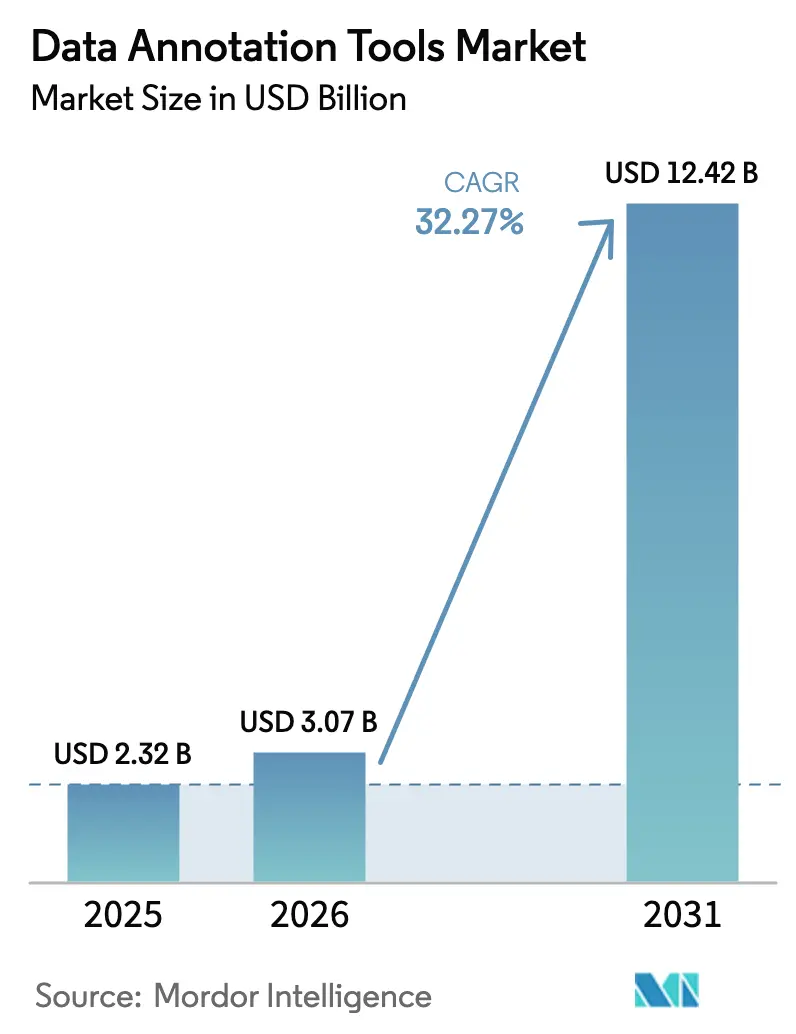
| Market Size (2026) | USD 3.07 Billion |
| Market Size (2031) | USD 12.42 Billion |
| Growth Rate (2026 - 2031) | 32.27% CAGR |
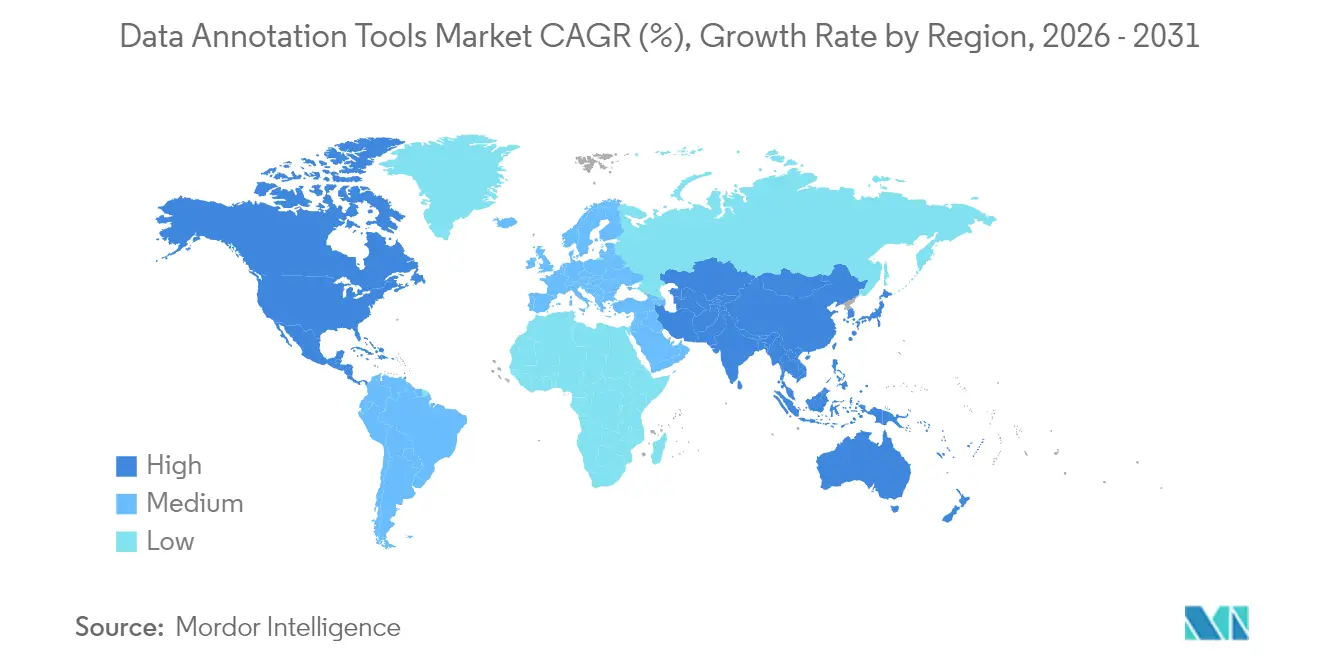
| Fastest Growing Market | Asia Pacific |
| Largest Market | North America |
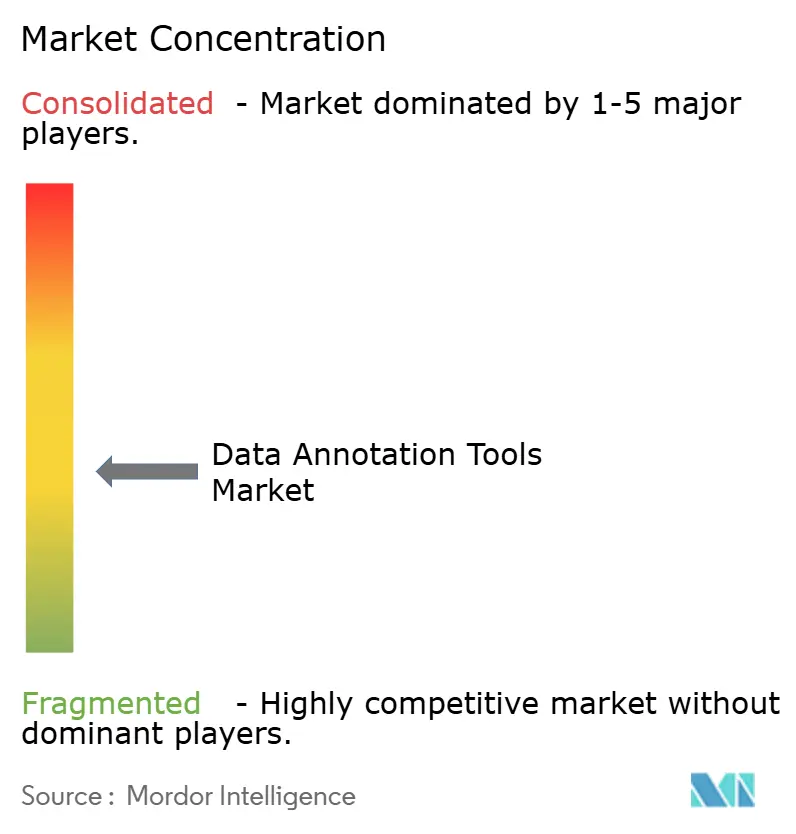
| Market Concentration | Medium |
Major Players *Disclaimer: Major Players sorted in no particular order Image © Mordor Intelligence. Reuse requires attribution under CC BY 4.0. | |
Data Annotation Tools Market Analysis by Mordor Intelligence
The data annotation tools market size is expected to grow from USD 2.32 billion in 2025 to USD 3.07 billion in 2026 and is forecast to reach USD 12.42 billion by 2031 at 32.27% CAGR over 2026-2031. This trajectory is powered by surging enterprise demand for high-quality training data across generative AI, autonomous systems, and multimodal foundation models. Managed platforms now compete on annotation accuracy rather than cost, turning data labeling into core infrastructure for AI deployment. Generative AI adoption is shifting requirements from single-modality images to complex combinations of text, video, and 3-D point clouds. Cloud-native workflows, multimodal data pipelines, and hybrid human-in-the-loop processes are widening the addressable user base, while regulatory pressure for transparent, auditable data handling is raising quality thresholds.
Key Report Takeaways
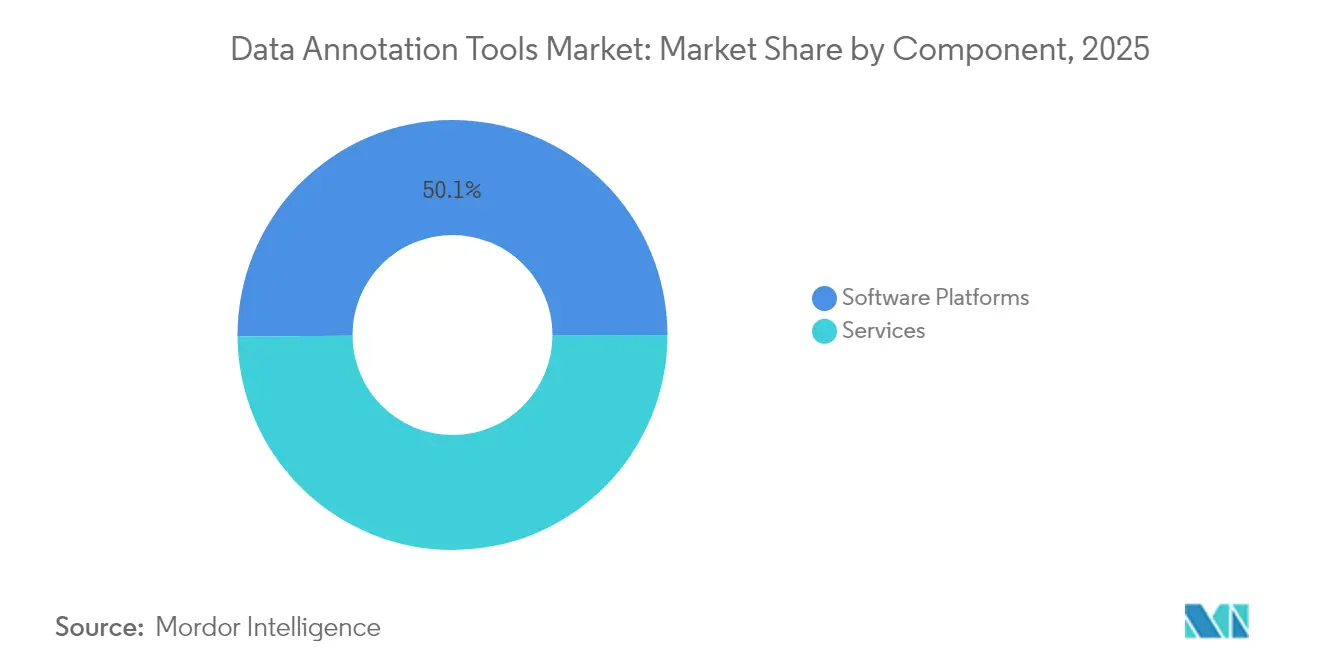
- By component, software platforms led with a 50.12% revenue share in 2025, while services are projected to post an 18.12% CAGR through 2031.
- By data type, image annotation held 35.74% of the data annotation tools market share in 2025; 3-D/point-cloud workflows are on track to grow at a 22.45% CAGR to 2031.
- By annotation method, manual workflows accounted for 53.40% share of the data annotation tools market size in 2025, whereas automatic techniques are advancing at a 23.97% CAGR to 2031.
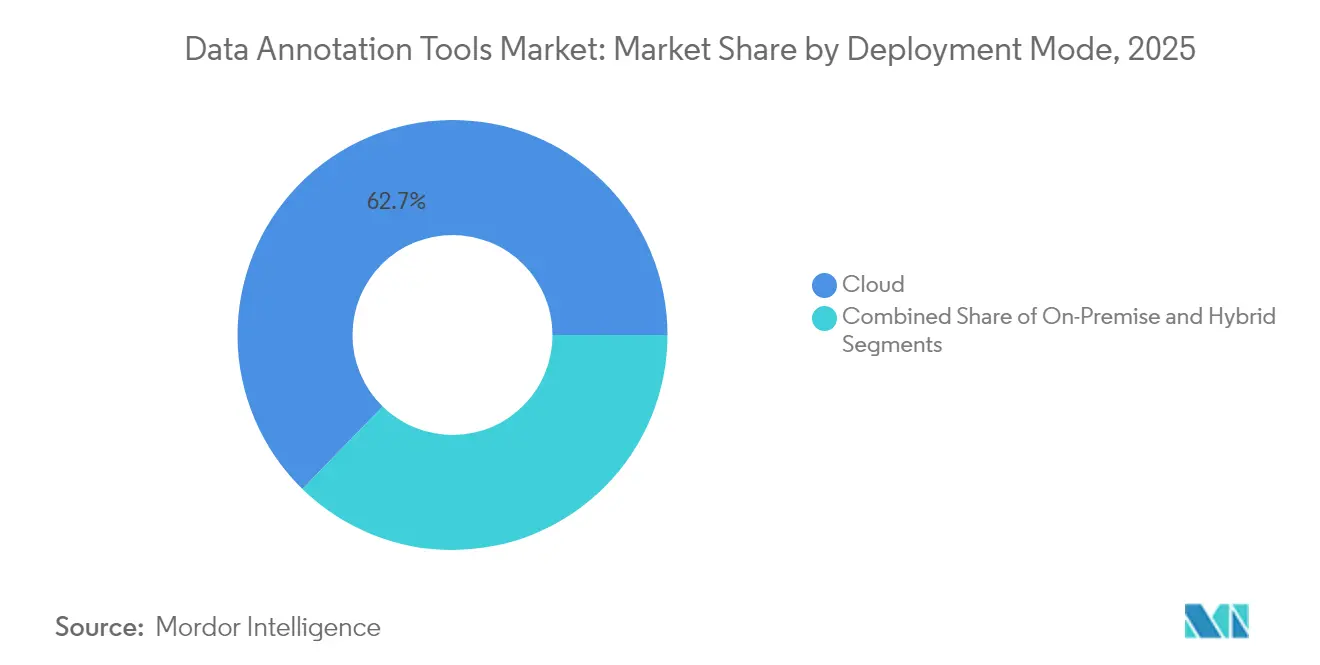
- By deployment mode, cloud solutions commanded 62.70% of 2025 revenue and are set to rise at a 21.88% CAGR through 2031.
- By end-user industry, IT and telecom controlled 29.10% share in 2025, while automotive and transportation is the fastest-growing vertical at a 20.95% CAGR.
- By geography, North America captured 41.10% of global revenue in 2025; Asia-Pacific is forecast to post an 17.86% CAGR to 2031.
Note: Market size and forecast figures in this report are generated using Mordor Intelligence’s proprietary estimation framework, updated with the latest available data and insights as of 2026.
Global Data Annotation Tools Market Trends and Insights
Drivers Impact Analysis*
| Driver | (~) % Impact on CAGR Forecast | Geographic Relevance | Impact Timeline |
|---|---|---|---|
| Growing adoption of AI/ML across industries | +8.5% | Global—North America and Asia-Pacific concentration | Medium term (2-4 years) |
| Surge in autonomous-vehicle development | +6.2% | North America & Europe core, expanding to Asia-Pacific | Long term (≥ 4 years) |
| Expanding medical-imaging AI demand | +4.8% | Global, led by North America & Europe | Medium term (2-4 years) |
| Synthetic-data workflows need hybrid tools | +3.7% | North America & Europe, emerging in Asia-Pacific | Short term (≤ 2 years) |
| Regulatory push for auditable annotation | +2.9% | Europe-led, spreading to North America & Asia-Pacific | Long term (≥ 4 years) |
| Cloud deployment scalability | +2.4% | Global | Short term (≤ 2 years) |
| Source: Mordor Intelligence | |||
Growing adoption of AI/ML across industries
Enterprise AI roll-outs now link annotation quality directly to revenue impact. Target reached 96% automation with 99% accuracy in product-content auditing, translating labeling precision into higher conversion on its e-commerce channels. Scale AI’s revenue climbed to USD 870 million in 2024 and is tracking USD 2 billion in 2025, illustrating how demand for massive multimodal data sets is reshaping the data annotation tools market. Financial-services players such as Inscribe cut fraud review time twenty-fold by training document-verification models on expertly labeled data. The pivot toward foundation models across sectors positions annotation platforms as strategic infrastructure rather than tactical vendors.
Surge in autonomous-vehicle development
Programs have advanced from R&D pilots to commercial deployment, requiring granular 3-D labeling and sensor-fusion data. Tesla’s Buffalo, Palo Alto, and Draper centers process thousands of clips daily to train Full Self-Driving software, illustrating the scale and sensitivity of the workload. Waymo’s open set contains 12 million LiDAR and 9.9 million camera annotations curated by trained labelers. Providers such as Scale AI supply automotive data engines that pair 2-D and 3-D labeling with continuous-learning loops, demonstrating that domain expertise trumps generic capabilities[2]Scale AI, “Developer Blog—2024 Financial Update,” scale.com.
Expanding medical-imaging AI demand
Healthcare AI places patient safety at the forefront. The FDA’s latest device guidance mandates continuous annotation to validate model updates, elevating the need for traceable labeling pipelines[1]FDA, “Marketing Submission of AI/ML-Enabled Medical Devices,” fda.gov. Centaur Labs raised USD 16 million to expand a network of 50,000 medical experts supplying HIPAA-compliant annotations. Platforms such as MD.ai integrate clinical ontologies and audit trails, ensuring annotations meet stringent validation rules.
Synthetic-data workflows need hybrid tools
Generative AI created a second wave of annotation requirements: prompt-response pairs, preference rankings, and bias audits. Voxel51’s auto-labeling reduces effort by pre-populating labels that humans refine, cutting costs by as much as 100,000×. Brighter AI enables privacy-preserving synthetic augmentation, letting smart-city projects train models without exposing personal identities. Hybrid pipelines blending synthetic and real data are emerging as the dominant architecture for enterprise AI training.
Restraints Impact Analysis*
| Restraint | (~) % Impact on CAGR Forecast | Geographic Relevance | Impact Timeline |
|---|---|---|---|
| Shortage of skilled annotators | -4.3% | Global—acute in North America & Europe | Short term (≤ 2 years) |
| High cost and time of manual labeling | -3.8% | Global, particularly affecting SMEs | Medium term (2-4 years) |
| Data-sovereignty limits on offshore labor | -2.1% | Europe and North America, emerging in Asia-Pacific | Long term (≥ 4 years) |
| Supply-chain disruptions constrain capacity | -1.9% | Global | Short term (≤ 2 years) |
| Source: Mordor Intelligence | |||
Shortage of skilled annotators
Complex use cases—from LiDAR point clouds to radiology series—require months of training, pushing wages up and elongating project timelines. Tesla’s multi-site annotator workforce underscores the scale needed for production environments. Crowdsourcing portals struggle to maintain quality, forcing enterprises to create in-house teams or pay premium rates to specialized vendors.
High cost and time of manual labeling
Semantic-segmentation tasks range between USD 0.10 and USD 1.00 per mask, putting million-image projects beyond the reach of many SMEs. An in-house team of 35 labelers processing 2.3 million objects incurs USD 122,220 in direct labor for 100,000 images, excluding overhead. Automation lowers expense but demands upfront integration skills that smaller organizations often lack
*Our forecasts treat driver/restraint impacts as directional, not additive. The impact forecasts reflect baseline growth, mix effects, and variable interactions.
Segment Analysis
By Component: Services accelerate despite platform dominance
Software platforms retained 50.12% share of the data annotation tools market in 2025, cementing their role as the first stop for enterprises scaling internal workflows. Yet services are forecast to climb at an 18.12% CAGR, signaling rising preference for managed solutions when projects demand regulatory compliance or specialized expertise. CloudFactory’s 7,000-person analyst network processing 50,000 daily labels for retail majors highlights the depth of capacity service firms now command.
The services boom reflects a strategic shift. Enterprises increasingly outsource entire labeling pipelines—including workforce management, quality assurance, and compliance—to partners such as Sama, which reports 99% client acceptance and ISO-aligned audit trails. These partnerships create a blended procurement pattern in which customers purchase both licenses and capacity, blurring historical platform-service lines across the data annotation tools market.


By Data Type: 3-D point cloud disrupts image dominance
Images still held a 35.74% slice of the data annotation tools market share in 2025, underpinned by retail, security, and healthcare vision projects. However, the 3-D/point-cloud segment is expanding at 22.45% CAGR, catalyzed by autonomous driving, spatial computing, and industrial simulation needs. Qualcomm, Apple, and Google continue to file patents for point-cloud compression and voxel-based mapping, confirming technological momentum.
Apple’s floor-plan generation patent shows how 3-D labeling unlocks real-time spatial understanding for augmented-reality navigation. The segment’s complexity favors providers with proprietary tooling, positioning advanced players to consolidate revenue as demand shifts from 2-D to volumetric contexts.
By Annotation Method: Hybrid workflows replace binary choices
Manual techniques controlled 53.40% of 2025 revenue, underscoring the need for human judgment in edge-case review and quality assurance. Automatic pipelines are ramping at a 23.97% CAGR, driven by improved model-based pre-labeling and semi-supervised learning that multiply throughput without proportionate labor costs. The data annotation tools market size for semi-supervised approaches is projected to compound swiftly as enterprises integrate active-learning loops that prioritize labeling only the most uncertain samples.
Voxel51’s auto-label technology exemplifies this hybrid approach: the model fills in predictable labels, and humans focus on edge cases, delivering step-change cost efficiency without sacrificing accuracy. As customers mature, demand is shifting from either-or decisions toward orchestrated workflows that intelligently assign tasks between machines and humans.
By Deployment Mode: Cloud dominance accelerates
Cloud environments accounted for 62.70% of 2025 revenue and are advancing at a 21.88% CAGR, a rate that adds significant upside to the overall data annotation tools market size between 2026 and 2031. Elastic compute, global collaboration, and pay-as-you-go economics outweigh latency concerns for most use cases. Hybrid models serve privacy-sensitive verticals, with patient data staying on-premise while annotation orchestration happens in the cloud, as evidenced by Centaur Labs’ medical pipelines.
Providers are investing in multicloud connectors, on-prem agents, and zero-trust controls to serve regulated workloads without forfeiting the productivity gains of cloud toolchains. This nuanced deployment mix positions platform vendors to capture recurring revenue even in sectors traditionally resistant to public-cloud adoption.
By End-User Industry: Automotive acceleration challenges IT leadership
IT and telecom retained 29.10% share in 2025 thanks to early AI investments in chatbots, network optimization, and content moderation. The automotive and transportation segment, propelled by autonomous-driving programs, is forecast to grow 20.95% annually, challenging IT’s dominance in the data annotation tools market. Tesla’s multi-site video-annotation facilities and Miovision’s smart-city traffic initiatives underscore sector appetite for high-precision 3-D data.
Healthcare is emerging as another fast-moving vertical as FDA guidance mandates ongoing annotation for post-market monitoring. Retail and e-commerce maintain steady momentum, pivoting from isolated pilots toward full production recommender systems that feed on rich visual and textual labels.
Geography Analysis
North America posted 41.10% of worldwide revenue in 2025, anchored by deep venture capital pools, big-tech R&D, and a mature buyer base. Scale AI’s USD 870 million revenue underscores regional demand intensity and explains Meta’s USD 14.3 billion stake aimed at locking down critical data infrastructure. Skills shortages and wage inflation are nudging some projects offshore, yet data-sovereignty rules keep high-stakes workloads onshore, sustaining premium pricing.
Asia-Pacific is set to outpace all regions with an 17.86% CAGR to 2031. China’s National Development and Reform Commission has formalized a labeling-industry roadmap targeting 20% growth per year and standardized AI training professions, catalyzing both supply and demand in local language, multimodal, and 3-D datasets. Regional cost advantages, vast talent pools, and accelerated AI adoption—Asia’s AI revenue could near USD 300 billion in 2030—make the region pivotal for capacity expansion.
Europe exhibits steady growth as GDPR and forthcoming AI-Act rules elevate requirements for auditable, bias-controlled datasets. Providers such as Brighter AI deliver GDPR-compliant video anonymization for rail operator Deutsche Bahn, revealing vertical niches within privacy-first environments. Middle East and Africa are emerging capacity nodes; the UAE’s data-center investments in Kenya point to a new South-South corridor for annotation services. South America remains a smaller yet growing cluster, buoyed by multilingual NLP demand and rising fintech investment.

Competitive Landscape
More than 100 active vendors keep the data annotation tools market fragmented, yet consolidation pressure is evident. Meta’s USD 14.3 billion move for a 49% Scale AI stake highlights the pivot from arms-length sourcing to vertical integration. Traditional boundaries between platform producers such as Labelbox and managed service experts like Appen are fading; both groups now offer hybrid bundles blending SaaS tooling with curated workforces.
Technological differentiation hinges on automation and domain depth. Voxel51 aims to cut labeling costs by 100,000× by pairing auto-labeling with human verification, a claim that, if realized, could compress industry margins. Patent filings from Tesla, Disney, and Microsoft show escalating investment in proprietary annotation algorithms, annotation-quality scoring, and content-validation model pipelines. Strategic partnerships such as the TaskUs–V7 tie-up unite a labor pool of 670,000 annotators with next-gen workflows, signposting an ecosystem where scale and specialization converge.
White-space remains in regulated verticals such as healthcare, where HIPAA and FDA requirements create high switching costs, and in nascent data types like synthetic text-image pairs, where labeling logic is still crystallizing.
Data Annotation Tools Industry Leaders
Scale AI, Inc.
Appen Ltd
TELUS International AI Inc.
Labelbox Inc.
iMerit Technology Services
- *Disclaimer: Major Players sorted in no particular order

Recent Industry Developments
- June 2025: Meta finalized a USD 14.3 billion investment for a 49% stake in Scale AI, confirming a vertical-integration strategy for AI data infrastructure.
- May 2025: Bezos Expeditions invested USD 72 million in Toloka, granting operational independence while Nebius retained a minority interest.
- January 2025: China’s NDRC issued national guidelines targeting 20% compound growth for the labeling sector by 2027 and creating standardized AI-training roles.
- November 2024: SuperAnnotate raised USD 36 million in Series B to scale enterprise multimodal dataset tooling.


Research Methodology Framework and Report Scope
Market Definitions and Key Coverage
Our study defines the data annotation tools market as all commercial software platforms, cloud, on-premise, or hybrid, that enable users to tag, label, or mask raw text, image, video, audio, and 3-D point-cloud files so they can be consumed by machine-learning algorithms. According to Mordor Intelligence, the definition covers perpetual licenses, subscription fees, and usage-based pricing linked to labeling volume; it does not count the revenue earned by pure-play outsourcing labs, even when they use proprietary tooling.
Scope Exclusions: Stand-alone human-in-the-loop labeling services, offered without a purchasable platform interface, lie outside this market.
Segmentation Overview
- By Component
- Software Platforms
- Services
- By Data Type
- Text
- Image
- Video
- Audio
- 3D/Point Cloud
- By Annotation Method
- Manual
- Semi-Supervised
- Automatic
- By Deployment Mode
- Cloud
- On-Premise
- Hybrid
- By End-user Industry
- IT and Telecom
- BFSI
- Retail and E-commerce
- Healthcare and Life Sciences
- Automotive and Transportation
- Government and Public Sector
- Others
- By Geography
- North America
- United States
- Canada
- Mexico
- South America
- Brazil
- Argentina
- Rest of South America
- Europe
- United Kingdom
- Germany
- France
- Italy
- Spain
- Nordics
- Rest of Europe
- Middle East and Africa
- GCC
- Israel
- South Africa
- Rest of Middle East and Africa
- Asia-Pacific
- China
- India
- Japan
- South Korea
- ASEAN
- Australia
- New Zealand
- Rest of Asia-Pacific
- North America
Detailed Research Methodology and Data Validation
Primary Research
Mordor analysts interviewed platform product leads in North America, quality managers at labeling BPOs in Asia-Pacific, and data-science heads inside automotive, ecommerce, and med-tech firms. These discussions clarified average label throughput, tool selection criteria, and regional price dispersion, allowing us to reconcile secondary signals with on-ground realities.
Desk Research
We started with publicly available datasets that anchor the broader AI software stack, such as U.S. Bureau of Labor Statistics data on AI developer headcount, OECD AI compute indicators, WIPO patent filings on annotation automation, and export-import logs for high-performance GPUs. Company filings, investor decks, and technology association papers (for example, the Partnership on AI) supplement usage metrics across industries. To size vendor revenues, our analysts accessed paid sources like D&B Hoovers for company financials and Dow Jones Factiva for deal tracking. These sources reveal baseline spending patterns and emerging tool deployment footprints. The sources listed illustrate our approach; many other documents were reviewed to cross-check figures and fill gaps.
Market-Sizing & Forecasting
A top-down reconstruction links global AI software spending to the share allocated for training-data preparation, which is then segmented by data modality and deployment mode. Select bottom-up roll-ups, sample platform ASP × active paid seats, channel checks with cloud marketplaces, and limited supplier revenue disclosures are employed for triangulation. Key model inputs include (i) number of commercially deployed AI projects, (ii) median labels per project, (iii) average price per thousand labels, (iv) proportion of projects using cloud-based tools, (v) autonomous-vehicle sensor mileage, and (vi) venture funding for AI start-ups. We forecast with multivariate regression, adjusting coefficients yearly through expert consensus reviews.
Data Validation & Update Cycle
Outputs pass anomaly filters, peer review, and a management sign-off. We revisit estimates quarterly when material events, large vendor M&A, price resets, and regulatory shifts occur; otherwise, the full workbook refreshes annually before report release.
Why Mordor's Data Annotation Tools Baseline Commands Reliability
Published estimates often diverge because firms choose different tool scopes, pricing buckets, and refresh cadences. Our disciplined scoping and dual-path modeling make the baseline dependable for budget planning.
Key gap drivers include others omitting bundled services, adopting static average-selling-prices, or carrying forward older currency conversions, whereas Mordor's base year reflects live interviews and rolling exchange updates.
Benchmark comparison
| Market Size | Anonymized source | Primary gap driver |
|---|---|---|
| USD 2.32 Bn (2025) | Mordor Intelligence | - |
| USD 1.31 Bn (2024) | Global Consultancy A | Excludes services module and refreshes every two years, with revenue scrape only |
| USD 0.80 Bn (2022) | Trade Journal B | Narrow data-type scope, fixed ASP assumptions, no primary validation |
The comparison shows that while other publishers rely heavily on static vendor revenue pulls or conservative data-type slices, Mordor's analysts blend real usage metrics with recurring expert inputs, yielding a balanced, traceable baseline that decision-makers can reproduce and stress-test.


Key Questions Answered in the Report
What is the current size of the data annotation tools market?
The data annotation tools market stood at USD 3.07 billion in 2026 and is projected to reach USD 12.42 billion by 2031 on a 32.27% CAGR trajectory.
Which component segment is growing the fastest?
Managed services are expanding at an 18.12% CAGR, outpacing platform growth as enterprises turn to outsourced expertise for regulated or domain-specific projects.
Why is 3-D point-cloud annotation attracting attention?
Autonomous driving, robotics, and spatial computing all require detailed depth perception, pushing 3-D/point-cloud workflows to a 22.45% CAGR—the fastest within data types.
Which region will lead growth to 2031?
Asia-Pacific is set for the highest regional growth at an 17.86% CAGR, underpinned by China’s national labeling initiative and rapid AI adoption across Japan, South Korea, and India.
How are vendors differentiating in a fragmented market?
Leading platforms are investing in auto-labeling, vertical specialization, and compliance toolkits, while strategic acquisitions—such as Meta’s stake in Scale AI—signal a move toward vertical integration.
What key challenge could slow market expansion?
A shortage of trained annotators, particularly for domain-intensive tasks like medical imaging and 3-D sensor fusion, is already inflating project costs and extending delivery timelines.
Page last updated on:


