
Alpha Olefins Market Size and Share
Market Overview
| Study Period | 2021 - 2031 |
|---|---|
| Market Volume (2026) | 7.32 Million tons |
| Market Volume (2031) | 9.40 Million tons |
| Growth Rate (2026 - 2031) | 5.13 % |
| Fastest Growing Market | Asia Pacific |
| Largest Market | Asia Pacific |
| Market Concentration | Medium |
Major Players *Disclaimer: Major Players sorted in no particular order Image © Mordor Intelligence. Reuse requires attribution under CC BY 4.0. | |
Alpha Olefins Market Analysis by Mordor Intelligence
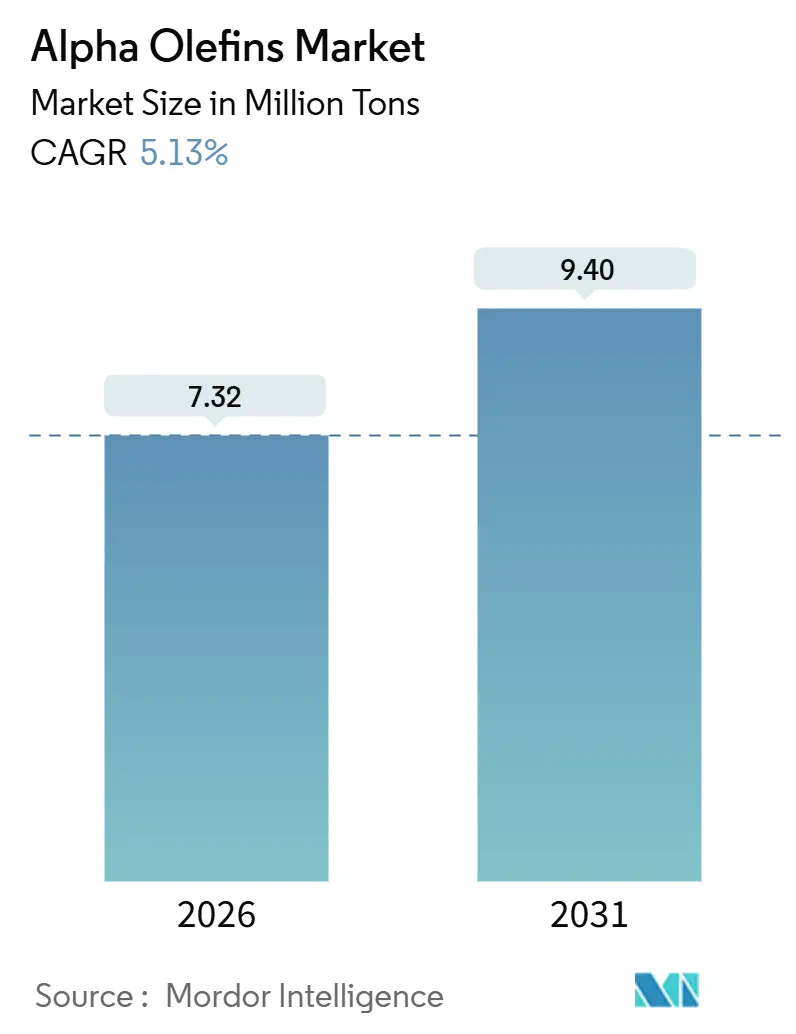
The Alpha Olefins Market size is estimated at 7.32 Million tons in 2026, and is expected to reach 9.40 Million tons by 2031, at a CAGR of 5.13% during the forecast period (2026-2031). Capacity additions in Asia-Pacific and the Middle-East, shale-ethane cost advantages in North America, and soaring demand for comonomers in linear low-density polyethylene (LLDPE) films underpin this growth trajectory. Rising poly-alpha-olefin (PAO) lubricant adoption, particularly for electric-vehicle (EV) thermal-management fluids, further elevates volumetric prospects, while integrated producers leverage backward integration into ethylene to secure supply and margin resilience. Feedstock economics remain the pivotal competitive lever; United States ethane output climbed to 2.8 million barrels per day in 2024, delivering a structural cost edge over naphtha-fed crackers in Europe and Northeast Asia. Simultaneously, China’s state-backed Sinopec-Aramco Fujian complex and Saudi Arabia-controlled projects in Fujian and Yanbu are adding more than 3.6 million tons of ethylene capacity between 2024 and 2026, redrawing supply chains toward the East.
Key Report Takeaways
- By type, C4 (1-butene) held 35.23% of alpha olefins market share in 2025, whereas C6 (1-hexene) recorded the fastest 5.88% CAGR through 2031.
- By production process, ethylene oligomerization contributed 80.12% of 2025 output and is forecast to grow at a 5.67% CAGR through 2031.
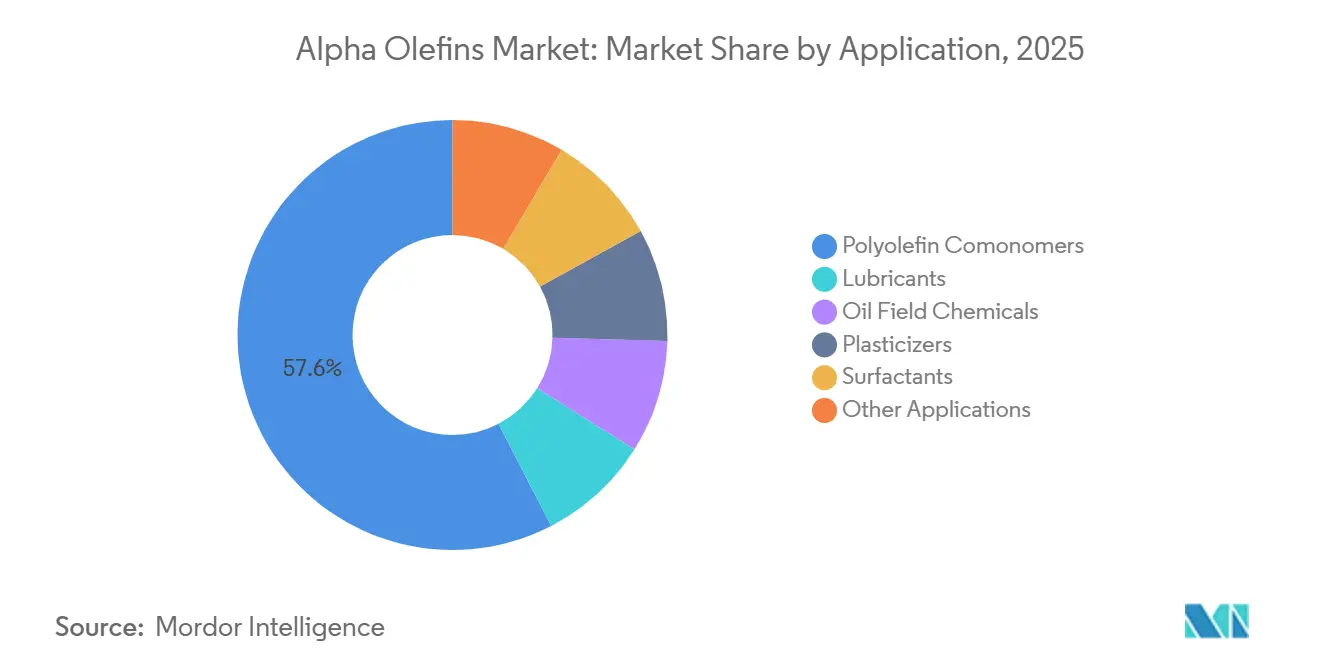
- By application, polyolefin comonomers commanded 57.58% of the alpha olefins market size in 2025 and will expand at a 6.26% CAGR to 2031.
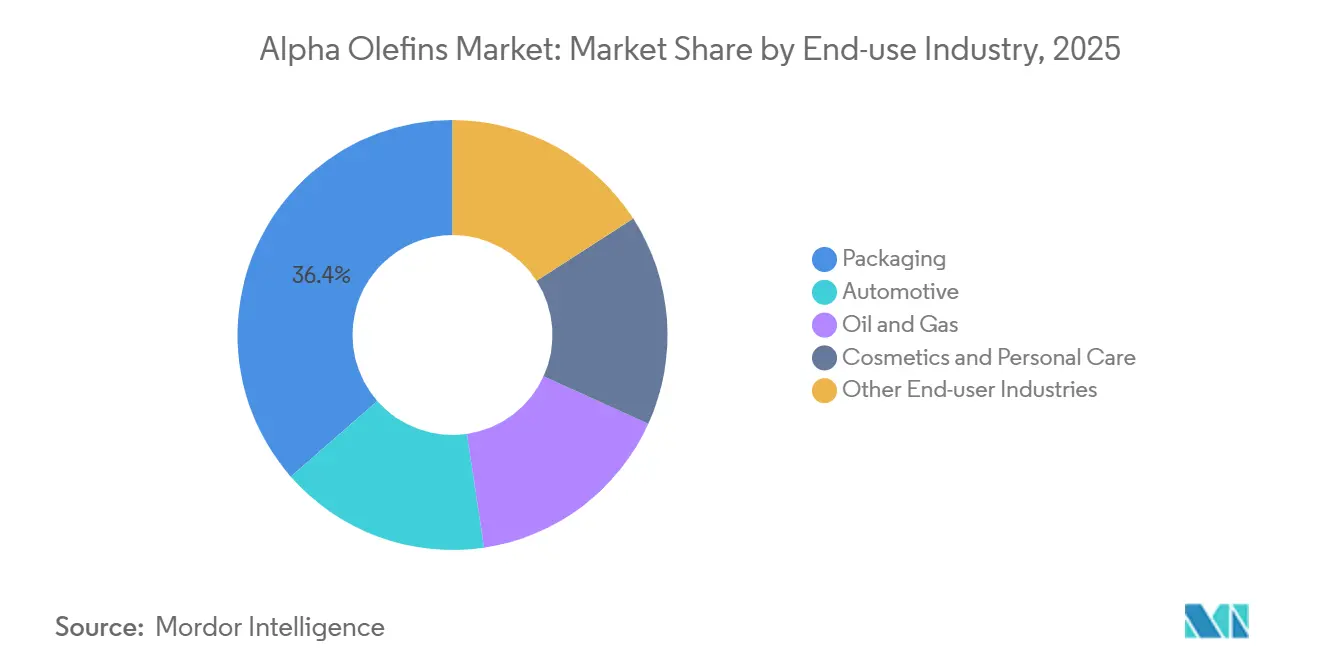
- By end-use industry, packaging led with 36.45% volume share in 2025 and is advancing at a 6.15% CAGR to 2031.
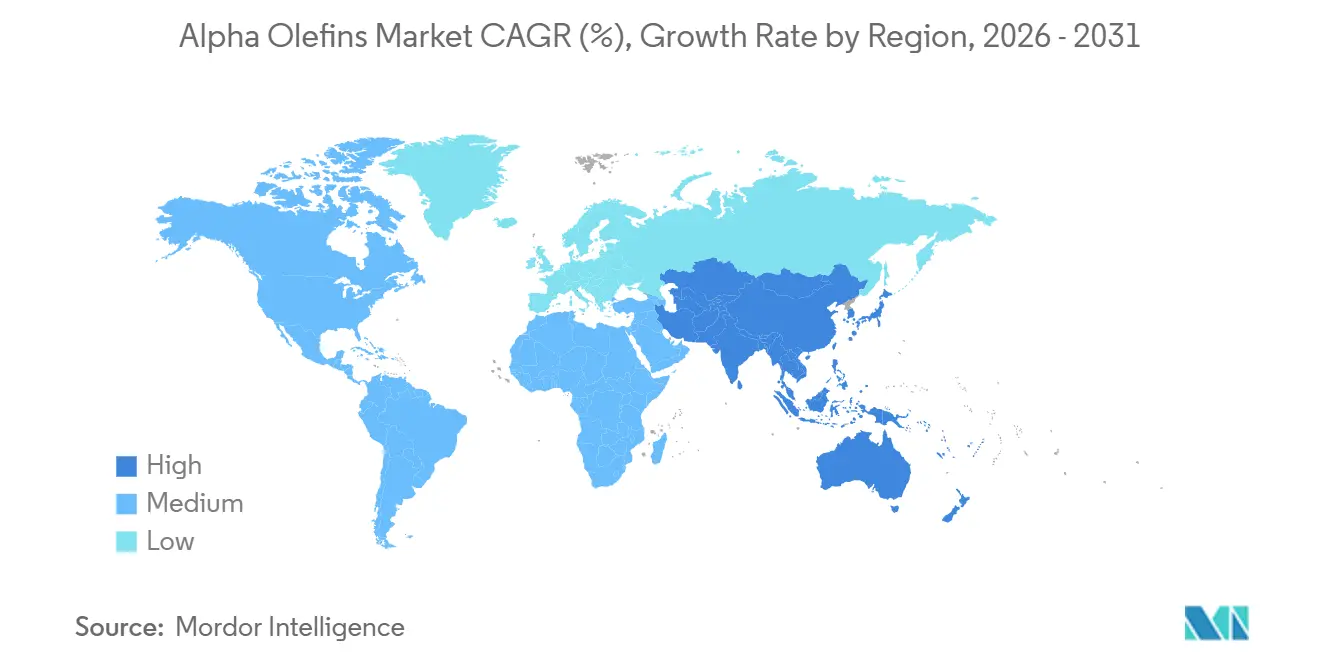
- By geography, Asia-Pacific captured 40.45% of 2025 demand; the region is anticipated to post a 6.89% CAGR to 2031.
Note: Market size and forecast figures in this report are generated using Mordor Intelligence’s proprietary estimation framework, updated with the latest available data and insights as of January 2026.
Global Alpha Olefins Market Trends and Insights
Drivers Impact Analysis*
| Driver | (~) % Impact on CAGR Forecast | Geographic Relevance | Impact Timeline |
|---|---|---|---|
| Surging Polyethylene Comonomer Demand | +2.1% | Global, with APAC and North America leading | Medium term (2-4 years) |
| Growth in Synthetic Lubricants | +1.3% | North America, Europe, APAC automotive hubs | Medium term (2-4 years) |
| Shale-Ethane Cost Advantage in North America | +0.9% | North America, spillover to Latin America | Short term (≤ 2 years) |
| Capacity Additions in Emerging Economies | +1.5% | APAC core (China, India), Middle-East | Long term (≥ 4 years) |
| EV Thermal Management Fluid Requirements | +0.6% | Europe, North America, China EV clusters | Long term (≥ 4 years) |
| Source: Mordor Intelligence | |||
Surging Polyethylene Comonomer Demand
Metallocene LLDPE grades require tighter molecular-weight control, elevating consumption of high-purity 1-hexene and 1-octene comonomers. Chevron Phillips Chemical expanded its Cedar Bayou cracker to 1.5 million tons-per-year ethylene capacity and co-located alpha-olefin trains to monetize the ethylene-to-C6/C8 spread. Shell’s Monaca complex follows a similar integration model, ensuring captive comonomer supply for 1.6 million tons of polyethylene demand. E-commerce logistics accelerate stretch-film uptake, and brand owners prefer downgauged yet puncture-resistant films that only metallocene LLDPE can deliver. This downstream pull renders comonomer demand inelastic to modest price spikes. As new Asian LLDPE reactors switch from Ziegler-Natta to metallocene catalysts, alpha olefins market volumes receive a structural uplift.
Growth in Synthetic Lubricants
Poly-alpha-olefin base stocks achieve viscosity indices above 130 and pour points below -50 °C, enabling next-generation engine oils that satisfy API SP and ILSAC GF-6 specifications. Chevron Phillips Chemical broke ground in November 2025 on a PAO expansion in Beringen, Belgium, to service European automakers pursuing longer drain intervals and hybrid powertrains. EVs further amplify PAO demand, as direct battery-cell cooling requires fluids stable above 150 °C with high dielectric strength. Industrial gearboxes and compressors similarly upgrade to PAO to extend service life and reduce downtime. Economies of scale are narrowing the PAO-to-mineral-oil cost delta, hastening substitution in mid-tier lubricant formulations.
Shale-Ethane Cost Advantage in North America
United States ethane production reached 2.8 million barrels per day in 2024, while exports averaged 620,000 barrels per day during Q1 2024. Ethane pricing below USD 0.20 per gallon kept U.S. ethylene cash costs under USD 300 per ton, versus USD 600-700 per ton for naphtha crackers in Europe. Fourteen prospective Gulf Coast crackers totaling 9.19 million tons of ethylene will be co-located with alpha-olefin units, locking in feedstock and bolstering regional alpha olefins market competitiveness[1]American Chemistry Council, “U.S. Ethylene Investment Tracker,” americanchemistry.com . This edge squeezes naphtha-dependent producers in Northeast Asia and Europe, prompting portfolio restructuring and asset rationalization.
Capacity Additions in Emerging Economies
China’s Sinopec-Aramco Fujian complex started up in November 2024, integrating a USD 10 billion refinery and 1.5 million tons-per-year ethylene cracker that includes on-purpose alpha olefin capacity. SABIC approved a 1.8 million tons-per-year cracker in Fujian for 2026 completion, while Yasref’s 1.8 million tons-per-year project in Yanbu advances toward FID in 2026. India’s petrochemical demand grew 7% in fiscal 2024-2025, outstripping domestic LAO capacity and spurring imports[2]Petroleum Planning and Analysis Cell, “Petrochemical Demand Forecast,” ppac.gov.in . State-backed financing and feedstock security in these regions reinforce long-term alpha olefins market growth corridors.
Restraints Impact Analysis*
| Restraint | (~) % Impact on CAGR Forecast | Geographic Relevance | Impact Timeline |
|---|---|---|---|
| Ethylene Feedstock Price Volatility | -1.2% | Global, acute in naphtha-dependent regions (Europe, Northeast Asia) | Short term (≤ 2 years) |
| Non-Biodegradability of Polyethylene | -0.5% | Europe, North America (regulatory pressure zones) | Medium term (2-4 years) |
| Catalyst Deactivation in Bio-Based LAO Synthesis | -0.3% | Europe, North America (bio-based development hubs) | Long term (≥ 4 years) |
| Source: Mordor Intelligence | |||
Ethylene Feedstock Price Volatility
Brent crude oscillated between USD 70 and USD 90 per barrel during 2024-2025, compressing naphtha cracker margins and disrupting oligomerization economics. Asian ethylene spot prices fluctuated USD 800-1,100 per ton, forcing comonomer suppliers to hedge through futures contracts that dilute profitability. European producers face an additional EUR 50-70 per ton carbon-cost headwind under the EU ETS. Consequently, standalone LAO units reliant on merchant ethylene are deferring capacity expansions, while integrated Gulf Coast complexes run at elevated rates.
Non-Biodegradability of Polyethylene
Alpha-olefin-rich LLDPE films are non-biodegradable, drawing scrutiny from the European Union’s Single-Use Plastics Directive and impending U.S. state bans on non-recyclable packaging. Regulatory headwinds threaten demand elasticity in mature markets. Producers are countering with chemical-recycling tie-ins and design-for-recyclability initiatives, yet legislative timelines tighten beyond 2028, capping upside for conventional resin volumes.
*Our forecasts treat driver/restraint impacts as directional, not additive. The impact forecasts reflect baseline growth, mix effects, and variable interactions.
Segment Analysis
By Type: C6 (1-Hexene) Drives Performance Upgrading, C4 (1-Butene) Maintains Dominance
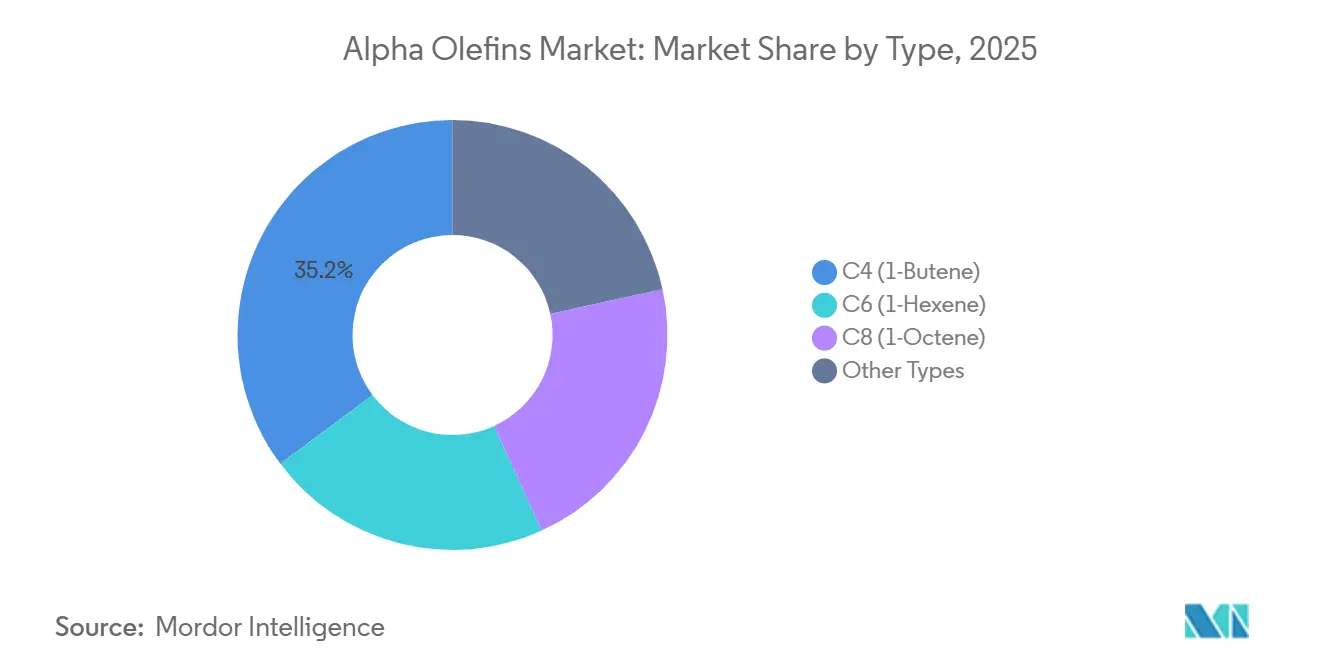
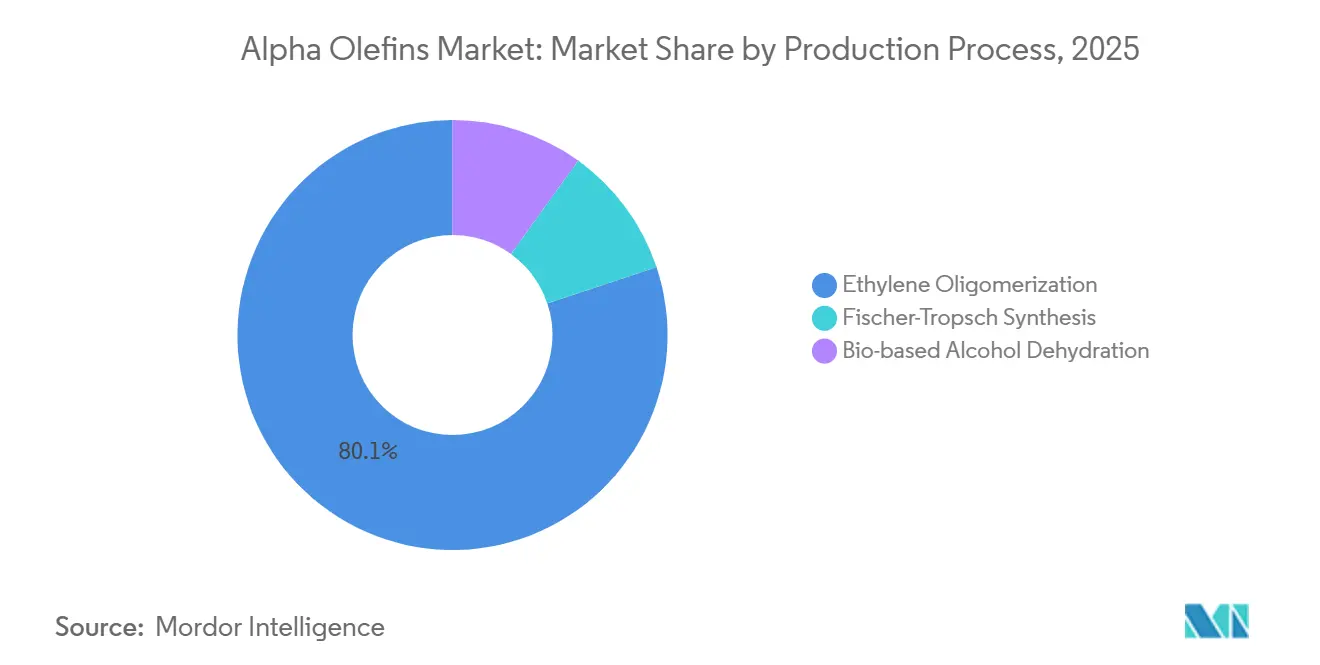
C4 (1-Butene) captured 35.23% of 2025 volume on cost advantage and legacy Ziegler-Natta LLDPE use. Conversely, C6 (1-Hexene) grew at a 5.88% CAGR, steering alpha olefins market size expansion toward higher-value streams. Dow’s AFFINITY plastomers leverage C8 (1-octene) for elastomeric films, commanding premiums of 15-20% over C4-based resins.
Metallocene catalysts require 1-hexene or 1-octene for narrow molecular-weight distributions, improving dart impact and stress-crack resistance. Higher carbon-number alpha olefins (C10-C20+) serve synthetic lubricants and plasticizer alcohols, sustaining margin diversity even as volume concentrates in C4-C8. Fischer-Tropsch-derived alpha olefins target multi-cut portfolios but remain below 10% of output due to capital intensity.



By Production Process: Oligomerization Dominates Owing to Catalyst Selectivity and Integration Economics
Ethylene oligomerization delivered 80.12% of 2025 production and is projected to expand at 5.67% CAGR, underpinned by catalyst selectivity surpassing 95% for 1-hexene. Chevron Phillips and INEOS capitalize on captive ethylene, achieving margin insulation against feedstock volatility. Fischer-Tropsch synthesis monetizes stranded gas in Qatar and coal in South Africa, yet remains subscale. Bio-alcohol dehydration pilot plants in Europe stay below 10,000 tons-per-year until catalyst lifetimes improve.
Integration economics favor oligomerization, as ethylene crackers can swing between LAO, polyethylene, and ethylene derivatives depending on spreads, preserving alpha olefins industry competitiveness across cycles.
By Application: Polyolefin Comonomers Anchor Demand
Polyolefin comonomers accounted for 57.58% of demand in 2025, rising at a 6.26% CAGR as flexible-packaging converters downgrade film thickness without compromising performance. Lubricants are benefiting from PAO’s high viscosity index and low-temperature fluidity. Oil-field chemicals, plasticizers, and surfactants collectively absorb the remaining share, capitalizing on alpha olefins’ hydrophobicity and chain-length flexibility.
Comonomer consumption closely tracks global polyethylene capacity, especially in Asia-Pacific and the Middle-East, anchoring long-term alpha olefins market growth. Lubricant and surfactant segments, while smaller, capture higher value per ton and diversify geographic exposure toward Europe and North America.
By End-use Industry: Packaging Innovation Drives Consumption
Packaging accounted for 36.45% of the projected 2025 volume and is expected to grow at a CAGR of 6.15% through 2031, driven by the increasing adoption of e-commerce platforms and the rising demand for convenience food products in the Asia-Pacific region. Automotive applications, including engine oils, EV thermal management fluids, and elastomeric interior films, are also experiencing significant growth due to advancements in vehicle technologies and the growing electric vehicle market.
The remaining demand is attributed to oil and gas drilling fluids, cosmetics, and construction materials, which provide niche but stable demand opportunities, supported by consistent industrial and consumer requirements.
Geography Analysis
Asia-Pacific controlled 40.45% of 2025 demand and is set to grow at a 6.89% CAGR, driven by China’s USD 10 billion Sinopec-Aramco Fujian complex and India’s 7% annual petrochemical consumption uptick. With local alpha olefin capacity trailing demand, regional imports from the Middle-East remain robust, yet upcoming Chinese and Saudi capacities reposition supply chains eastward. Japan and South Korea import high-purity C6/C8 for specialty LLDPE, whereas ASEAN polyolefin demand expands above 6% annually, absorbing incremental alpha olefins market volumes.
North America leverages shale-ethane pricing, enabling ethylene cash costs nearly 50% lower than European naphtha equivalents. Fourteen Gulf Coast crackers totaling 9.19 million tons of ethylene will support co-located LAO units, reinforcing the region’s role as a net exporter. Canadian and Mexican deficits ensure cross-border flows, consolidating the continent’s feedstock advantage into downstream competitiveness.
Europe faces structural headwinds: high naphtha costs, EU ETS carbon pricing, and plant closures such as SABIC’s Geleen Olefins 3 and Teesside crackers removing 500,000 tons of ethylene capacity. The Middle-East, conversely, accelerates ethane-fed expansions like Yasref’s planned 1.8 million tons-per-year cracker, bridging Asian demand. South America remains anchored by Braskem in Brazil, but macroeconomic volatility and limited upstream investment restrain growth potential.

Value Chain Analysis
The alpha olefins value chain starts with hydrocarbon feedstocks that are cracked to ethylene, then converted to linear alpha olefins primarily via ethylene oligomerization (the dominant route in the market). Integrated producers with captive ethylene, often located near major ethylene hubs such as the US Gulf Coast, typically run oligomerization units and use catalyst systems tuned for either broad even-carbon slates (C4, C6, C8, C10, C12 and heavier) or on-purpose cuts, notably 1-butene, 1-hexene, and 1-octene. After reaction, product treatment (catalyst deactivation and purification) and fractionation separate saleable cuts to meet comonomer and specialty specifications.
Demand pull largely comes from polyolefin comonomers (LLDPE/HDPE) and from PAO and specialty fluids, along with surfactants, plasticizer alcohols, and oilfield chemicals that consume higher-carbon fractions. Distribution is typically a mix of long-term offtake to polymer and lubricant value chains, spot sales for merchant volumes, and intra-company transfers for integrated polyethylene and lubricant portfolios. Logistics constraints tied to ethylene availability and the need for tight purity control in C6/C8 grades create structural advantages for producers that co-locate crackers, alpha olefins units, and downstream derivative assets.
Competitive Landscape
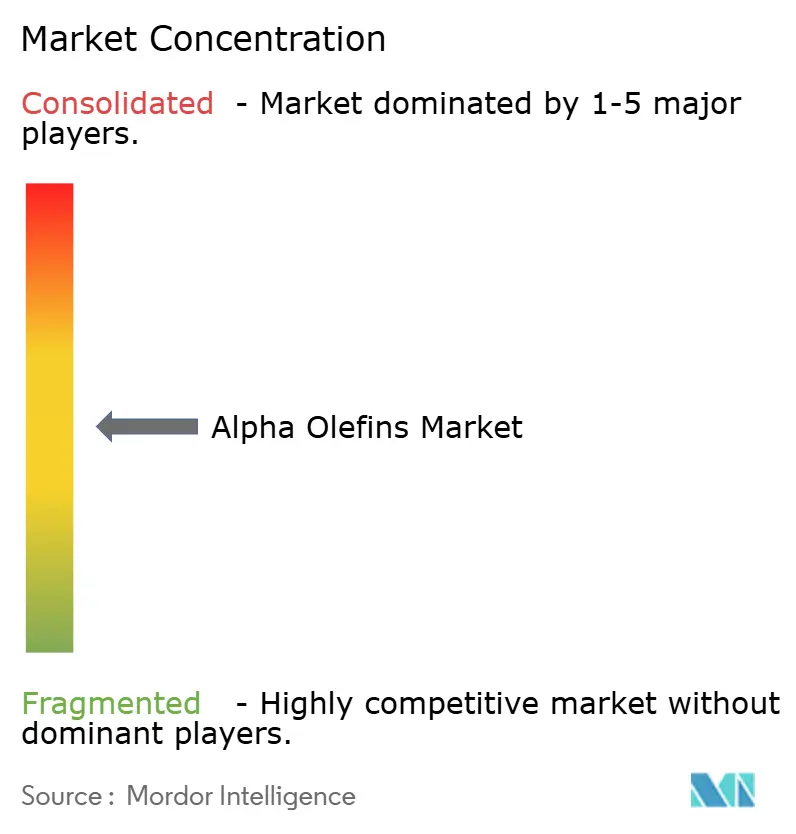
The top five producers-Chevron Phillips Chemical, Shell, INEOS, SABIC, and Sasol-command an estimated 55-60% of global capacity, defining a moderately concentrated alpha olefins market. Backward integration into ethylene frames competitiveness; Chevron Phillips’ proprietary chromium catalyst system yields more than 95% 1-hexene selectivity, while INEOS operates oligomerization units in the U.S. and Europe with captive feedstock. Shell and Sasol exploit Fischer-Tropsch co-products for specialty PAO and surfactant feedstocks.
Strategic moves underscore divergence. Chevron Phillips initiated its Belgian PAO expansion to address EV thermal-management growth. SABIC shuttered high-cost European crackers, reallocating capital to Middle Eastern assets with ethane advantage. ExxonMobil patented a novel trimer catalyst achieving viscosity indices above 140, targeting premium engine-oil basestocks.
Emergent players include LG Chem and Mitsui Chemicals, partnering with Middle Eastern complexes for cost-competitive feedstock. Regulatory compliance-REACH registration and EU sustainability directives-creates entry barriers favoring incumbents with established testing portfolios. As Asian capacities ramp and European assets exit, competitive balance tilts toward feedstock-abundant geographies, sustaining a moderate concentration profile.
Alpha Olefins Industry Leaders
Chevron Phillips Chemical Company LLC
Shell plc
Exxon Mobil Corporation
INEOS
SABIC
- *Disclaimer: Major Players sorted in no particular order

Market Opportunities and Future Outlook
White space shows up where fast-growing derivative demand needs tighter control over alpha olefin cut and purity, particularly high-purity C6/C8 for metallocene LLDPE and higher-carbon cuts for PAO, drag reducers, and additive packages. Recent actions reflect this. Shells Geismar, Louisiana alpha olefins expansion program (Tiger AO4) is positioned to lift a key North American supply node above 1.3 million metric tons per year of alpha olefins capacity, while ExxonMobil Product Solutions has highlighted commercial deployment of higher carbon number, high-purity Elevexx LAO for specialty uses such as drag reducers and synthetic lubricant additives.
A second opportunity area centers on localizing supply in markets that depend on imports for higher-carbon alpha olefins and specialty grades, supported by technology and pilot-to-scale pathways. In July 2026, Yapei Technology launched a thousand-ton pilot ethylene oligomerization project in Lanzhou in collaboration with PetroChina Lanzhou Petrochemical and Gansu Chemical Industry Research Institute, targeting high-carbon alpha olefins. At the same time, downstream pull from surfactants is being reinforced by capacity actions such as Stepan Companys June 2025 investments to expand alpha olefin sulfonates output across US sites (Millsdale, Anaheim, and Winder), which can improve alignment between upstream product slates and detergent-range and specialty alpha olefin demand centers.
Recent Industry Developments
- June 2026: Chevron Phillips Chemical declared force majeure on AlphaPlus normal alpha olefins supplies after an unplanned outage at its Cedar Bayou, Texas, facility. The disruption highlighted operational concentration risk at major integrated hubs and tightened near-term availability for buyers that rely on merchant NAO volumes.
- December 2025: Chevron announced a 2026 capital program that included funding support for two new world-scale facilities under construction, with targeted startup in 2027. The spending direction reinforced the industry shift toward capacity additions tied to large, integrated Gulf Coast complexes that can secure feedstock and place alpha olefins into multiple derivative chains.
- October 2024: The National Institute of Clean-and-Low-Carbon Energy (NICE, part of CHN Energy) and Eindhoven University of Technology reported progress using a pure-phase chi-iron carbide catalyst to convert syngas directly into linear alpha olefins. The advance strengthened the technology pipeline for alternative production routes beyond ethylene oligomerization, relevant for regions aiming to diversify feedstock options.


Research Methodology Framework and Report Scope
Market Definition and Coverage
For this study, the alpha olefins market covers demand and supply of alpha-position olefins (such as 1-butene, 1-hexene, 1-octene and related cuts) traded and consumed for downstream uses like polyolefin comonomers, detergents, lubricants, and oil field chemicals.
Scope exclusions: Excludes downstream derivatives and finished formulations (for example, polyethylene, surfactant blends, and lubricant packages) unless the transaction is for the alpha olefin itself.
Segmentation Overview
- By Type
- C4 (1-Butene)
- C6 (1-Hexene)
- C8 (1-Octene)
- Other Types
- By Production Process
- Ethylene Oligomerization
- Fischer-Tropsch Synthesis
- Bio-based Alcohol Dehydration
- By Application
- Polyolefin Comonomers
- Lubricants
- Oil Field Chemicals
- Plasticizers
- Surfactants
- Other Applications
- By End-use Industry
- Packaging
- Automotive
- Oil and Gas
- Cosmetics and Personal Care
- Other End-user Industries
- By Geography
- Asia-Pacific
- China
- India
- Japan
- South Korea
- ASEAN Countries
- Rest of Asia-Pacific
- North America
- United States
- Canada
- Mexico
- Europe
- Germany
- United Kingdom
- Italy
- France
- NORDIC Countries
- Rest of Europe
- South America
- Brazil
- Argentina
- Rest of South America
- Middle-East and Africa
- Saudi Arabia
- South Africa
- Rest of Middle-East and Africa
- Asia-Pacific
Data Sources, Market Sizing, and Validation
Desk Research
Desk work starts with building a clean fact base on olefins supply, trade, and end-use pull, then mapping it to alpha olefins specifically. Public sources such as the US Energy Information Administration, the US International Trade Commission data, Eurostat, UN Comtrade, and customs or port statistics help identify import-export direction, product flows, and turning points by region.
On the industry side, we use producer announcements, investor decks, annual reports, and technical papers in polymer and catalysis journals to understand capacity additions, operating rates, and typical product slates by chain length. Patent databases are also used to track process shifts (for example, oligomerization catalyst changes) that can affect yields over time. We also use paid subscription company financials and news context where it helps validate timelines and plant events. These examples are not exhaustive, and many other public and paid sources were also used for data collection, validation, and clarification.
Primary Interviews and Surveys
Primary work is used to pressure test the model with people who sit close to actual volumes and price behavior, including producers, distributors, traders, and large end users such as polyethylene producers and detergent alcohol buyers. We also speak with process and commercial roles to confirm utilization patterns, regional tightness, and how contract pricing differs from spot during feedstock swings. Since the market is global, inputs are checked across APAC, EMEA, and the Americas so regional assumptions do not carry over without a sanity check.
Distribution of primary research fieldwork respondents
| Company type | Respondent position | Region |
|---|---|---|
| Top tier: 32% | CXOs: 13% | APAC: 45% |
| Mid tier: 53% | Functional/Unit leaders: 34% | EMEA: 36% |
| Smaller Players: 15% | Managers: 53% | Americas: 19% |
Market-Sizing & Forecasting
Sizing is built using a top-down approach where regional olefins production, alpha olefin capacity by process route, and trade signals are used to reconstruct the addressable alpha olefins pool, and then it is allocated to end uses based on realistic consumption splits. To keep it practical, we track inputs such as ethylene and naphtha cost direction, announced and effective capacity by chain length, operating rate ranges, polyethylene comonomer demand trends, and visible import-export movements for relevant HS codes.
After the first cut is built, selective bottom-up checks are run using sampled producer and distributor volumes. We also do channel checks on contract versus spot price spreads, and we use simple volume times ASP approximations by key cuts (C4, C6, C8, and others). Where the supplier roll-up is incomplete, gaps are handled by using utilization and yield ranges confirmed in interviews, and then we rebalance totals back to observed trade and demand indicators.
For forecasting, scenario analysis is used, since outcomes depend heavily on new capacity timing, feedstock economics, and polyethylene demand cycles. A base case is set, then a tighter and looser case is run around utilization, net trade, and ASP progression. The final path is chosen after expert feedback confirms what is most likely.
Data Validation & Update Cycle
Outputs are checked in several steps so the final numbers do not rely on one single assumption. We compare totals against independent signals like capacity change logs, trade balances, and visible downstream pull, then investigate variances that do not match the story in public data and interviews.
Before sign-off, a second analyst reviews key drivers, formulas, and year-to-year movements. Unusual shifts trigger re-contact with sources to confirm what changed. Reports are refreshed annually, and interim updates are done if a material event occurs (for example, a major plant outage, start-up delay, or trade disruption). Just before delivery, a fresh pass is completed so clients receive the latest updated view.
Mordor Intelligence's Alpha Olefins Market Sizing Compared With Other Published Estimates
It is normal to see different published market sizes for alpha olefins, even when the topic name looks identical. Differences usually come from how each publisher defines the product boundary, whether values or volumes are used, how pricing is converted to USD, and how often assumptions are refreshed.
Some estimates present a value number that can absorb downstream derivative economics, or they use list prices and broad application buckets. In Mordor Intelligence, the core count is kept to alpha olefin products only (C4, C6, C8 and other cuts), and the work is built from capacity, utilization, and trade checks, then converted carefully when price assumptions are required.
Benchmark comparison
| Source | Market Size | Gaps in Research Methodology |
|---|---|---|
| Mordor Intelligence | USD 8.79 B (2026) | |
| Industry Publisher A | USD 10.21 B (2024) | Uses an earlier base year and applies broad average pricing across regions, and the scope description does not clearly separate alpha olefins from adjacent petrochemical value captured in downstream chains. |
| Industry Publisher B | USD 8.00 B (2025) | Anchors the starting value on a single-year estimate with limited visibility on regional trade balancing, and assumptions on chain-length mix and utilization are not clearly shown, which can shift the total. |
Across the three figures, the spread is mainly explained by the year chosen, how pricing is handled, and how tightly the product definition is kept to alpha olefins versus adjacent value. By tying the model to observable capacity and flow signals and then validating it with interviews, we end up with a number that is easier to trace and repeat when market conditions change.


Key Questions Answered in the Report
What is the volume of the alpha olefins market?
The alpha olefins market size reached 7.32 million tons in 2026 and is forecast to reach 9.40 million tons by 2031.
How fast is global demand for alpha olefins expected to grow?
The market is forecast to expand at a 5.13% CAGR to 2031.
Which application segment drives most alpha olefins consumption?
Polyolefin comonomers account for 57.58% of 2025 demand and will grow at a 6.26% CAGR.
Why are poly-alpha-olefin lubricants gaining popularity?
PAO offers high viscosity indices and thermal stability above 150 °C, meeting stringent EV and hybrid engine requirements.
Page last updated on:


 Your data is secure and never sold or shared.


