
Market Overview
| Study Period | 2021 - 2031 |
|---|---|
| Forecast Data Period | 2026 - 2031 |
| Base Year Market Size (2025) | 30.49 gigawatt |
| Market Volume (2026) | 32.68 gigawatt |
| Market Volume (2031) | 46.22 gigawatt |
| Growth Rate (2026 - 2031) | 7.18 % |
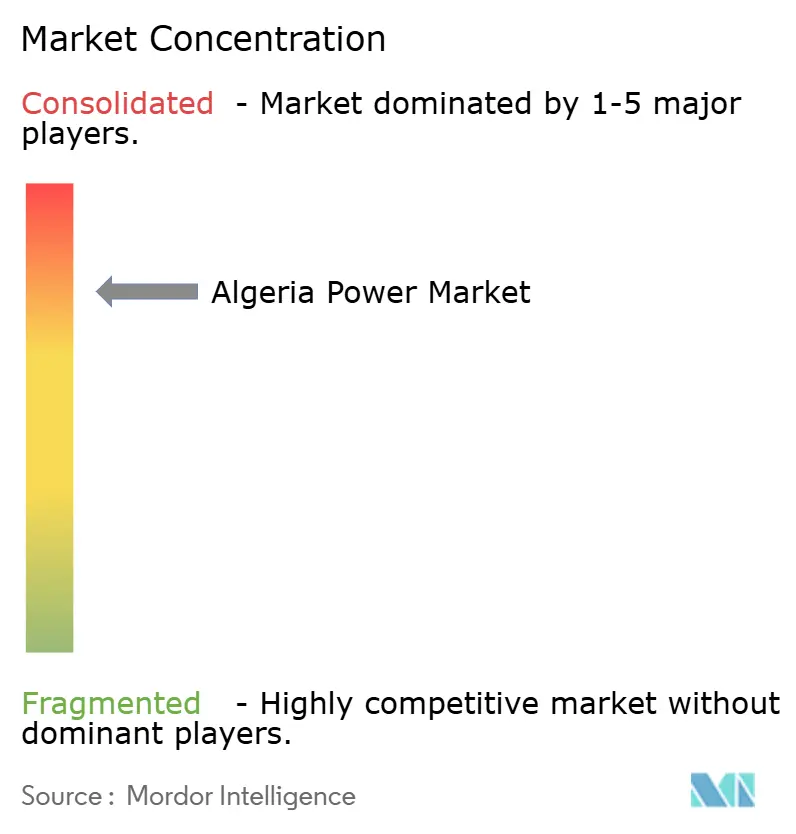
| Market Concentration | High |
Major Players *Disclaimer: Major Players sorted in no particular order Image © Mordor Intelligence. Reuse requires attribution under CC BY 4.0. | |
Algeria Power Market Analysis by Mordor Intelligence
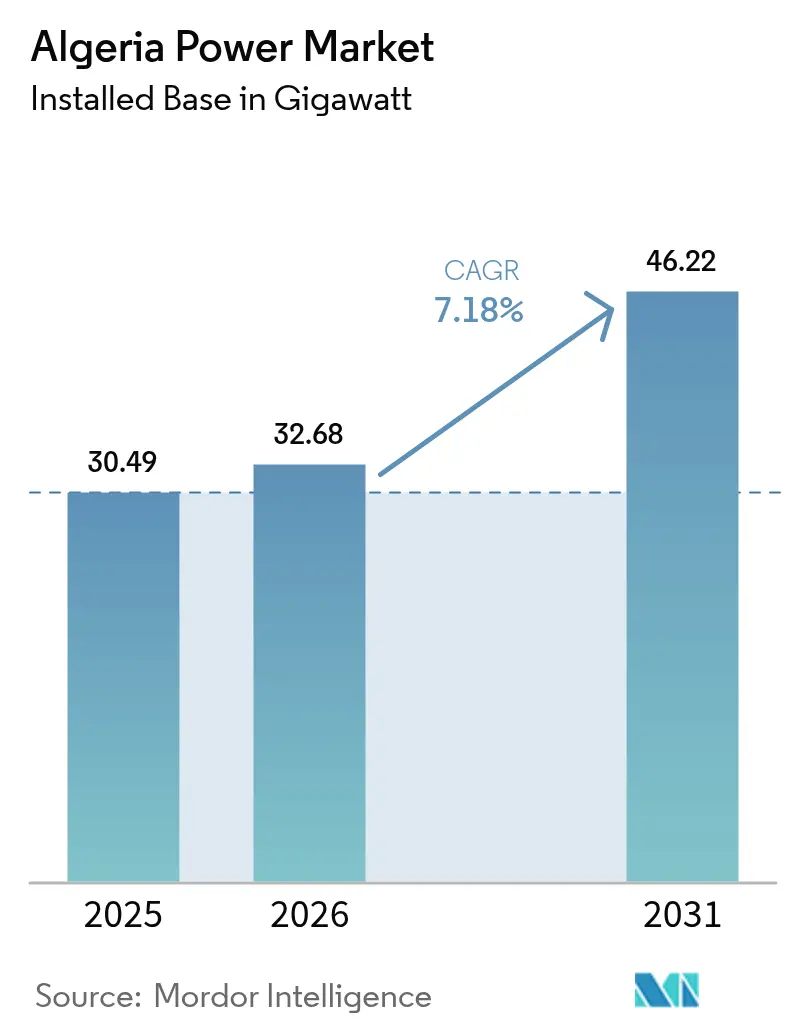
The Algeria Power Market size was valued at 30.49 gigawatt in 2025 and estimated to grow from 32.68 gigawatt in 2026 to reach 46.22 gigawatt by 2031, at a CAGR of 7.18% during the forecast period (2026-2031).
Thermal generation represented 97.45% of capacity in 2024, yet renewables are the fastest-growing, supported by successive solar tenders that awarded 3 GW in March 2024 and launched a further 3.2 GW in March 2025. Gas-fired plants remain the reliability anchor, while photovoltaic build-outs diversify the energy mix and improve resilience to summer peaks that reached 19.1 GW in July 2024. Policy catalysts include the 15 GW renewables target for 2030, removal of foreign-ownership caps under Investment Law 22-18, and an expansive grid-upgrade master plan that will add 30,000 km of high-voltage lines by 2030. Rapid commercial and industrial (C&I) adoption of off-grid solar, localization of high-voltage equipment manufacturing, and emerging battery-storage bids create investable white space even as elevated financing costs and grid-flexibility limits temper near-term momentum.
Key Report Takeaways
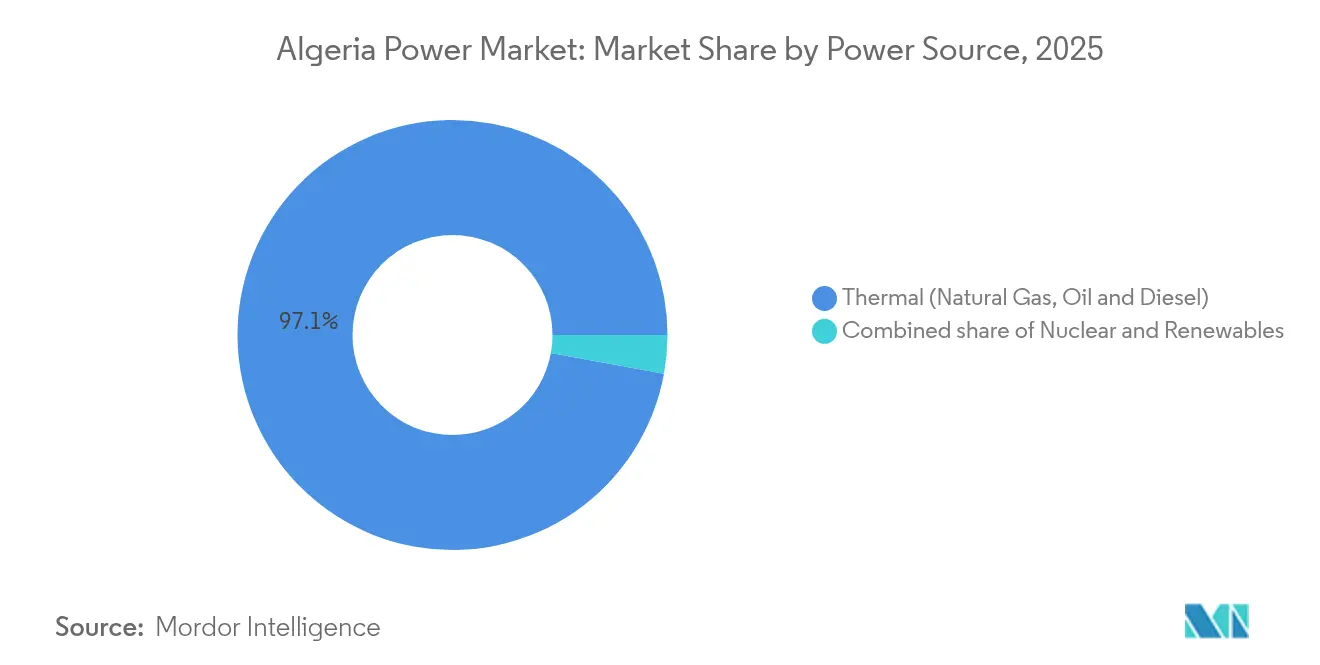
- By power source, thermal generation held 97.12% of Algeria's power market share in 2025, while renewables are forecast to post the fastest growth at a 45.6% CAGR to 2031.
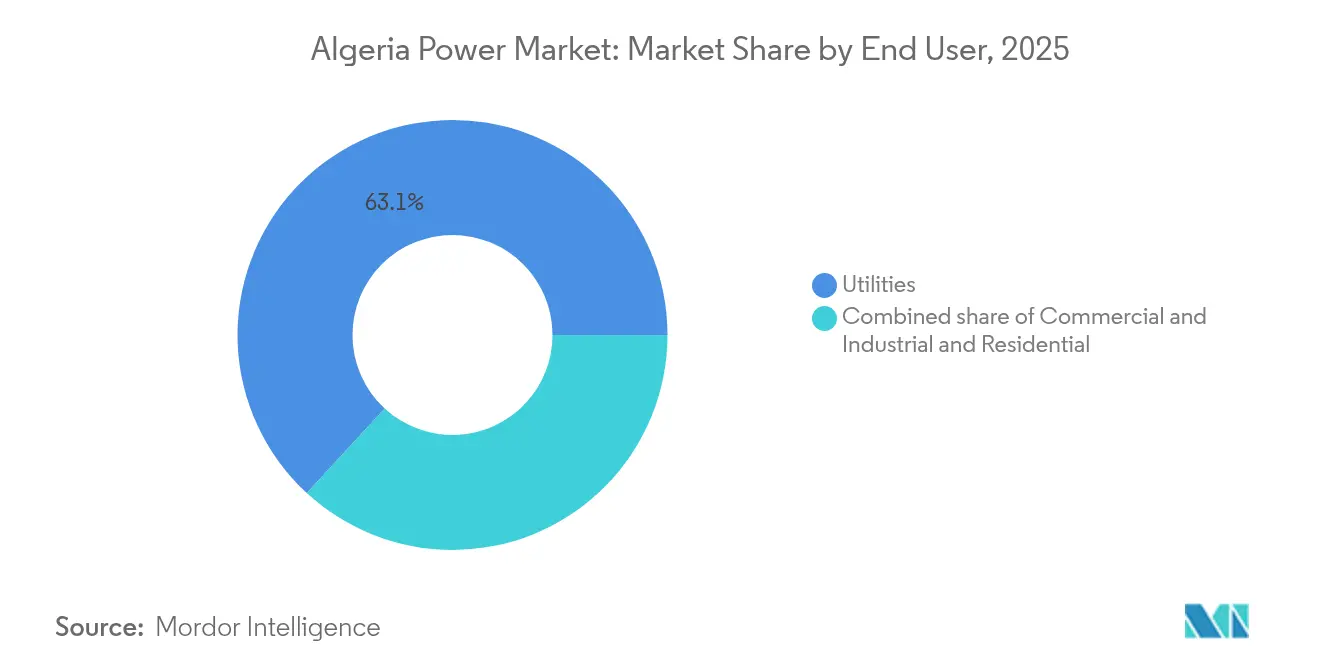
- By end user, utilities controlled 63.15% of installed capacity in 2025, whereas the C&I segment is projected to expand at a 9.34% CAGR through 2031.
Note: Market size and forecast figures in this report are generated using Mordor Intelligence’s proprietary estimation framework, updated with the latest available data and insights as of 2026.
Algeria Power Market Trends and Insights
Drivers Impact Analysis*
| Driver | (~) % Impact on CAGR Forecast | Geographic Relevance | Impact Timeline |
|---|---|---|---|
| Rapid electricity-demand growth (population & industrialization) | +2.10% | National, concentrated in coastal industrial zones and Algiers metropolitan area | Short term (≤ 2 years) |
| Government 2030 renewables target (15 GW) | +3.20% | National, with highest deployment in southern solar belt (Adrar, Béchar, Ouargla, Tamanrasset) | Medium term (2-4 years) |
| Abundant domestic natural-gas reserves | +1.40% | National, supporting thermal baseload across all regions | Long term (≥ 4 years) |
| National grid-expansion master-plan (2024-2030) | +1.80% | National, priority corridors linking southern renewables to northern demand centers | Medium term (2-4 years) |
| Emerging green-hydrogen export projects | +0.90% | Southern regions (Tamanrasset, Adrar) for production; coastal terminals for export | Long term (≥ 4 years) |
| C&I off-grid solar to mitigate reliability issues | +1.30% | Industrial zones nationwide, particularly manufacturing hubs in Oran, Constantine, Sétif | Short term (≤ 2 years) |
| Source: Mordor Intelligence | |||
Rapid Electricity-Demand Growth Propels Capacity Additions
Generation reached 95 TWh in 2024, and peak demand climbed to 19.1 GW, driven by a population of 45.9 million and industrial projects, such as the 200 MW Tindouf solar plant dedicated to the Gara Djebilet iron-ore complex.(1)Sonelgaz connected 10,000 farms in 2025, bringing rural electrification links since 2020 to 78,000 and adding distributed load that complicates forecasting.(2) Subsidized tariffs of USD 0.03 per kWh, compared with production costs of USD 0.08–0.10 per kWh, keep consumption price-insensitive and widen Sonelgaz’s subsidy burden above USD 8 billion each year. The mismatch between load growth and plant additions favors quick-install gas turbines and modular solar over long-lead nuclear or coal alternatives.
Government 2030 Renewables Target Anchors Investment Pipeline
The 15 GW mandate has already queued 6.2 GW of solar capacity, equal to 40% of the objective, signaling execution urgency.(3) Chinese firms secured around 60% of the first 3 GW tranche at bid prices between €0.54 and €0.81 per watt, setting a cost floor for future rounds. The 80 MW Abadla plant, started in March 2025, deploys automated cleaning and real-time monitoring to preserve performance in desert conditions. A 1,000 MW wind program remains under feasibility review, but solar’s faster timelines mean photovoltaic additions will dominate through mid-decade. Ministry consolidation in late 2024 has not slowed tender momentum.
Natural-gas reserves provide transition flexibility
Proven reserves of 159 Tcf assure supply security and export earnings, enabling Algeria to deploy gas as a balancing fuel during variable-renewable scale-up. Production is targeted to reach 200 bcm by 2030, supported by new field developments such as Timimoun and Ahnet-Gourara. Flexible CCGT units stabilize frequency and voltage when high-irradiance PV drops unexpectedly, thus smoothing renewable integration while preserving revenue streams from pipeline exports to Spain and Italy.
National Grid-Expansion Master Plan Enables Renewable Integration
Sonelgaz operates 35,537 km of transmission and 416,516 km of distribution lines, but must add 30,000 km of high-voltage routes and more than 300 bulk substations by 2030 to evacuate southern solar output. The GE-Sonelgaz venture GEAT will manufacture 134 high-voltage and extra-high-voltage substations locally by 2028, shrinking import requirements and shortening lead times. Feasibility work on high-voltage direct-current corridors, including the 2 GW Medlink interconnector to Tunisia and Italy, underpins future export ambitions. The 950 km Béchar–Tindouf–Gara Djebilet mining railway demands parallel transmission to power rail operations and adjacent mines, creating co-investment openings for grid developers.
Restraints Impact Analysis*
| Restraint | (~) % Impact on CAGR Forecast | Geographic Relevance | Impact Timeline |
|---|---|---|---|
| Financing constraints & high CAPEX | -1.60% | National, affecting all large-scale generation and transmission projects | Medium term (2-4 years) |
| Ageing thermal fleet efficiency losses | -0.80% | National, concentrated in older plants (30+ years) in coastal and northern regions | Short term (≤ 2 years) |
| Water scarcity for thermal / hydro cooling | -0.70% | Coastal and northern thermal plants; limited hydro sites in Kabylie and Atlas ranges | Long term (≥ 4 years) |
| Grid-flexibility limits causing RE curtailment | -1.20% | Southern solar-rich regions (Adrar, Béchar, Ouargla) with limited storage and transmission capacity | Medium term (2-4 years) |
| Source: Mordor Intelligence | |||
Financing Constraints Slow Project Execution
Weighted-average cost of capital for renewables in emerging markets ranges from 3.6% to 7.2% in real terms, and Algeria sits near the upper end because of political and payment-assurance risk. The January 2025 re-tender of 520 MW, 120 MW Kenadsa, 150 MW Touggourt, 250 MW Tamacine, after the Fimer-Cosider consortium failed to secure debt, underscores the gap between low bids and bankable structures. Competitive procurement rules trigger tenders above 12 million dinars (USD 83,000), yet offtaker guarantees remain limited, deterring commercial banks absent sovereign wraps. Sonelgaz’s subsidy-driven losses curb its balance-sheet capacity, restricting letters of credit for independent power producers. The National Fund for Energy Management, financed by a USD 0.0002 per-kWh levy on industrial sales, produces insufficient cash flow to anchor multibillion-dollar programs, leaving Chinese export credit and multilateral soft loans as key funding sources.
Grid-Flexibility Limits Trigger Renewable Curtailment
The network was built for centralized thermal dispatch, and midday solar surpluses now force curtailment without large-scale storage or pumped hydro. The 200 MW Tindouf plant includes the country’s first utility-scale battery, yet the 3.2 GW 2025 solar round lacks mandatory co-located storage, elevating curtailment risk as penetration rises. Transient-stability modeling in Kaberten shows solar improves contingency response when paired with reactive-power support, but highlights the need for FACTS devices and strict grid-code enforcement. Algeria has not yet created an ancillary-services market, leaving frequency regulation to ageing steam units with low ramp rates. IRENA’s 2024 outlook stresses that tripling global renewables by 2030 will demand USD 720 billion a year in grids and flexibility; Algeria will need a proportionate multi-billion allocation to avoid stranding assets.
*Our forecasts treat driver/restraint impacts as directional, not additive. The impact forecasts reflect baseline growth, mix effects, and variable interactions.
Segment Analysis
By Power Source: Thermal Dominance Persists Amid Renewable Surge
Thermal capacity accounted for 97.12% of installations in 2025, anchored by gas-fired combined-cycle and open-cycle plants, yet renewables are forecast to grow at a 45.6% CAGR, capturing the bulk of net additions through 2031. The Algerian power market size for thermal generation stood at 29.61 GW in 2025 and is expected to edge higher as flexible aeroderivative units replace inefficient steam turbines. Abundant domestic gas, backed by the USD 2.3 billion Hassi R’Mel compression project, secures feedstock and enables thermal units to balance variable solar, mitigating dispatch risk during evening ramps. Nuclear remains absent, and limited hydro potential keeps zero-carbon baseload options narrow, intensifying reliance on gas until battery costs fall. Solar photovoltaic commands more than 6 GW of the procurement pipeline, positioning it to surpass 4 GW online by 2028 and to lead installed renewable capacity by the end of the decade.
Wind’s initial 1 GW program targets 10 sites under World Bank guidance, but lower capacity factors and lengthier permitting defer utility-scale build-out to the late 2020s. Hydro, geothermal, biomass, and tidal resources remain negligible due to resource limits, water scarcity, or early-stage technology readiness. The 200 MW Tindouf solar-plus-storage project exemplifies hybrid configurations that relieve grid bottlenecks and supply captive industrial loads. LONGi’s plan to localize cell-to-module manufacturing could narrow equipment costs and boost Algeria’s competitiveness as a regional supplier. Collectively, these trends keep thermal in a dispatchable leadership role while renewables seize growth leadership.

By End User: Utilities Anchor Demand, C&I Accelerates
Utilities owned 63.15% of installed capacity in 2025, equal to 19,254 MW, which generated 89,996 GWh in 2023.The Algerian power market share for utilities will inch down as industrial self-generation climbs, though the segment retains scale through transmission and distribution monopolies. C&I installations are poised for a 9.34% CAGR through 2031, spurred by reliability gaps and tariff subsidies that make on-site solar payback attractive despite soft PPA frameworks. Desalination facilities, each producing 300,000 m³ per day and drawing 4.15 kWh per m³, target 30% solar sourcing, opening a 600 MW renewable opportunity by 2030. The residential share benefits from 99.4% electrification and ongoing farm-connection programs that added 10,000 links in 2025 alone.
Subsidized pricing suppresses demand-side management, yet peak-demand spikes drive factories to install batteries and backup generators to avoid costly outages. The 200 MW Tindouf captive-power model demonstrates how mining ventures can bypass grid constraints and secure competitively priced electricity in remote areas. Law 22-18’s foreign-ownership liberalization permits international developers to sell directly to industrial users, although creditworthiness and regulatory clarity remain hurdles. Sonelgaz earned €268 million in export revenue in 2024 by selling surplus power to Tunisia and Morocco, pointing toward expanded regional trade as interconnections scale.
Geography Analysis
Northern coastal provinces consume most electricity because of dense populations and industry, while the southern desert belt hosts superior solar irradiance exceeding 3,500 sun hours annually. The March 2025 3.2 GW solar round was split among 12 provinces to minimize transmission congestion and support regional stability. Béchar’s 80 MW Abadla plant will connect through a 30/60 kV substation and deploy robotic cleaning to combat dust, showcasing site-specific design for desert environments. The 200 MW Tindouf plant, 80 km from Gara Djebilet, integrates storage to power mining and surrounding communities, illustrating how renewables unlock remote resource corridors.
Coastal Boumerdès houses the 1,200 MW Ras Djinet combined-cycle plant and two of the five new desalination projects, piling load onto the gas-rich coastline. Algeria’s August 2024 cooperation pact with Italy, paired with the proposed Medlink 2 GW submarine cable, positions northern provinces as future export gateways pending grid upgrades. The 950 km Béchar–Tindouf–Gara Djebilet railway corridor will require synchronous transmission rollout, prompting joint infrastructure opportunities. Sonelgaz’s 30,000 km high-voltage expansion and 70,000 km distribution extension plan, valued at USD 10–15 billion, hinges on private participation to meet 2030 timelines.
Southern Tamanrasset and Adrar anchor green-hydrogen pilot zones that target 30–40 TWh a year by 2040, yet water scarcity forces seawater desalination and long pipelines, adding cost and complexity. Italian developer Zhero’s €60 million capital raise in April 2024 for solar-hydrogen ventures underscores early foreign appetite for the region’s export potential. Existing 400 MW links to Tunisia and Morocco, and the mooted Italy cable, provide monetization routes for surplus generation once transmission bottlenecks ease.
Regulatory Landscape
Algeria’s electricity and gas sector operates under a centralized, state-led framework overseen by the Commission de Regulation de l Electricite et du Gaz (CREG), established under Law No. 02-01 (February 5, 2002). It governs electricity and gas production, transmission, distribution, and commercialization. The renewable energy enabling framework is anchored by Law No. 04-09 (August 14, 2004) on promoting renewable energy within sustainable development, complemented by national energy-policy programs led by the Ministry of Energy and Mines.
Transmission is treated as a natural monopoly operated by Société Algérienne de Gestion du Réseau de Transport de l Electricite (GRTE Spa). This setup shapes grid-access and dispatch arrangements for new generation. In parallel, Investment Law 22-18 (July 24, 2022) sets broader market entry conditions for investors, while technical specifications for facility design and construction issued by the Ministry and enforced through CREG oversight remain a key compliance gate for developers and equipment suppliers.
Competitive Landscape
The Algeria power market remains highly concentrated. Sonelgaz exerts operational control yet increasingly collaborates with foreign equipment providers and developers. GE Vernova’s localized substation production and Siemens Energy’s service agreements on CCGTs illustrate strategic entry models that blend technology with domestic value creation. TotalEnergies pursues integrated portfolios spanning upstream gas, utility-scale PV, and potential hydrogen offtake, while ENI engages in flare-gas reduction projects aligned with carbon-intensity goals.(5)
Recent PV tenders attracted 41 bidder expressions, reflecting heightened competitive intensity as LCOEs compress. Local engineering firms, including SHAEMS and SKTM, expand EPC competencies, elevating domestic participation in renewables. Storage, grid-automation, and smart-meter niches remain open, with Schneider Electric and Huawei Digital Power eyeing future tenders. Market entry barriers persist, foreign-exchange risk, subsidized retail tariffs, and local-content mandates, but transparent auctions and multilateral credit enhancements are gradually lowering thresholds.
As utility‐scale storage regulations emerge post-2027, technology-agnostic players capable of integrating batteries, power electronics, and advanced EMS may secure an early-mover advantage. Meanwhile, state policies balance sovereignty over critical assets with foreign capital needs, shaping a competitive environment in measured transition.
Algeria Power Industry Leaders
-
General Electric Company
-
Eni Spa.
-
Condor Electronics SPA
-
SOLIWIND Algérie Sarl
-
Algerian Energy Company, Spa
- *Disclaimer: Major Players sorted in no particular order
Market Opportunities and Future Outlook
Grid integration and flexibility services are a clear whitespace as Algeria expands solar procurement within a system built around centralized thermal dispatch. Sonelgaz’s national grid-expansion master plan (2024-2030), which includes adding 30,000 km of high-voltage lines and more than 300 bulk substations by 2030, creates addressable demand for substation packages, protection and control, grid automation, FACTS and reactive-power solutions, and advanced grid-code compliance services. This need is most visible along corridors linking the southern solar belt (Adrar, Bechar, Ouargla) to coastal demand centers. The GE Vernova-Sonelgaz GEAT venture to manufacture 134 high-voltage and extra-high-voltage substations locally by 2028 also points to supplier and subcontractor opportunities across local fabrication, testing, commissioning, and spares.
On the generation side, near-term opportunities focus on utility solar EPC, storage integration, and efficient gas capacity additions to manage peak constraints, supported by successive solar tenders (3 GW awarded in March 2024 and a further 3.2 GW launched in March 2025). Large CCGT builds such as the 1,406 MW Tebessa plant and the 1,266 MW Mostaganem plant also reinforce demand for gas-side integration and performance improvements. C&I self-generation and captive power remain another investable lane, driven by summer peaks (19.1 GW in July 2024), tariff and reliability dynamics, and demonstrated hybrids like the 200 MW Tindouf solar plant dedicated to the Gara Djebilet mining complex, which also added utility-scale battery storage. Regional interconnections and export-oriented infrastructure add a parallel pathway for equipment and services, supported by feasibility work on the 2 GW Medlink interconnector to Tunisia and Italy and Sonelgaz’s push to formalize export capabilities through its international arm.
Recent Industry Developments
- July 2026: Sineng Electric delivered central inverters totaling 154 MW for two utility-scale solar PV projects in Beni Ounif (52.8 MW) and Ain Baida (101.2 MW). The deliveries support execution capacity for Algeria’s multi-gigawatt solar pipeline by reducing lead times for power-electronics and grid-compliance equipment.
- July 2025: Sonatrach and Eni signed a USD 1.35 billion, 30-year production sharing contract for the Zemoul El Kbar area, alongside an MoU covering broader energy-security cooperation. Higher gas availability supports Algeria’s gas-fired generation fleet as the reliability anchor while solar additions scale, helping manage evening ramps and seasonal peaks.
- June 2024: GE Vernova and Sonelgaz expanded the GEAT joint venture in Batna to add manufacturing of high-voltage and extra-high-voltage substation equipment in Algeria. Localized production improves delivery certainty for grid-expansion programs and builds domestic capability for transmission and distribution equipment supply.
Research Methodology Framework and Report Scope
Market Definition and Coverage
This market is defined as Algeria's installed power generation capacity that is available to serve electricity demand, tracked in gigawatts and sized for the country level across the study period.
Scope exclusions: The sizing excludes fuel production, upstream oil and gas, and electricity retail billing value unless it directly changes installed generation capacity.
Segmentation Overview
- By Power Source
- Thermal (Coal, Natural Gas, Oil and Diesel)
- Nuclear
- Renewables (Solar, Wind, Hydro, Geothermal, Biomass & Waste, Tidal)
- By End User
- Utilities
- Commercial and Industrial
- Residential
- By T&D Voltage Level (Qualitative Analysis only)
- High-Voltage Transmission (Above 230 kV)
- Sub-Transmission (69 to 161 kV)
- Medium-Voltage Distribution (13.2 to 34.5 kV)
- Low-Voltage Distribution (<1 kV)
Data Sources, Market Sizing, and Validation
Desk Research
Desk research was used to establish the factual base for Algeria's power system and to keep the model anchored to public series that can be rechecked. Sources included national energy and electricity regulator publications, electricity utility planning releases, and official statistics portals for macro indicators and demand context. International references, including IEA electricity indicators, U.S. EIA country energy briefs, and World Bank data series, were used to cross-check direction and timing.
To translate the narrative into model inputs, we pulled technology mix signals, policy targets, tender announcements, and grid-related additions from government gazettes, association websites, and reputable press coverage, then standardized them into a consistent year format. For company level context, we reviewed filings, annual reports, and investor presentations, and used a paid subscription for company financials and news intelligence selectively to verify ownership, commissioning timelines, and the status of large projects. These desk sources are illustrative only, and we also referred to other public documents and databases for data collection, validation, and clarification during the research process.
Primary Interviews and Surveys
Interviews with Algerian generation, transmission, distribution, equipment, and large-user experts, together with surveys, help assess additions, outage patterns, peak-load timing, renewable project readiness, and tariff effects within Algeria. Respondent input is used to check public records, clarify commissioning dates and plant availability, and triangulate the capacity outlook. Follow-up is requested when expert views differ materially from documented project schedules.
Distribution of primary research fieldwork respondents
| Company type | Respondent position |
|---|---|
| Top tier: 30% | CXOs: 15% |
| Mid tier: 50% | Functional/Unit leaders: 30% |
| Smaller Players: 20% | Managers: 55% |
Market-Sizing & Forecasting
The sizing starts from a top-down reconstruction of Algeria's capacity pool, where public installed capacity series and announced additions are aligned year by year, then adjusted using build and retirement timing that is confirmed through interviews. Once the national total is set, it is distributed by technology based on observed mix and the project pipeline visible in tenders and official plans.
To make sure the totals are not just a paperwork exercise, we ran selective bottom-up checks using sampled plant additions, typical unit sizes for new builds, and expected commissioning schedules from project updates. Key inputs that were tracked (illustrative) include installed capacity by source, planned and awarded capacity additions, retirement and refurbishment events, peak demand outlook signals, and grid integration readiness for renewables. When plant level data was incomplete, we used conservative timing assumptions, then revalidated the gap with expert feedback so missing items did not inflate the market.
For forecasting, scenario analysis was used because capacity growth is sensitive to tender execution, financing conditions, and grid readiness, and these are better handled as structured cases than as one straight line. The final forecast path was selected after checking that implied annual additions match what market participants consider feasible for Algeria over the forecast window.
Data Validation & Update Cycle
Outputs are checked in several steps so the final numbers are consistent with observable system signals. Analysts compare the modeled capacity path against independent indicators such as recent additions, technology shares, and public planning milestones, then investigate any sharp jumps or drops before sign-off. If a variance cannot be explained with a clear event, for example a delayed tender or a commissioning slip, we re-contact sources to confirm timing.
The report is refreshed annually, and interim updates are made when material events occur, such as policy shifts, major tender awards, or large project delays. Before delivery, a final review pass captures the latest public announcements and keeps the totals aligned with the most current information available.
Mordor Intelligence's Algeria Power Market Size Versus Other Published Estimates
Published estimates for Algeria's power market often differ because the market can be expressed in different units and because some studies mix installed capacity with generation output or spending value. Differences also show up when sources treat planned projects as if they are already online, or when they use different base years and currency conversion timing.
The main gap comes from counting announced capacity versus commissioned capacity, where Mordor Intelligence treats the market as installed capacity in GW and only adds projects when commissioning evidence and timing checks support it, rather than booking the full headline pipeline early.
Benchmark comparison
| Source | Market Size | Gaps in Research Methodology |
|---|---|---|
| Mordor Intelligence | USD 30.49 B (2025) | |
| Trade Journal A | USD 22.60 B (2024) | Uses national installed capacity series by source as the main output, which can understate totals if it is not aligned to the same base year and if project commissioning updates are not layered in. |
| Global Consultancy B | USD 46.22 B (2031) | Publishes a forward year total that reflects a later timing point, and the estimate can look larger when forecast additions are treated as a single end state rather than being staged by realistic commissioning pace. |
Overall, the spread is mainly explained by unit choice and timing, since installed capacity, generation output, and end year forecasts can be placed side by side even though they measure different things. By keeping the model tied to commissioning timing, technology mix, and repeatable public series, the final figure stays traceable to clear drivers that clients can recheck.
Key Questions Answered in the Report
How fast is installed capacity growing in the Algeria power market?
Total capacity is expected to rise from 32.68 GW in 2026 to 46.22 GW by 2031, implying a 7.18% CAGR over the forecast period.
Which technology will add the most new capacity by 2031 in Algeria?
Solar photovoltaic will dominate additions, backed by 6.2 GW of tenders already in progress and a 45.6% CAGR through 2031.
Why are industrial firms in Algeria investing in their own solar plants?
Off-grid solar and storage help C&I users avoid summer grid outages and benefit from low generation costs amid subsidized retail tariffs.
What is the biggest barrier to renewable project delivery in Algeria?
Limited access to affordable finance and weak payment-assurance mechanisms have forced re-tendering of awarded capacity.
How is Algeria preparing to export electricity to Europe?
Feasibility studies are underway for the 2 GW Medlink submarine cable to Italy, while existing 400 MW lines to Tunisia and Morocco already handle cross-border flows.
Which segments will grow fastest within Algeria’s power demand?
Commercial and industrial users are projected to expand capacity at a 9.34% CAGR as factories and desalination plants adopt captive solar power.