Airport Moving Walkways Market Size and Share
Market Overview
| Study Period | 2019 - 2030 |
|---|---|
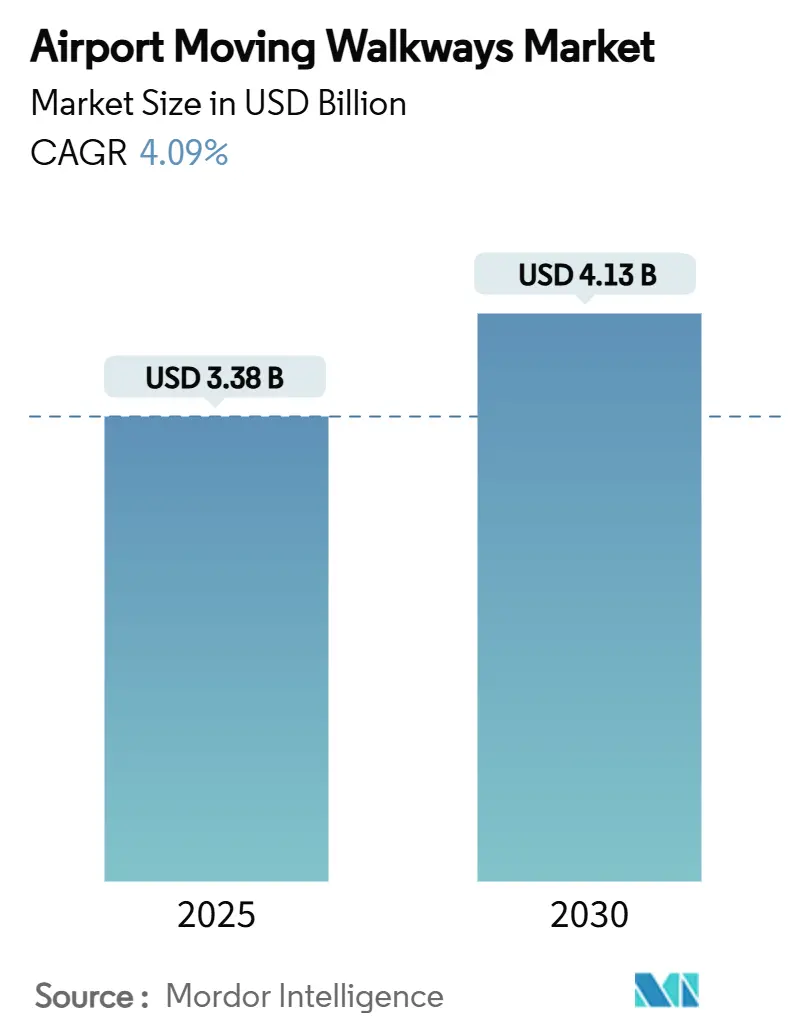
| Market Size (2025) | USD 3.38 Billion |
| Market Size (2030) | USD 4.13 Billion |
| Growth Rate (2025 - 2030) | 4.09% CAGR |
| Fastest Growing Market | Asia Pacific |
| Largest Market | Asia Pacific |
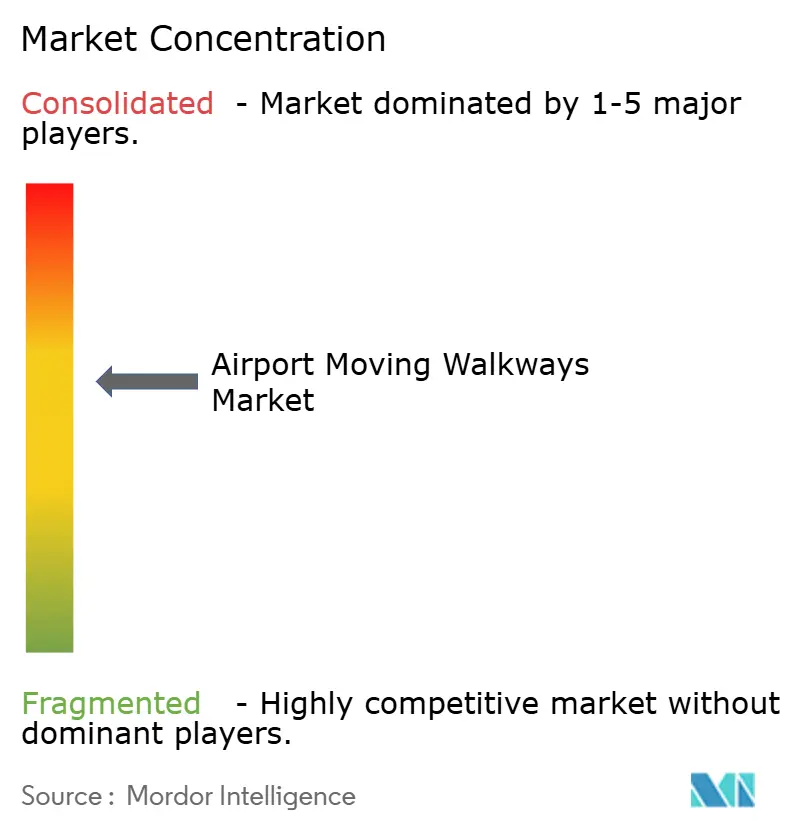
| Market Concentration | Medium |
Major Players *Disclaimer: Major Players sorted in no particular order Image © Mordor Intelligence. Reuse requires attribution under CC BY 4.0. | |
Airport Moving Walkways Market Analysis by Mordor Intelligence
The airport moving walkways market size reached USD 3.38 billion in 2025 and is projected to advance to USD 4.13 billion by 2030, progressing at a 4.09% CAGR. Airline traffic recovery, infrastructure modernization drives, and rising passenger-experience benchmarks across global hubs underpin the steady expansion.[1]Source: International Trade Administration, “January 2025 Air Passenger Travel,” trade.gov Airports continue to embed innovative conveyance solutions that shorten curb-to-gate times, satisfy accessibility mandates, and curb operating costs through energy-efficient drives. Asia-Pacific anchors demand thanks to a dense pipeline of greenfield construction, while North America and Europe upgrade legacy assets to comply with stricter sustainability and disability-access standards. Large hub programs like DFW International’s USD 1.86 billion 2024 capital plan signal resilient capital flows into horizontal transportation capacity.[2]Source: DFW International Airport, “Consolidated FY 2024 Budget Book,” dfwairport.com Meanwhile, suppliers differentiate through IoT-enabled diagnostics, predictive maintenance offerings, and modular retrofit packages designed to minimize terminal downtime.
Key Report Takeaways
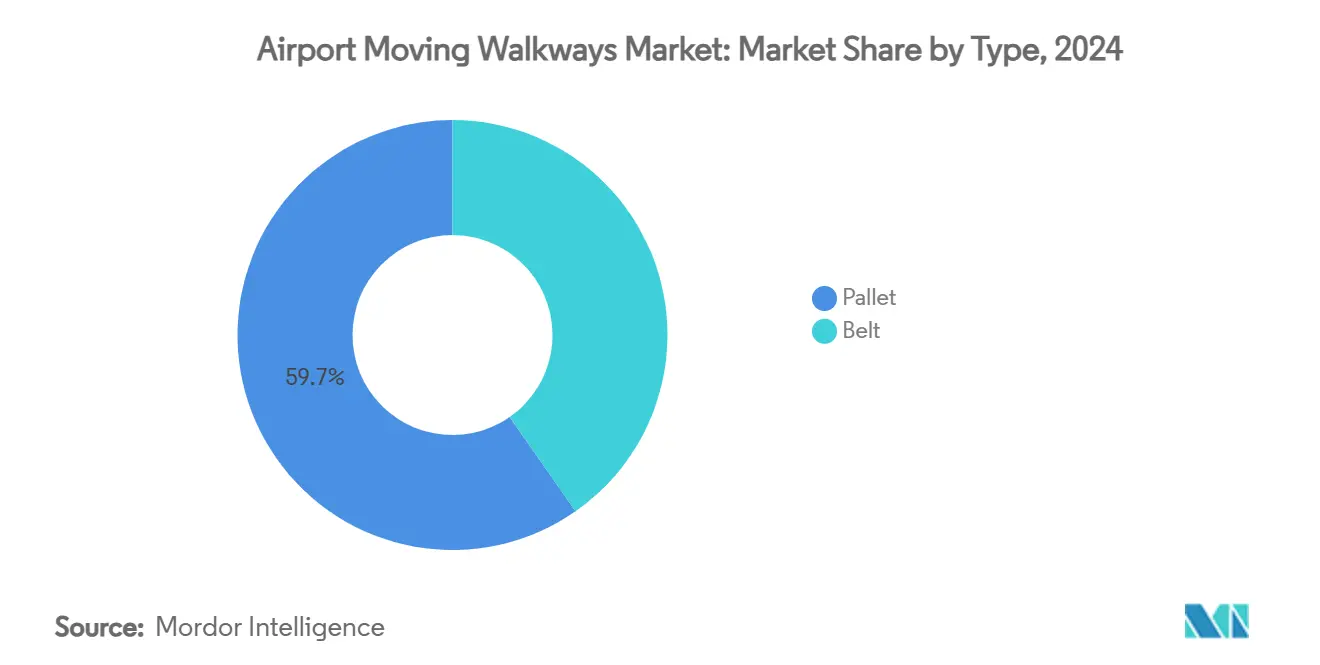
- By type, pallet systems led with 59.70% revenue share in 2024; belt systems are forecasted to grow 5.47% CAGR to 2030.
- By inclination angle, horizontal units secured 77.10% of the airport moving walkways market share in 2024, whereas inclined variants are set to expand at a 5.32% CAGR through 2030.
- By speed, constant-speed platforms accounted for a 91.45% share of the airport moving walkways market in 2024, while acceleration-capable designs are rising at a 6.74% CAGR to 2030.
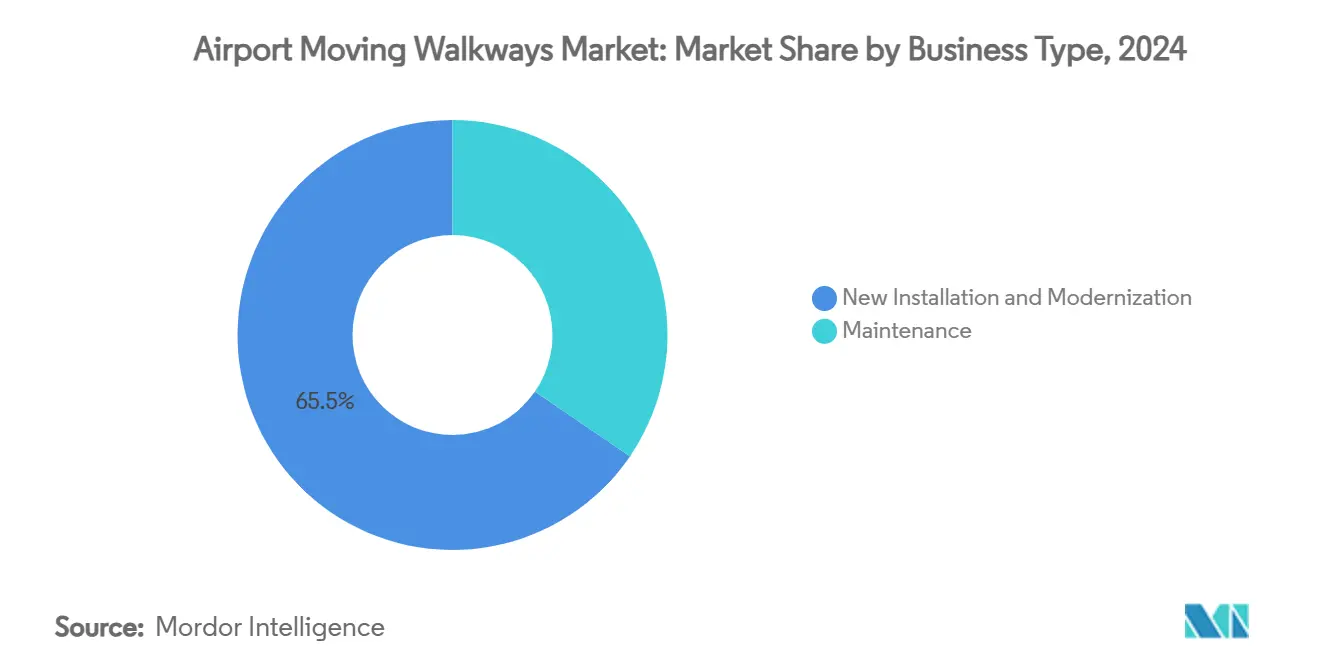
- By business type, new installation and modernization captured a 65.45% share of the airport moving walkways market in 2024; the maintenance stream is advancing at a 5.10% CAGR to 2030.
- By application, large airports controlled a 51.90% share in 2024; small airports are progressing at a 6.57% CAGR toward 2030.
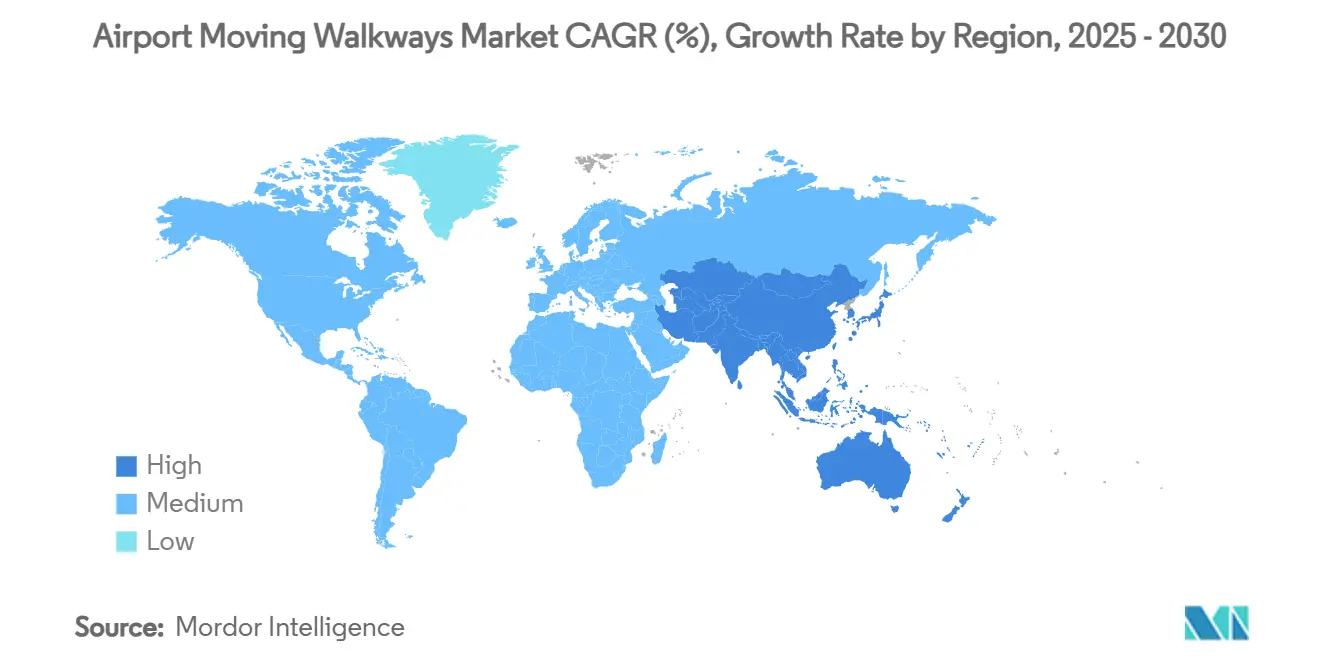
- By geography, Asia-Pacific accounted for 37.89% of 2024 sales and is forecasted to register the highest 5.52% CAGR through 2030.
Global Airport Moving Walkways Market Trends and Insights
Drivers Impact Analysis*
| Driver | (~) % Impact on CAGR Forecast | Geographic Relevance | Impact Timeline |
|---|---|---|---|
| Rapid recovery of air passenger volumes post-COVID | +1.0% | Global; strongest in Asia-Pacific and North America | Short term (≤ 2 years) |
| Surge in greenfield airport projects in Asia and Africa | +1.2% | Asia-Pacific core; spill-over to Africa | Medium term (2-4 years) |
| Mandates for inclusive mobility and ADA-style regulations | +0.8% | North America and EU; expanding worldwide | Long term (≥ 4 years) |
| Energy-efficient, IoT-enabled drive systems adoption | +0.9% | Global; led by North America and Europe | Medium term (2-4 years) |
| Demand for acceleration-capable walkways to shrink gate-to-gate times | +0.7% | Large hubs worldwide; concentrated in Asia-Pacific | Short term (≤ 2 years) |
| Retail-revenue optimization via people-flow analytics | +0.6% | Early adoption in North America and Europe | Medium term (2-4 years) |
| Source: Mordor Intelligence | |||
Rapid recovery of air passenger volumes post-COVID
International passenger throughput surpassed pre-pandemic peaks in early-2025 as global enplanements hit 21.49 million in January, 4.6% above prior-year levels. Robust traffic growth pushes terminals to raise pedestrian-handling capacity, driving procurement of moving walkways that can manage sustained peak flows. Airlines returned to collective profitability in late 2023, restoring confidence in long-range capital projects at hub airports. Asia-Pacific delivers the most pronounced uplift because new facilities coincide with vigorous traffic gains. Therefore, the airport moving walkways market benefits from volume expansion and operators’ urgency to limit gate delay risk during demand surges.
Surge in greenfield airport projects in Asia and Africa
Governments across India, Indonesia, Nigeria, and Kenya prioritize aviation capacity as an economic catalyst. India’s Noida International Airport alone entails an INR 10,056 crore (USD 1.2 billion) outlay and embeds pallet-type walkways in its baseline terminal design. Greenfield settings enable planners to integrate wide-span acceleration lanes and IoT cabling without retrofit hurdles. Procurement scales also attract tier-one OEMs that supply turnkey People-Flow suites, reinforcing regional supplier relationships and sparking follow-on contracts in secondary cities. Africa trails in absolute numbers yet mirrors the model as states view aviation connectivity as a tourism and trade accelerator.
Mandates for inclusive mobility and ADA-style regulations
Airports receiving US federal funds must now comply with FAA Circular 150/5360-14A, ensuring accessible routes and service-animal relief areas.[3]Source: Federal Aviation Administration, “AC 150/5360-14A,” faa.gov Comparable rules spread across Europe and Asia, where regulators embed universal-design norms into concession agreements. Moving walkways with wider pallets, low-incline zones, and slow-start controls are favored to meet wheelchair and elder-traveler needs. The compliance cost is sizable, yet operators recognize reputational and commercial benefits tied to barrier-free travel. Consequently, accessibility rules transform walkways from optional amenities into core passenger-handling infrastructure.
Energy-efficient, IoT-enabled drive systems adoption
Electricity costs and carbon pledges push airports toward high-efficiency motors, intermittent drives, and LED lighting retrofits that cut walkway energy use by up to 35%. Sensors stream vibration and load data to cloud dashboards, shifting maintenance crews from reactive repairs to predictive interventions. London Heathrow’s analytics platform illustrates how dynamic speed modulation trims idle energy draw while sustaining throughput. These savings bolster business cases for modernization even where capital budgets remain tight.
Restraints Impact Analysis*
| Restraint | (~) % Impact on CAGR Forecast | Geographic Relevance | Impact Timeline |
|---|---|---|---|
| High capex and lifecycle costs versus escalators | -0.6% | Global, particularly acute in cost-sensitive emerging markets | Long term (≥ 4 years) |
| Physical space trade-offs with commercial leasable area | -0.4% | Global, concentrated in land-constrained urban airports | Medium term (2-4 years) |
| Safety incidents driving stricter certification delays | -0.3% | Emerging and developing regions with limited technical depth | Short term (≤ 2 years) |
| Airline pushback on non-revenue infrastructure spend | -0.2% | EU and jurisdictions adopting ecodesign-style rules | Medium term (2-4 years) |
| Source: Mordor Intelligence | |||
High capex and lifecycle costs versus escalators
Acceleration-capable walkways can double procurement costs relative to fixed-speed escalators and demand extended pit construction plus heavier electrical runs. Beyond the purchase price, specialized maintenance talent and OEM-specific spare parts inflate the total cost of ownership. Funding pressures persist; the US GAO notes airport development needs that could top USD 32.5 billion, stretching operator balance sheets. Emerging-market authorities often opt for escalators or shuttle buses when budgets tighten, tempering walkway deployment prospects.
Physical space trade-offs with commercial leasable area
A 100-meter pallet system can displace up to 300 m² of potential retail footprint, challenging revenue managers who target high-yield concession density. Urban terminals like San Francisco International must juggle passenger comfort against finite land plots. While analytics show walkways can boost retail spend by guiding flows, the upfront forfeiture of leasable space remains a contentious planning variable until clear ROI metrics are established.
*Our forecasts treat driver/restraint impacts as directional, not additive. The impact forecasts reflect baseline growth, mix effects, and variable interactions.
Segment Analysis
By Type: Pallet Systems Sustain Leadership
Pallet formats captured a 59.70% slice of the airport moving walkways market in 2024, thanks to rugged decking that tolerates heavy baggage carts and meets strict accessibility slopes. Belt variants hold the remainder, yet face durability questions in 24/7 hub operations. Pallet units are on course for a 5.47% CAGR through 2030 as airports prioritize lifecycle resilience and energy-efficient modular drives. Several operators link pallet adoption to IoT retrofit ease, as sensors can be embedded between steel plates without compromising ride comfort.
Lifecycle metrics tip further in favor of pallet technology. Field studies show mean-time-between-service intervals rising once vibration analytics flag issues pre-emptively. These maintenance gains and broader warranties reinforce pallet supremacy even though belt platforms advertise marginally lower purchase prices. Consequently, pallet systems will likely widen their presence across new greenfield projects, anchoring the broader airport moving walkways market.


By Inclination Angle: Horizontal Walkways Dominate Footprints
Horizontal installations commanded a 77.10% share of the airport moving walkways market in 2024. The configuration aligns with universal design principles and eases luggage handling on standard concourse levels. Inclined walkways fulfill niche needs in multi-level hubs and metro-terminal interchanges but confront tighter safety-code thresholds. Projections signal a 5.32% CAGR for inclined units as space-constrained redevelopments, especially in Europe, embrace vertical conveyance to preserve retail frontage.
Passenger surveys rank horizontal decks higher on comfort and perceived safety, encouraging planners to extend walkways across pier spines rather than adopt mezzanine switches. Yet rising land values inside terminals push designers to stack functions vertically, creating opportunity pockets for inclined solutions. OEMs respond by standardizing anti-rollback brakes and regenerative drives to satisfy code committees without eroding operating margins.
By Speed: Constant-Speed Platforms Keep Majority hold
Constant-speed systems safeguarded a 91.45% share in 2024, reflecting decades of operational familiarity and broad technician skill bases. However, acceleration-capable designs are moving from pilot status toward mainstream tenders at a 6.74% CAGR. Amsterdam Schiphol’s trials confirm reductions in connection-time buffers that airlines translate to tighter scheduling and improved asset utilization.
Regulators currently study human-factor data to refine permissible acceleration-lane slopes and speed ceilings. As consensus coalesces, procurement specifications increasingly feature optional high-speed packages. Supply-chain maturation will cut component premiums, suggesting that constant-speed dominance may erode modestly over the forecast period, albeit remaining the bedrock of the airport moving walkways market.
By Business Type: New Installation and Modernization Drive Volume
New build and comprehensive retrofit programs captured 65.45% of 2024 revenues. Capital projects such as Chicago O’Hare’s Terminal 3 upgrade deploy full-suite moving walkways alongside architectural refreshes, making modernization a bundled procurement item. Maintenance-only contracts hold 34.55% yet grow steadily as long-life assets age beyond 20 years.
OEM strategy pivots strengthen this trend. KONE positions modernization services as a margin engine, targeting EBIT uplift to 13-14% by 2027. The dual-segment pattern ensures balanced revenue streams for suppliers and stable service-level agreements for airports that cannot afford unscheduled outages.

By Application: Large Hubs Lead, Smaller Fields Accelerate
Large airports generated 51.90% of 2024 spending on moving walkways, led by multibillion-dollar expansions at Dallas–Fort Worth, Istanbul, and Beijing. Such gateways require extended pier connectors and underground people-mover spines, creating scale benefits for multi-unit orders. Yet small-airport uptake logs the briskest 6.57% CAGR as regional governments view passenger experience parity with metropolis hubs as an economic differentiator.
Technology democratization underlies this diffusion. Standardized 100-meter modules with plug-and-play IoT boards lower commissioning hurdles for secondary airports. Financing mechanisms, including public-private partnerships, further dilute upfront outlays. As a result, the airport moving walkways market is set to broaden its base beyond flagship mega hub projects.
Geography Analysis
Asia-Pacific holds 37.89% of global revenue thanks to an unmatched slate of greenfield buildouts and traffic growth that ICAO expects to triple against 2022 baselines by 2027. India’s Noida International Airport exemplifies the scale with a first-phase 12 million-passenger capacity and embedded pallet networks. China adds multi-runway hubs under its 14th Five-Year Plan, while Indonesia and Vietnam commission regional fields to handle tourist inflows. The expected 5.52% CAGR through 2030 cements the region as the primary engine for the airport moving walkways market.
North America ranks second, propelled by the rehabilitation of 1960s-era terminals and federally backed accessibility mandates. Projects such as DFW’s Terminal F build and Tampa International’s shuttle-guideway overhaul elevate specification demand for high-durability pallet systems. US airports also pioneer sensor-rich platforms that tie into broader smart-building ecosystems, improving situational awareness for operations centres.
Europe maintains a mature yet dynamic market profile driven by energy-efficiency retrofits and rising low-cost-carrier penetration that boosts passenger churn. KONE’s Grand Paris Express contract, embedding 131 heavy-duty autowalks, validates the supplier's ability to leverage metro wins into airport opportunities. Middle East and Africa trail on absolute spend but register strong project pipelines tied to hub-airport visions in Riyadh, Doha, and Addis Ababa. Limited domestic manufacturing base there reinforces OEM export revenues and aftermarket service footholds.

Competitive Landscape
The airport moving walkways market is moderately consolidated, with KONE, Otis Worldwide, and TK Elevator through vertically integrated manufacturing and 24/7 service networks. High technical barriers, stringent safety codes, and the need for on-site service capacity shield incumbents from rapid displacement. Otis reports installations in more than 200 countries and leverages its Gen3 IoT platform to deepen maintenance lock-in.
Competition pivots around digital services rather than mechanical differentiation. Vendors bundle remote monitoring, predictive analytics, and carbon-footprint dashboards into long-term service agreements that stabilize revenue. KONE targets EBIT margins above 13% by 2027, driven by modernization demand and data-driven maintenance packages.
Niche challengers focus on acceleration-capable modules and AI-enhanced people-flow software layers. While technically compelling, these players confront capital intensity and certification hurdles inherent in air-side deployments. Consequently, strategic alliances emerge whereby startups supply software overlays to incumbent hardware bases, blending agility with compliance assurance. The next competitive frontier will revolve around holistic passenger-journey platforms that fuse walkways, elevators, and dynamic signage into unified command-and-control suites.
Airport Moving Walkways Industry Leaders
KONE Corporation
TK Elevator GmbH
Otis Worldwide Corporation
Schindler Group
Mitsubishi Electric Corporation
- *Disclaimer: Major Players sorted in no particular order

Recent Industry Developments
- June 2025: TK Elevator was selected as the prime contractor for vertical mobility solutions at Terminal 3B of Chongqing Jiangbei International Airport (CKG). TKE supplied 102 mobility units for the fourth runway, including passenger, panoramic, and heavy-duty freight elevators.
- November 2024: KONE was awarded a contract to modernize King Fahd International Airport (KFIA) in Saudi Arabia. Managed by Dammam Airports Company (DACO), the project includes installing and upgrading elevators, escalators, and auto walks to enhance passenger flow, benefiting over 11.4 million annual travelers. Completion is expected by Q4 2025.


Global Airport Moving Walkways Market Report Scope
| Belt |
| Pallet |
| Horizontal |
| Inclined |
| Constant-speed |
| Acceleration-capable |
| New Installation and Modernization |
| Maintenance |
| Large |
| Medium |
| Small |
| North America | United States | |
| Canada | ||
| Mexico | ||
| Europe | United Kingdom | |
| France | ||
| Germany | ||
| Italy | ||
| Russia | ||
| Rest of Europe | ||
| Asia-Pacific | China | |
| India | ||
| Japan | ||
| South Korea | ||
| Australia | ||
| Rest of Asia-Pacific | ||
| South America | Brazil | |
| Rest of South America | ||
| Middle East and Africa | Middle East | Saudi Arabia |
| United Arab Emirates | ||
| Turkey | ||
| Rest of Middle East | ||
| Africa | South Africa | |
| Rest of Africa | ||
| By Type | Belt | ||
| Pallet | |||
| By Inclination Angle | Horizontal | ||
| Inclined | |||
| By Speed | Constant-speed | ||
| Acceleration-capable | |||
| By Business Type | New Installation and Modernization | ||
| Maintenance | |||
| By Airport Size | Large | ||
| Medium | |||
| Small | |||
| By Geography | North America | United States | |
| Canada | |||
| Mexico | |||
| Europe | United Kingdom | ||
| France | |||
| Germany | |||
| Italy | |||
| Russia | |||
| Rest of Europe | |||
| Asia-Pacific | China | ||
| India | |||
| Japan | |||
| South Korea | |||
| Australia | |||
| Rest of Asia-Pacific | |||
| South America | Brazil | ||
| Rest of South America | |||
| Middle East and Africa | Middle East | Saudi Arabia | |
| United Arab Emirates | |||
| Turkey | |||
| Rest of Middle East | |||
| Africa | South Africa | ||
| Rest of Africa | |||


Key Questions Answered in the Report
What is the projected value of the Airport Moving Walkways Systems market by 2030?
The market is forecasted to reach USD 4.13 billion by 2030 on a 4.09% CAGR trajectory.
Which region currently commands the largest share of spending on moving walkways?
Asia-Pacific leads with 37.89% share in 2024, driven by a wave of greenfield airport projects.
Which product type holds the biggest slice of revenue?
Pallet-type systems dominated with 59.70% share in 2024, benefiting from durability and ADA compliance.
Why are acceleration-capable walkways gaining popularity at major hubs?
They cut gate-to-gate transit times by operating up to 15 km/h, improving connections and passenger satisfaction despite higher upfront cost.
How quickly is the small-airport application segment expected to expand?
Small airports register the fastest growth at 6.57% CAGR through 2030 as regional facilities modernize.
Who are the key suppliers shaping the competitive landscape?
KONE Corporation, Otis Worldwide Corporation, and TK Elevator GmbH together hold more than 40% global share, supported by integrated service networks and IoT-enabled platforms.
Page last updated on:


