Airport Information System Market Size and Share
Market Overview
| Study Period | 2020 - 2031 |
|---|---|
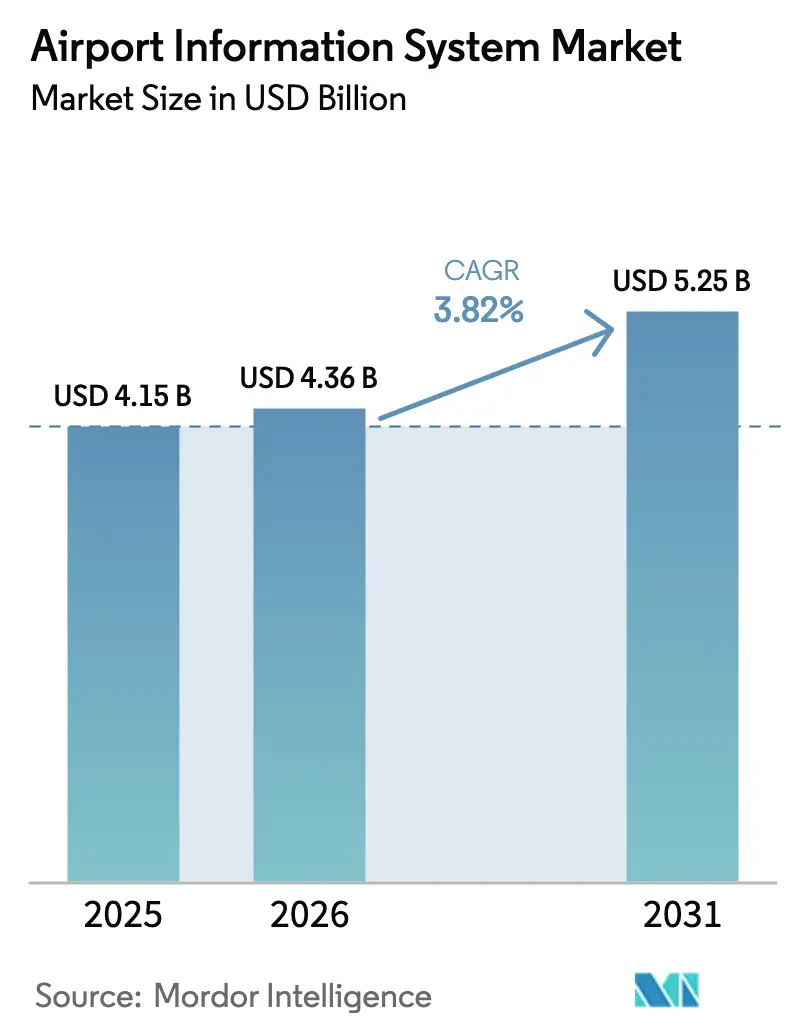
| Market Size (2026) | USD 4.36 Billion |
| Market Size (2031) | USD 5.25 Billion |
| Growth Rate (2026 - 2031) | 3.82% CAGR |
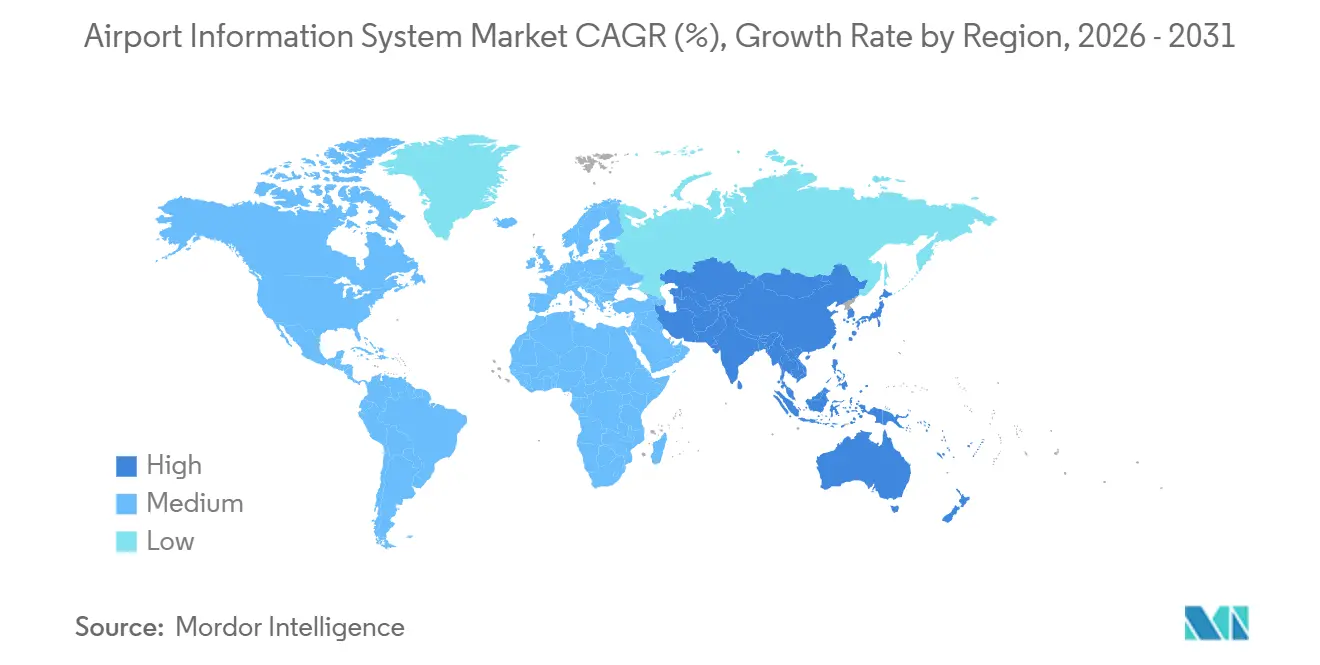
| Fastest Growing Market | Asia Pacific |
| Largest Market | North America |
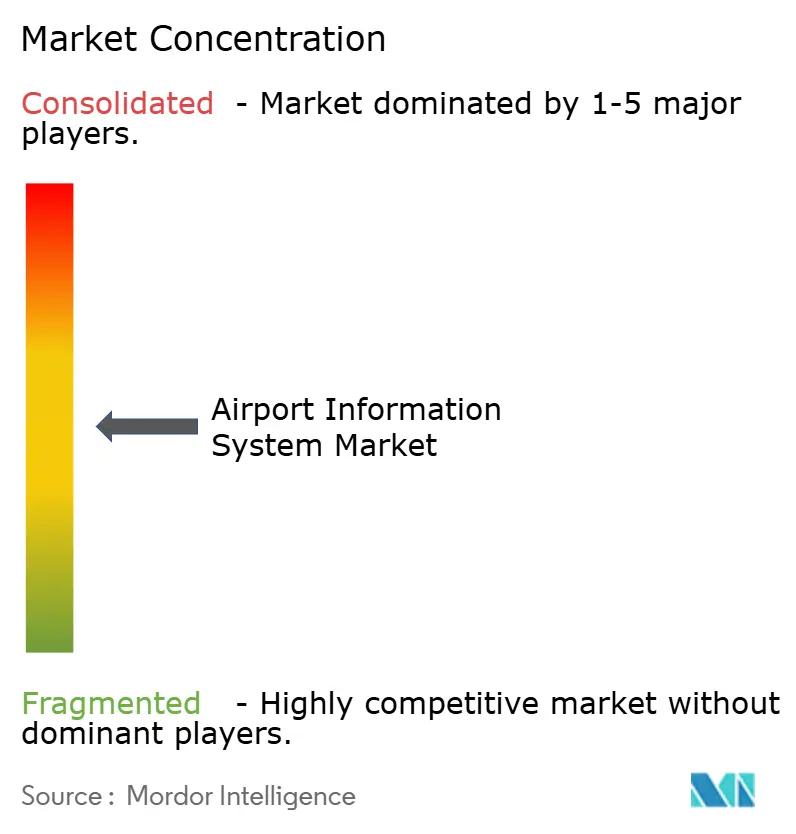
| Market Concentration | Medium |
Major Players
*Disclaimer: Major Players sorted in no particular order Image © Mordor Intelligence. Reuse requires attribution under CC BY 4.0. |
|
Airport Information System Market Analysis by Mordor Intelligence
The airport information system market size is expected to grow from USD 4.15 billion in 2025 to USD 4.36 billion in 2026 and is forecasted to reach USD 5.25 billion by 2031 at a 3.82% CAGR over 2026-2031. Growth is supported by a steady recovery in global passenger volumes, continued investments in terminal modernization, and increasing adoption of biometric self-service technologies. However, overall growth remains moderate, as many Class A airports continue to rely on capital-intensive, on-premises architectures with 7-year refresh cycles.
Security applications account for the largest share of spending, driven by regulatory mandates for facial-recognition checks at exit gates. Terminal-side systems are also benefiting from airlines transitioning to common-use departure control systems (DCS), which distribute hardware costs across multiple carriers. Cloud-native deployments are the fastest-growing segment, with Class C airports opting for flexible subscription-based pricing models rather than making significant upfront investments.
Competitive dynamics are intensifying as established suite vendors unbundle their offerings into API-first microservices, creating opportunities for niche players specializing in areas such as resource optimization, predictive maintenance, and sustainability analytics.
Key Report Takeaways
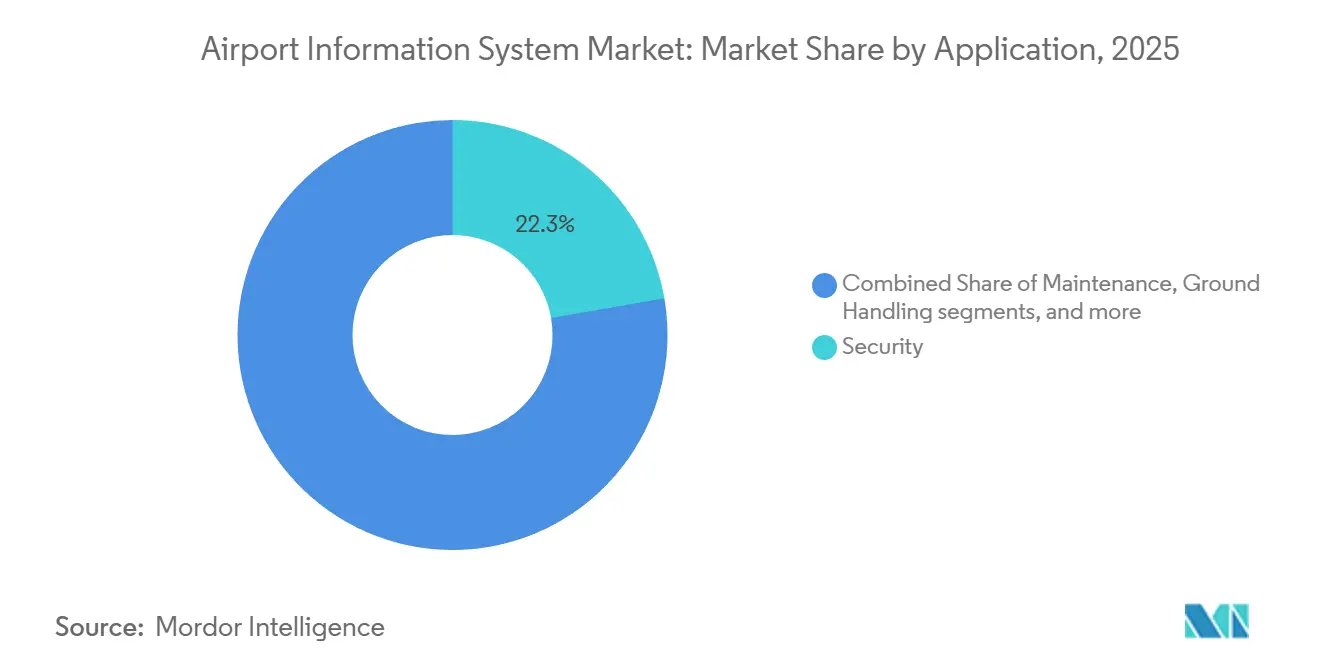
- By application, the security segment accounted for 22.27% of revenue in 2025 and is projected to grow at a CAGR of 5.83% through 2031.
- By system area, terminal-side platforms contributed 53.78% of revenue in 2025, while airside solutions are expected to achieve the highest CAGR of 6.22% during the forecast period.
- By deployment mode, on-premise solutions held 53.15% of the airport information system market share in 2025, whereas cloud/SaaS solutions are anticipated to grow at a CAGR of 7.98% through 2031.
- By airport size, Class C facilities represented 18% of spending in 2025 and are projected to record the highest CAGR of 5.13%, surpassing Class A hubs, which are expected to grow at a CAGR of 3.60%.
- By geography, North America led the market with 29.85% of revenue in 2025, while Asia-Pacific is forecasted to grow at the fastest CAGR of 5.31% through 2031.
Note: Market size and forecast figures in this report are generated using Mordor Intelligence’s proprietary estimation framework, updated with the latest available data and insights as of January 2026.
Global Airport Information System Market Trends and Insights
Drivers Impact Analysis*
| Driver | (%) Impact on CAGR Forecast | Geographic Relevance | Impact Timeline |
|---|---|---|---|
| Sustained recovery and growth in global air passenger traffic | +1.2% | Global; APAC spearheads recovery | Medium term (2–4 years) |
| Accelerated airport modernization and expansion programs | +0.9% | APAC and MEA | Long term (≥ 4 years) |
| Passenger-experience focus driving self-service and biometrics | +0.8% | North America and EU first adopters | Short term (≤ 2 years) |
| Deployment of 5G/private networks enabling real-time analytics | +0.6% | North America and APAC | Medium term (2–4 years) |
| Airport Collaborative Decision-Making (A-CDM) adoption surge | +0.5% | Europe leads; APAC and North America follow | Medium term (2–4 years) |
| Health-driven zero-touch processing mandates | +0.4% | Global regulatory push | Short term (≤ 2 years) |
| Source: Mordor Intelligence | |||
Sustained Recovery in Global Air Passenger Traffic
Passenger kilometers surpassed 2019 levels in Q1 2024, with IATA reporting October 2025 traffic as 6.6% higher than the previous year, indicating a sustained recovery in demand. The increasing traffic volumes have highlighted pre-pandemic capacity constraints at major hubs, driving IT investments toward platforms that enhance throughput without requiring additional physical gates. The Asia-Pacific region's 5.31% CAGR reflects the rapid growth of low-cost carriers, which favor common-use infrastructure to reduce turnaround times. Biometric single-token pilots have reduced processing times by 40%, increasing gate capacity and prompting airports to reconfigure retail spaces to accommodate higher-yield concessions. Airlines consolidating slots at mega-hubs are concentrating spending in these locations, while secondary cities in India, China, and the Gulf are bypassing traditional systems by adopting cloud-native Airport Operational Database (AODB) solutions from the outset.
Accelerated Airport Modernization and Expansion Programs
The US Bipartisan Infrastructure Law allocates USD 25 billion for airport upgrades, including USD 5 billion specifically for terminal IT, driving a surge in procurement activities at regional airports. In parallel, Saudi Arabia's King Salman International Airport aims to accommodate 185 million passengers by 2030, incorporating AI-driven slot optimization during its design phase.[1]BBC News. "Seattle-Tacoma Airport Ransomware Attack Recovery." bbc.com In Europe, grant funding is tied to carbon-reporting capabilities, compelling operators to integrate energy-monitoring systems into AODB workflows. These initiatives collectively extend the project pipeline and broaden demand beyond traditional Class A buyers. Vendors offering pre-configured ESG dashboards or digital twin simulators gain a competitive edge as authorities prioritize off-the-shelf compliance solutions to reduce consulting expenses.
Passenger-Experience Focus on Self-Service and Biometrics
The Transportation Security Administration (TSA) deployed 2,054 CAT-2 units across 231 US airports by mid-2024, reducing the average screening time by 30 seconds. This efficiency allowed airports handling 100,000 daily passengers to reallocate approximately 104 full-time officers. The freed-up space in airports has been repurposed into boutique stores, contributing to an 18% increase in non-aeronautical revenue in Europe during 2024. Additionally, the use of common-use kiosks has diminished airline brand touchpoints, shifting competitive efforts toward mobile applications that offer personalized services. Biometric exit checks, which have already processed 807 million travelers for US Customs and Border Protection (CBP), have reduced impostor incidents and enhanced border compliance. As biometric technology becomes more widely adopted, refusal queues have decreased, and operators have improved staff scheduling using real-time occupancy dashboards.
Airport Collaborative Decision-Making (A-CDM) Adoption Surge
In 2025, Australia aligned with Europe’s 34 compliant hubs, enabling shared turnaround milestones among airlines, ground handlers, and air traffic control (ATC). Early identification of delays allows carriers to re-route aircraft and adjust crew schedules, minimizing cascading disruptions. However, data governance remains a challenge, as airlines are reluctant to disclose proprietary operational metrics. Airports that appoint neutral data trustees experience higher participation rates and improved slot adherence, demonstrating that governance design can be as impactful as technology in delivering return on investment (ROI). Vendors offering modular interfaces that anonymize data feeds without compromising accuracy are gaining acceptance at privacy-focused European airports.
Restraints Impact Analysis*
| Restraint | (%) Impact on CAGR Forecast | Geographic Relevance | Impact Timeline |
|---|---|---|---|
| Significant capital investment and integration complexity | −0.7% | Global; heavier on smaller airports | Long term (≥ 4 years) |
| Rising concerns over cybersecurity vulnerabilities and data privacy | −0.5% | EU and North America with strict rules | Medium term (2–4 years) |
| Proprietary legacy systems limiting cross-platform interoperability | −0.4% | North America and Europe | Long term (≥ 4 years) |
| Shortage of advanced analytics and IT expertise among airport operators | −0.3% | Developing regions | Medium term (2–4 years) |
| Source: Mordor Intelligence | |||
Significant Capital Investment and Integration Complexity
Large airport hubs typically allocate approximately USD 50 million to major IT overhauls, with migration timelines of 24 to 36 months to ensure systems remain operational during the transition. Additionally, hardware refresh cycles, which occur every 7 years, contribute to the financial burden by turning capital projects into ongoing operating expenses. Smaller airports face significantly higher per-passenger costs compared to Class A facilities, but they often lack equivalent revenue streams. As a result, they frequently adopt SaaS solutions that simplify complexity through per-transaction fees. Integration timelines further discourage some public-sector owners from approving modernization projects, even when return-on-investment (ROI) models are favorable.
Rising Concerns Over Cybersecurity Vulnerabilities and Data Privacy
In August 2024, a ransomware attack at Seattle-Tacoma International Airport disrupted baggage handling for three days, resulting in USD 12 million in recovery costs and lost revenue.[2]International Civil Aviation Organization (ICAO). "Global Air Traffic Recovery Update Q1 2024." icao.int Similarly, Delta Airlines experienced a CrowdStrike-related outage in July 2024, grounding 7,000 flights and highlighting how tightly integrated systems can exacerbate the impact of misconfigurations. European operators face additional challenges under the GDPR, which mandates anonymizing passenger data within 72 hours, in conflict with airlines' preference for 90-day data retention for revenue analytics. To mitigate risks, airports are increasingly implementing network segmentation and air-gapped operational systems, which raise project budgets by 10–15% but effectively reduce the potential impact of breaches.
*Our forecasts treat driver/restraint impacts as directional, not additive. The impact forecasts reflect baseline growth, mix effects, and variable interactions.
Segment Analysis
By Application: Security Commands Spend and Growth
Security applications accounted for 22.27% of revenue in 2025 and are projected to grow at 5.83% through 2031, surpassing all other application categories. The growth is driven by biometric exit verification, integrated into existing access-control systems and mandated by the US CBP for all international departures by 2026. By mid-2025, CBP systems processed 807 million travelers and detected 2,229 impostors, demonstrating operational maturity and reinforcing the business case for facial-recognition gates. Ground handling applications, which include baggage tracking and ramp management, account for 18% of spending but grow at a slower rate of 3.1%. This is due to the commoditization of RFID tag readers and airlines' reluctance to share real-time bag location data with competitors.
Finance and operations applications, such as revenue-management interfaces and slot accounting, account for 16% of the airport information system market. However, they face margin pressures from cloud-native ERP systems offered by Oracle and SAP, which are challenging aviation-specific vendors. Passenger information systems, including Flight Information Display Systems (FIDS) and mobile app backends, hold a 19% market share and are growing at 4.2%. This growth is supported by the transition from static displays to dynamic content delivery via Bluetooth beacons. Maintenance applications, the smallest segment at 15%, are undergoing disruption as predictive analytics shift from niche add-ons to core functionalities within AODB platforms. This evolution compresses standalone maintenance software revenue while embedding these capabilities into broader systems.
The US TSA operates 2,054 CAT-2 units across 231 airports, processing approximately 250 passengers per hour, which is double the throughput of manual checks. These systems identify discrepancies that human screeners miss in 8% of cases. Security checkpoints generate timestamped flow records that, when integrated with gate-assignment data, enable terminal operators to dynamically allocate retail staff and adjust concession hours. This capability increased non-aeronautical revenue per passenger by 12% at major European hubs in 2024. Additionally, the European Union's (EU's) Entry/Exit System, which requires biometric registration for non-EU nationals at all Schengen borders by the end of 2024, has prompted airports to upgrade their DCS platforms to support new data-exchange protocols. This compliance-driven refresh cycle is expected to sustain the growth of security applications through 2028.


By System Area: Terminal-Side Platforms Dominate Airside Stacks
Terminal-side systems accounted for 53.78% of revenue in 2025 and are projected to grow at 6.22% through 2031. This dominance reflects the concentration of passenger-facing touchpoints in departure and arrival halls. In contrast, airside systems, which include FIDS, AODB, Resource Management Systems (RMS), and Air Traffic Management (ATM) integration, held the remaining 46.22% of revenue and are expected to grow at a slower rate of 3.1%. This disparity is attributed to the maturity of flight information displays and the slower refresh cycles of operational databases.
Within terminal-side systems, DCS platforms are transitioning from airline-owned infrastructure to airport-provided common-use environments. This shift allows hardware costs to be distributed across multiple carriers and facilitates dynamic gate reassignment. For example, SITA's Flex platform, deployed at over 500 airports, illustrates this model. A single kiosk array serves 15 to 20 airlines, reducing per-carrier capital expenditures by 60% while increasing gate utilization by 18%. Additionally, Common Use Passenger Processing Systems (CUPPS) and Common Use Terminal Equipment (CUTE) interfaces are converging toward cloud-native APIs. This transition eliminates the need for on-site servers, leading to an annual reduction of 8–10% in terminal-side hardware revenue, even as software subscription revenues increase. Self-service kiosks and digital signage are the fastest-growing terminal-side subsegment, with a 7.40% CAGR. These technologies are driven by the dual objectives of reducing labor costs and enhancing the passenger experience.
Airports are increasingly replacing static flight information displays with 4K LED panels that can deliver personalized gate directions via QR code scanning. This innovation reduced misconnection rates by 14% at Amsterdam Schiphol in 2024. However, airside systems face different growth dynamics. FIDS technology has reached a plateau due to the long lifespan of LED panels (10 to 12 years) and the standardized nature of information architecture, which limits differentiation opportunities.
Meanwhile, AODB platforms, which serve as the operational backbone linking flight schedules to resource allocation, are incorporating machine-learning modules. These modules can predict turnaround delays 45 minutes earlier than traditional rule-based systems. However, the adoption of these advanced features remains concentrated at Class A airports, which typically have dedicated data science teams. RMS platforms that manage gate, stand, and ground service equipment allocation present a significant growth opportunity. Currently, fewer than 30% of airports utilize automated resource optimization, relying instead on manual dispatching. This results in 20–25% of assets remaining idle during peak hours, highlighting the potential for efficiency improvements through automation.
By Deployment Mode: Cloud Gains Yet On-Premise Persists
On-premises deployments accounted for 53.15% of spending in 2025, while the cloud/SaaS segment was the only segment to demonstrate near-double-digit growth at 7.98%. This divergence is influenced by airport size and data-sovereignty priorities. Class A airports, particularly in North America and Europe, prefer on-premise architectures to maintain control over passenger data and mitigate latency risks during network outages. Additionally, hosting software internally provides operators with leverage during vendor negotiations, enabling them to credibly threaten provider switches, which can result in a 15–20% reduction in maintenance fees.
Cloud deployments are more attractive to Class C and D airports, which often lack in-house IT staff and favor predictable per-transaction pricing over significant capital expenditures. For instance, Amadeus's Altéa Suite, offered as a SaaS subscription, charges USD 0.08 to USD 0.12 per passenger processed. This model aligns costs with revenue, eliminating the need for upfront hardware investments. Cloud adoption is accelerating in the Asia-Pacific region, where greenfield airports are integrating SaaS platforms from the outset. Navi Mumbai International Airport in India, set to open in 2025, has chosen cloud-native AODB and DCS systems that scale elastically with passenger growth, avoiding the over-provisioning issues that burden legacy hubs with underutilized server capacity.
Security concerns continue to pose challenges. GDPR's data-residency requirements mandate that EU airports use cloud providers with in-region data centers, which fragments vendor selection and increases costs by 10–15% compared to global hyperscale platforms. The Middle East offers a hybrid approach: the Dubai International Airport operates a private cloud that integrates data across its two terminals and the under-construction Al Maktoum International Airport. This approach combines the scalability of cloud architecture with the control of on-premise hosting. Such hybrid models are likely to gain popularity as airports aim to future-proof their infrastructure while retaining operational autonomy from hyperscale vendors.

By Airport Size: Class C Facilities Outpace Major Hubs
Class A airports, which handle over 25 million passengers annually, accounted for 39.87% of investments in 2025. However, Class C airports, serving 2.5 million to 10 million passengers, are projected to grow at a faster rate of 5.13%, surpassing the growth of larger hubs. This trend is attributed to the adoption of turnkey SaaS platforms in secondary cities, which eliminate the integration challenges associated with legacy infrastructure. Class B airports, handling 10 million to 25 million passengers, hold a 28% market share and are expected to grow at 4.1%. Meanwhile, Class D airports, serving fewer than 2.5 million passengers, represent 12% of the market and are projected to grow at 3.8%, constrained by limited budgets and the lack of economies of scale.
India's Noida International Airport, which aims to handle 12 million passengers upon opening, highlights the growth potential of Class C airports. By implementing Siemens' cloud-based baggage-handling system and NEC's biometric boarding platform, the airport avoids the middleware layers that typically extend integration timelines by 18 to 24 months at established hubs, underscoring the advantages of greenfield projects in secondary cities.
Class A airports face the "innovator's dilemma." Their existing on-premise systems generate sufficient revenue to justify incremental upgrades. Still, the cumulative cost of maintaining legacy interfaces often exceeds the total IT budget of a greenfield Class C facility. This creates a competitive divide in the market.
The competitive landscape is increasingly bifurcated. Vendors such as SITA and Amadeus maintain dominance at major hubs through long-term service contracts and high switching costs. In contrast, agile SaaS providers like Vision Box and Materna IPS are capturing a significant share at secondary airports, where deployment speed is prioritized over extensive customization.
Geography Analysis
North America accounted for 29.85% of revenue in 2025, supported by the FAA's USD 25 billion allocation under the Bipartisan Infrastructure Law and the presence of major Class A hubs such as Atlanta, Dallas, Chicago, and Los Angeles. These hubs drive per-airport IT expenditures exceeding USD 100 million. In contrast, Asia-Pacific is projected to lead growth at a rate of 5.31%, driven by significant projects such as China's Beijing Daxing expansion, India's Navi Mumbai and Noida airports, and the Middle East's King Salman International Airport in Riyadh, which is designed to accommodate 185 million passengers annually by 2030. Europe captures 26% of spending and grows at 3.90%, influenced by the EU's sustainability mandates and the maturity of A-CDM networks, which limit opportunities for transformative innovation.
Favorable demographic trends and robust policy support are bolstering growth in the Asia-Pacific region. China's Civil Aviation Administration has allocated USD 18 billion for airport digitalization between 2024 and 2026, with a focus on AODB and A-CDM deployments in tier-2 cities to alleviate congestion at major hubs, such as Beijing and Shanghai. Similarly, India's Airports Authority has announced USD 12 billion in infrastructure investments through 2028, with 40% dedicated to IT systems for new and expanded facilities. This shift in focus has strategic implications for vendors, as companies traditionally targeting North American and European markets are forming local partnerships in the Asia-Pacific region to align with procurement preferences that favor domestic suppliers. For instance, NEC's facial-recognition systems, implemented at Tokyo Narita and Osaka Kansai airports, leverage the company's local expertise to secure design-build contracts that are less accessible to foreign competitors.
Europe's growth trajectory is shaped by its regulatory framework. GDPR's data-residency and consent requirements extend biometric-system deployment timelines by 6 to 9 months as airports negotiate data-processing agreements with airlines and border authorities. Additionally, the EU's Entry/Exit System, which mandates biometric registration for non-EU nationals, has driven airports to upgrade DCS platforms to meet new compliance requirements. This compliance-driven refresh cycle sustained investments in 2024 and 2025 but is expected to taper by 2027 as the rollout concludes.
The Middle East's hub-and-spoke model focuses IT spending on a few large-scale airports. For example, Dubai's DXB, which handled 87 million passengers in 2024, operates a private cloud that integrates data across terminals and connects with Emirates' reservation system. This high level of customization justifies its USD 200 million IT budget, reflecting the region's emphasis on centralized, large-scale infrastructure investments.

Competitive Landscape
The airport information system market is moderately fragmented, with the top five vendors, SITA, Amadeus, Honeywell, Thales, and Indra, collectively accounting for approximately 38% of the market share. This leaves significant opportunities for specialized players focusing on areas such as biometric gateways, resource optimization, and Airport Collaborative Decision Making (A-CDM) orchestration. The market has seen a strategic shift from monolithic suite sales to API-first microservices that integrate with existing systems, addressing concerns from procurement committees about the risks associated with complete system overhauls. For instance, SITA's Flex platform, implemented in over 500 airports, demonstrates this modular approach. Airlines can subscribe to individual modules, such as DCS, baggage tracking, and biometric solutions, reducing upfront capital expenditures while ensuring recurring revenue streams for the vendor.[3]SITA, “Heathrow extends network contract,” sita.aero
Amadeus's Altéa Suite, offered as a SaaS subscription, charges between USD 0.08 and USD 0.12 per passenger processed. This model aligns vendor revenue with airport throughput while eliminating the need for upfront hardware investments. The highest competitive intensity is observed in terminal-side systems, where the commoditization of self-service kiosks and digital signage has led to a 15–20% reduction in hardware margins since 2022. To maintain profitability, vendors are increasingly bundling software subscriptions and managed services with their hardware offerings. Additionally, untapped opportunities exist in predictive maintenance for airside assets, where data streams from AODB and RMS remain underutilized. Sustainability analytics is another growth area, driven by EU airports' compliance with Scope 3 emissions disclosure requirements under the Corporate Sustainability Reporting Directive.
Vision Box and NEC are integrating facial recognition modules into existing DCS platforms to create seamless travel corridors that connect curb-to-gate touchpoints and reduce passenger processing times by up to 40%. Similarly, ADB SAFEGATE's Advanced Visual Docking Guidance Systems, which utilize laser sensors to guide aircraft to precise gate positions, are being integrated with AODB platforms. This integration automates stand allocation and reduces aircraft turnaround times by 8-12 minutes. Emerging disruptors, such as INFORM's OptiFlight module, are leveraging reinforcement learning for gate assignment, achieving 12–15% improvements in resource utilization compared to traditional rule-based systems. These capabilities are particularly appealing to Class A airports looking to optimize resources and delay costly terminal expansions.
Airport Information System Industry Leaders
-
SITA N.V.
-
Amadeus IT Group, S.A.
-
THALES
-
Indra Sistemas, S.A.
-
Honeywell International Inc.
- *Disclaimer: Major Players sorted in no particular order

Recent Industry Developments
- January 2025: The Navi Mumbai International Airport awarded NEC Corporation a USD 45 million contract to implement an end-to-end biometric boarding system integrated with India's DigiYatra platform. The system aims to enable a curb-to-gate processing time of under 10 minutes.
- November 2024: SITA launched its Flex Cloud platform, representing a significant transition for airports from expensive on-premise systems to flexible, multi-tenant SaaS solutions. This shift reduced IT capital expenditures by approximately 55% and enabled dynamic scaling during peak periods. The platform streamlined passenger processing through cloud and mobile technologies across airports globally, including Bahrain, San Francisco, Sydney, and India. Additionally, it minimized hardware and maintenance requirements while enhancing sustainability by reducing environmental footprints.
- July 2024: SITA signed a five-year extension agreement with Heathrow Airport to maintain and enhance the airport's network infrastructure, including providing network, telecommunications, and connectivity services, as well as implementing new solutions for Heathrow's businesses.


Research Methodology Framework and Report Scope
Market Definitions and Key Coverage
According to Mordor Intelligence, our study defines the airport information systems market as global revenue from software and integrated hardware that gather, process, and display operational, passenger, and resource data across commercial airports, covering airside and terminal-side platforms.
Scope exclusion: stand-alone air-traffic-control radars, conveyor hardware, and generic enterprise IT suites that are not airport-specific remain outside this assessment.
Segmentation Overview
-
By Application
- Maintenance
- Ground Handling
- Finance and Operations
- Security
- Passenger Information
-
By System Area
-
Airside Systems
- Flight Information Display Systems (FIDS)
- Airport Operations Database (AODB)
- Resource Management Systems (RMS)
- Air Traffic Management (ATM) Integration
-
Terminal-Side Systems
- Departure Control Systems (DCS)
- Common-Use Passenger Processing (CUPPS/CUTE)
- Self-Service Kiosks and Digital Signage
-
Airside Systems
-
By Deployment Mode
- On-premise
- Cloud/SaaS
-
By Airport Size
- Class A
- Class B
- Class C
- Class D
-
By Geography
-
North America
- United States
- Canada
- Mexico
-
Europe
- United Kingdom
- France
- Germany
- Italy
- Spain
- Rest of Europe
-
Asia-Pacific
- China
- India
- Japan
- South Korea
- Australia
- Rest of Asia-Pacific
-
South America
- Brazil
- Rest of South America
-
Middle East and Africa
-
Middle East
- Saudi Arabia
- United Arab Emirates
- Rest of Middle East
-
Africa
- South Africa
- Rest of Africa
-
Middle East
-
North America
Detailed Research Methodology and Data Validation
Primary Research
We held in-depth interviews and structured surveys with airport CIOs, systems integrators, and aviation-technology advisors across North America, Europe, Asia-Pacific, and the Gulf. Their insights on adoption cycles, average selling prices, and cloud migration plans closed data gaps that surfaced during desk work.
Desk Research
We began by mapping capacity, flight-movement, and traffic datasets issued by bodies such as ICAO, ACI World, IATA, the FAA, and Eurocontrol. We then linked them to airport class sizes to size the addressable base. Company filings, investor decks, and tender notices revealed contract values and implementation timelines, which we indexed to regional cost curves.
Our analysts also pulled import codes for kiosks and FIDS from UN Comtrade, scanned peer-reviewed journals on airport digitalization, and consulted paid feeds like D&B Hoovers and Dow Jones Factiva for merger and funding signals.
The sources listed here illustrate the mix; many other open and subscription databases were reviewed during data collection, validation, and clarification.
Market-Sizing & Forecasting
We started with a top-down view built on passenger traffic and capital-expenditure pools, applied penetration ratios for AOCC suites, FIDS screens, and departure-control upgrades by airport class, and then corroborated results with bottom-up checks drawn from sampled ASP × volume data. Key variables include annual enplanements, IT spend per passenger, share of automated check-in kiosks, proportion of Class A hubs deploying AOCC, and regional labor multipliers. Multivariate regression, enriched by expert consensus and scenario analysis for traffic shocks, produces forecasts through 2030. Weighted proxies bridge gaps for smaller airports.
Data Validation & Update Cycle
Outputs pass anomaly checks against independent spend trackers before a senior analyst signs off.
Reports refresh every twelve months, with interim updates triggered when events such as pandemic waves or large greenfield projects materially alter assumptions.
Why Mordor's Airport Information Systems Baseline Commands Reliability
Published figures often diverge because firms apply different scopes, driver sets, and refresh cadences. Our disciplined variable calibration and annual update rhythm give decision-makers a steady reference point.
Key gap drivers include whether cargo systems are bundled, how mixed-class airports are treated, and if regional cost curves are adjusted for currency swings.
Benchmark comparison
| Market Size | Anonymized source | Primary gap driver |
|---|---|---|
| USD 4.20 B (2025) | Mordor Intelligence | |
| USD 4.24 B (2024) | Global Consultancy A | Bundles cargo IT and counts Class E fields |
| USD 3.54 B (2024) | Industry Association B | Uses one global ASP and omits cloud fees |
| USD 4.70 B (2024) | Research Boutique C | Assumes uniform passenger growth, no shock scenarios |
These contrasts show that Mordor's balanced mix of real traffic data, airport-level deployment evidence, and price verification yields a transparent, repeatable baseline that clients trust for planning.


Key Questions Answered in the Report
What is driving the faster growth of cloud/SaaS deployments compared to on-premise systems?
Lower upfront cost, pay-per-passenger pricing, greenfield projects in Asia-Pacific, and vendor-managed cybersecurity push cloud/SaaS to a 7.98% CAGR.
Why do Class C airports exhibit faster growth than Class A hubs despite handling fewer passengers?
Turnkey SaaS lets Class C sites skip 18–24-month integrations and hefty middleware fees, lifting their CAGR to 5.13% versus 3.6% for Class A.
How are cybersecurity incidents reshaping procurement priorities?
High-profile ransomware and outage losses make air-gapped networks and built-in incident response mandatory, adding 10–15% to project budgets.
What explains the dominance of terminal-side systems over airside platforms in revenue share?
Passenger touchpoints refresh every 5–7 years, driving spend, while airside FIDS and AODB age 10-plus years and face commoditization.
How is the EU's Entry/Exit System mandate influencing biometric-system deployments?
Compliance forces DCS upgrades and large kiosk orders but raises costs 10–15% due to EU data-residency rules and longer procurement cycles.
What white-space opportunities exist for new entrants?
Predictive maintenance, Scope 3 emissions analytics, and ultra-low-cost SaaS for Class D airports remain largely untapped.
Page last updated on:


