Market Overview
| Study Period | 2020 - 2031 |
|---|---|
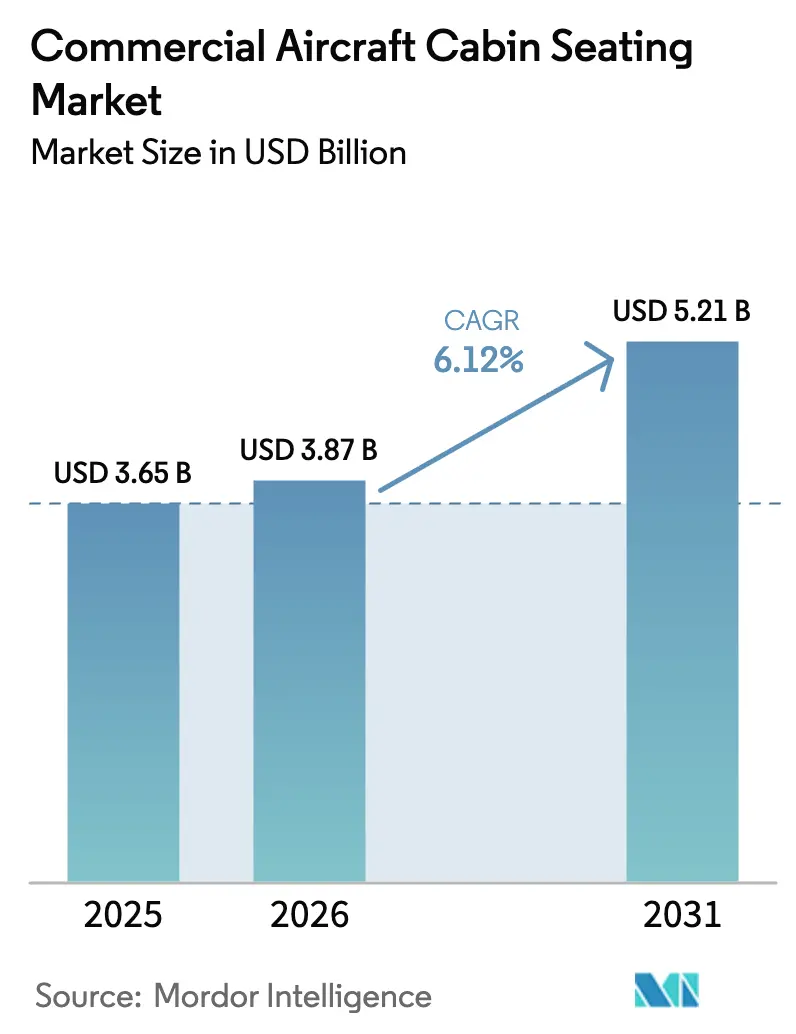
| Market Size (2026) | USD 3.87 Billion |
| Market Size (2031) | USD 5.21 Billion |
| Growth Rate (2026 - 2031) | 6.12% CAGR |
| Fastest Growing Market | Asia Pacific |
| Largest Market | Asia-Pacific |
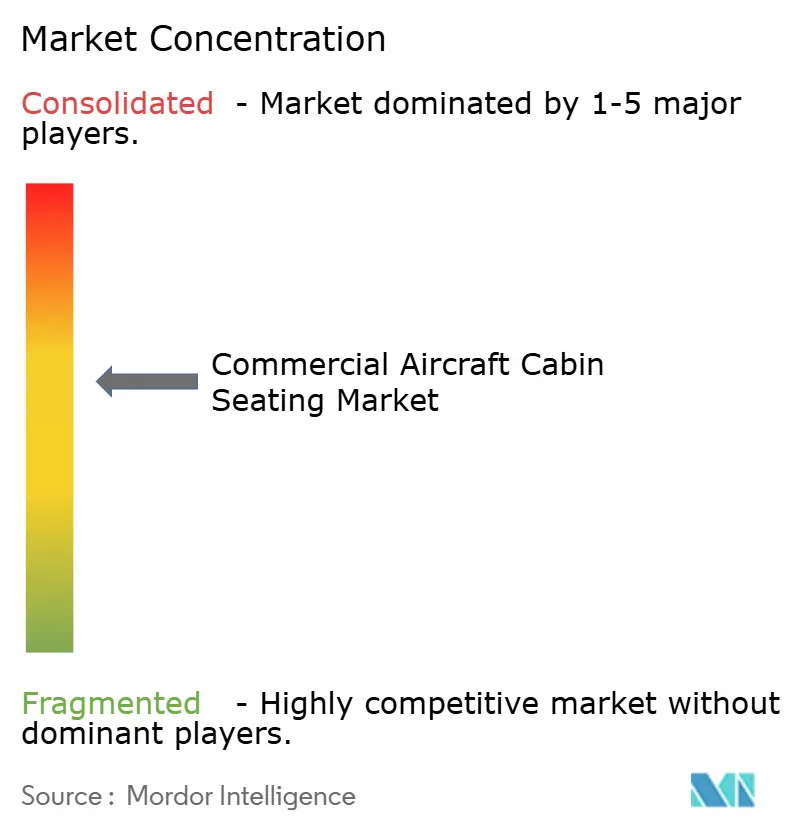
| Market Concentration | Medium |
Major Players *Disclaimer: Major Players sorted in no particular order Image © Mordor Intelligence. Reuse requires attribution under CC BY 4.0. | |
Commercial Aircraft Cabin Seating Market Analysis by Mordor Intelligence
The commercial aircraft cabin seating market size is expected to grow from USD 3.65 billion in 2025 to USD 3.87 billion in 2026 and is forecast to reach USD 5.21 billion by 2031 at 6.12% CAGR over 2026-2031. Airlines view seating as both a revenue lever and a brand differentiator, prompting steady investment even when broader aviation cycles soften. Asia-Pacific’s appetite for new air travel, the push to densify narrow-body cabins, and accelerated fleet renewal programs combine to expand the commercial aircraft cabin seating market at a rate faster than pre-pandemic baselines. Operators now treat premium-economy and suite products as profit centers, while weight-saving composites underpin fuel-burn targets aligned with net-zero commitments. Supply-chain hiccups, certification bottlenecks, and rising warranty costs temper momentum yet have not derailed the overall upward trajectory of the commercial aircraft cabin seating market.
Key Report Takeaways
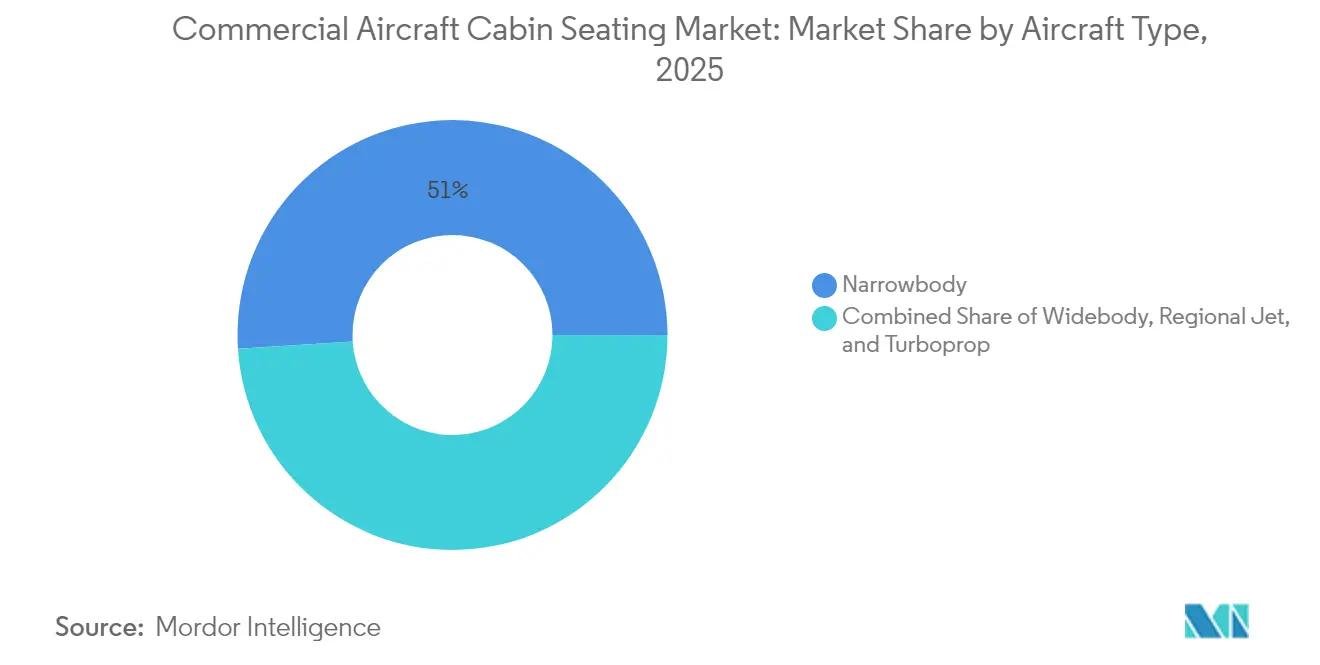
- By aircraft type, narrow-body platforms held 51.02% of the commercial aircraft cabin seating market share in 2025, while regional jets are projected to grow at a 6.21% CAGR through 2031.
- By cabin class, economy retained 47.68% revenue share in 2025; premium economy is advancing at 6.92% CAGR to 2031.
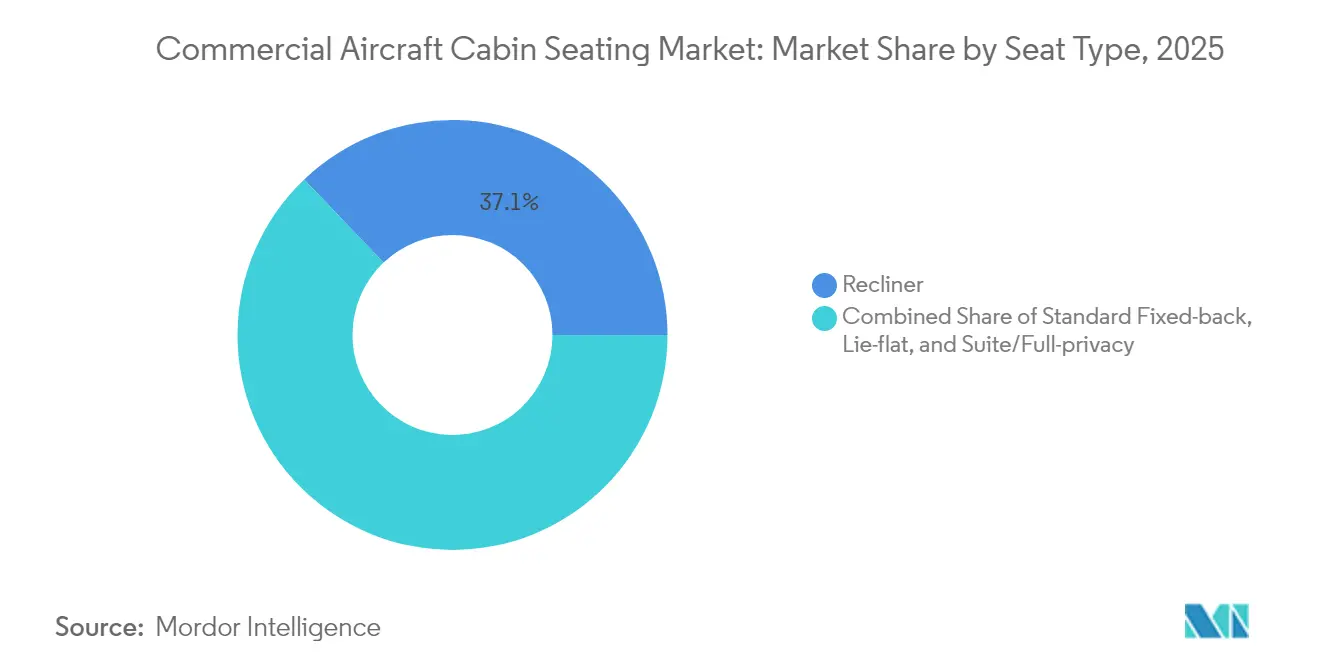
- By seat type, recliner products captured 37.12% of the commercial aircraft cabin seating market size in 2025; suite/full-privacy seating posts the highest 8.21% CAGR through 2031.
- By fitment, line-fit accounted for a 64.15% market share in 2025, whereas post-retrofit programs, projected to expand through these programs, are expected to grow at a 6.05% CAGR through 2031.
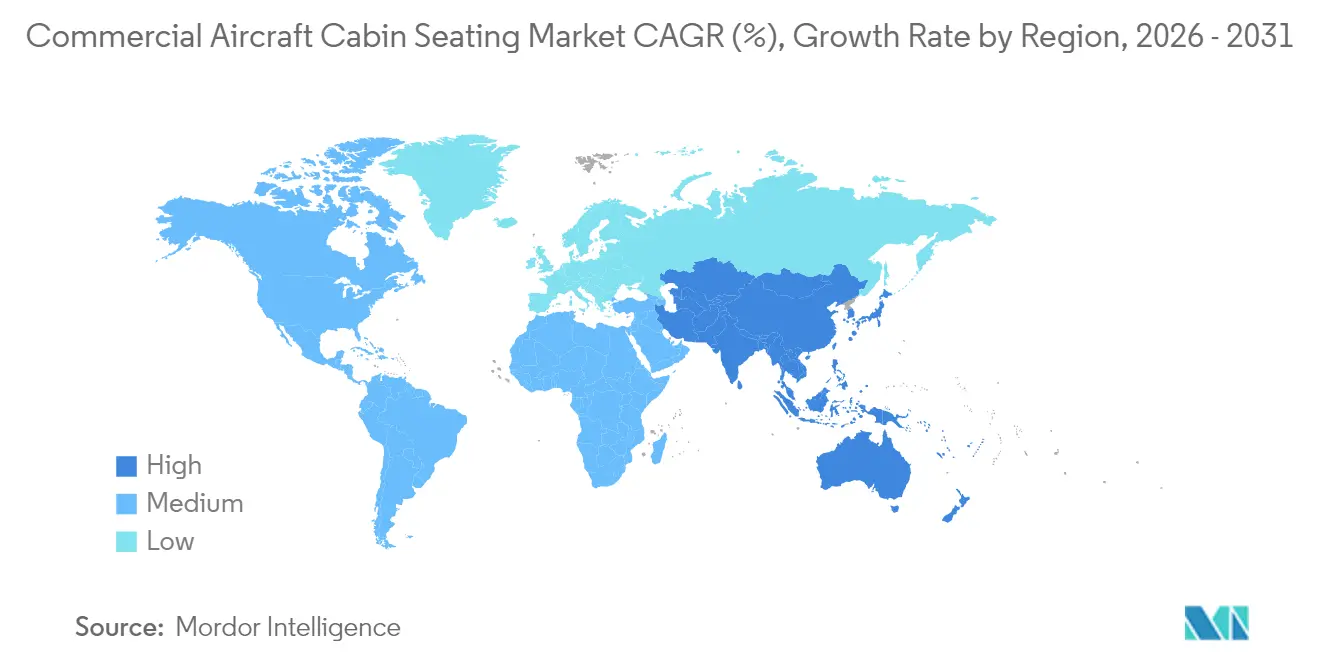
- By geography, the Asia-Pacific region is expected to dominate with a 36.05% share in 2025 and is forecast to post a 6.71% CAGR to 2031.
Note: Market size and forecast figures in this report are generated using Mordor Intelligence’s proprietary estimation framework, updated with the latest available data and insights as of 2026.
Global Commercial Aircraft Cabin Seating Market Trends and Insights
Drivers Impact Analysis*
| Driver | (%) Impact on CAGR Forecast | Geographic Relevance | Impact Timeline |
|---|---|---|---|
| Rapid aircraft fleet renewal cycles | +1.2% | Global, especially APAC and North America | Medium term (2-4 years) |
| Airlines’ pivot to premium-economy re-config. | +1.8% | Global, led by North America and Europe | Short term (≤ 2 years) |
| Cabin densification for higher yield | +1.1% | Global, strong in emerging markets | Medium term (2-4 years) |
| OEM push for lightweight composite seats | +1.9% | Developed markets first, global roll-out | Long term (≥ 4 years) |
| Smart-seat retrofit analytics | +1.2% | North America and Europe, expanding to APAC | Long term (≥ 4 years) |
| Single-aisle XLR range extension | +1.3% | Transcontinental routes worldwide | Medium term (2-4 years) |
| Source: Mordor Intelligence | |||
Airlines’ Pivot to Premium-Economy Re-Configuration
Premium-economy cabins are bridging the gap between economy and business class, offering a profitable middle ground without significant cost penalties. Airlines in the US and Asia have introduced seating zones with enhanced features, including greater recline depth, increased seat width, and upgraded meal services, all within the constraints of the narrow-body fuselage. Premium-economy fares generate margins two to three times higher than standard economy seats, driving retrofits on legacy fleets. With a projected CAGR of 7.15% through 2030, this segment highlights the growing demand for incremental comfort. Early adopters, such as American Airlines and Singapore Airlines, report load factors exceeding 80%, highlighting the success of premium-economy cabins in striking a balance between comfort and profitability.[1]Singapore Airlines, “Cabin Features – Suites,” singaporeair.com
Cabin Densification to Maximize Per-Flight Yield
Slimline structures enable airlines to add one to two extra rows in single-aisle cabins while maintaining an acceptable seat pitch, thereby unlocking revenue per departure without increasing ticket prices. Collins Aerospace’s ultra-thin foam and composite spar systems shave kilograms from each triple-seat module, letting carriers balance weight and volume targets simultaneously.[2]Collins Aerospace, “Cabin Interiors – Seating,” collinsaerospace.com
Demand is strongest in high-frequency domestic markets where aircraft cycles exceed 12 hours per day. As operating cost pressure rises with carbon pricing schemes, densification combined with modern ergonomics remains a pragmatic lever, sustaining its contribution to growth.
OEM Push for Lightweight Composite Seats
Aircraft OEMs now specify maximum seat-mass envelopes as part of line-fit contracts, compelling suppliers to introduce carbon-fiber frames and bio-based foams. Material advancements reduce seat weight by up to 30%, resulting in annual fuel savings that exceed upfront seat premiums within 24 months of service entry.[3]Muirhead, “BioPRO Sustainable Foam,” muirhead.co.uk
The technology is initially prevalent on long-haul fleets that incur high fuel burn, but is also cascading to domestic operators seeking to offset rising sustainable aviation fuel (SAF) costs. Composite adoption also supports environmental, social, and governance disclosures, bolstering airline brand equity among eco-conscious travelers.
Smart-Seat Retrofit Programs for Real-Time Passenger Analytics
Sensor-rich seat architectures generate continuous data on occupancy, posture, and belt engagement, enabling predictive catering, targeted ancillary offers, and early fault detection. North American majors are mapping passenger dwell patterns to refine in-flight service sequencing, trimming galley waste by up to 15%. European operators utilize condition-based maintenance alerts to reduce unscheduled seat repairs, thereby protecting on-time performance metrics. The technology’s long-term horizon aligns with the rollout of 5G airborne connectivity, underpinning the forecast CAGR uplift for the commercial aircraft cabin seating market.
Restraints Impact Analysis*
| Restraint | (%) Impact on CAGR Forecast | Geographic Relevance | Impact Timeline |
|---|---|---|---|
| Supply-chain bottlenecks for foams and composites | −1.4% | Global, acute in North America and Europe | Short term (≤ 2 years) |
| FAA/EASA certification delays | −0.8% | Global, regulatory hubs in the US and EU | Medium term (2-4 years) |
| Rising warranty costs for dress-cover wear | −0.6% | High-utilization long-haul networks worldwide | Medium term (2-4 years) |
| Airline balance-sheet stress in emerging mkts | −0.9% | Emerging markets with spillover elsewhere | Short term (≤ 2 years) |
| Source: Mordor Intelligence | |||
Supply-Chain Bottlenecks in Foam and Composite Sub-Components
A limited pool of certified suppliers for fire-retardant polyurethane and high-modulus carbon sheets has resulted in lead times of up to 18 months. Airlines have deferred cabin retrofits, opting to extend the use of older interiors rather than grounding aircraft during high-season windows. Seat OEMs now dual-source raw materials and pre-qualify secondary producers to mitigate risk, yet capacity additions take at least two years due to aviation qualification hurdles. The resulting −1.4% drag on CAGR in peak travel seasons for the commercial aircraft cabin seating market is most acute where retrofit timelines intersect with lease return schedules.
FAA/EASA Certification Delays for New Seat Architectures
Innovative seat concepts, such as oblique angle configurations and berth-style suites, create special conditions that require additional compliance documentation, flammability testing, and head-injury criterion analyses. FAA docket reviews indicate that approval cycles for first-of-type applications often exceed 24 months.[4]Federal Aviation Administration, “Special Conditions for A321XLR Oblique Seating,” faa.gov
These lags favor incumbents with proven designs and large certification teams, slowing disruptive entrants and reducing the forecasted CAGR by 0.8%.
*Our forecasts treat driver/restraint impacts as directional, not additive. The impact forecasts reflect baseline growth, mix effects, and variable interactions.
Segment Analysis
By Aircraft Type: Narrow-body Leadership Faces Competitive Pressure
Narrow-body platforms generated 51.02% of the commercial aircraft cabin seating market share in 2025, reflecting the dominance of A320neo and 737 MAX family deliveries. This category’s 6.34% CAGR through 2031 draws strength from high-frequency point-to-point networks and the extended-range XLR derivative, which supports premium cabins on routes previously flown by twin-aisle aircraft. Consequently, the commercial aircraft cabin seating market size associated with narrow-body aircraft is projected to increase from USD 1.97 billion in 2026 to USD 2.68 billion by 2031. The segment’s growth also benefits retrofit programs as operators modernize earlier-generation 737NG and A321ceo interiors to harmonize brand aesthetics.
Wide-bodies, though delivered in smaller volumes, command higher per-seat revenues thanks to complex suite and lie-flat products. The sub-segment’s steady demand from Gulf and Asian hub carriers shields seat OEMs from narrow-body cyclicality. Regional jets and turboprops, serving thin routes and secondary airports, focus on ultra-light recliners with integrated stowage that minimize weight penalties. Manufacturers such as Collins Aerospace leverage modular design to share structural components across aircraft categories, reducing non-recurring certification costs and keeping regional-jet price points competitive. Competitive tension is rising, however, as Chinese and Japanese seat makers pitch low-cost alternatives for emerging market fleets, challenging incumbent share within the commercial aircraft cabin seating market.


By Cabin Class: Economy Maintains Leadership Despite Premium Growth
Economy class retained a 47.68% revenue share in 2025, underlining its foundational role in democratized air travel. Basic slimline rows continue evolving with improved cushioning, USB-C charging, and decluttered tray tables that reduce maintenance time. Nevertheless, premium economy’s 6.92% CAGR signals a pivot toward ancillary revenue that offsets fare competition on trunk routes. Airlines target a 1.6-times fare multiplier over standard coach fares while incurring only 1.15-times the variable cost, explaining the aggressive rollout pace.
Business class is transitioning to sliding-door suites featuring direct aisle access in 1-2-1 layouts. The commercial aircraft cabin seating market size attributable to these products reaches USD 1.29 billion in 2026 and is poised to breach USD 1.88 billion by 2031. First-class, offered by fewer carriers, still commands attention due to brand halo effects. Seat OEMs thus invest in technology crossovers, adapting first-class privacy shells into business-class footprints to tap wider demand. Supply-chain resilience, rapid prototyping, and finish-level customization now define competitive advantage across the commercial aircraft cabin seating industry.
By Seat Type: Recliner Dominance Reflects Comfort Evolution
Recliner formats, encompassing premium economy and domestic first-class products, accounted for 37.12% of the 2025 revenue. Airlines prefer these seats due to their space-efficient folding mechanisms and the relatively straightforward certification process they require. Meanwhile, suite/full-privacy seating lines, such as Safran’s Unity and RECARO’s CL6710, are experiencing the fastest growth, with a CAGR of 8.21%, as operators increasingly target high-yield corporate travelers. The commercial aircraft cabin seating market size associated with suite solutions is projected to double between 2026 and 2031, driven by the accelerated adoption of single-aisle lie-flat seating solutions.
Fixed-back economy seats continue to serve as a volume mainstay for volume. However, incremental advancements, including suspension seat pans and contoured backrests, are proving effective in reducing traveler fatigue on flight segments lasting up to five hours. Lie-flat seats remain dominant in long-haul business class; however, their adoption on shorter routes is constrained by weight and maintenance considerations. To address these challenges, OEMs are now developing common platforms that integrate recliner, premium economy, and lie-flat modules using shared structural spines. This innovation significantly reduces development timelines and certification costs within the commercial aircraft cabin seating industry.
By Fitment: Line-fit Dominance Challenged by Retrofit Growth
Line-fit installations accounted for 64.15% of 2025 shipments, driven by their seamless integration during airframe assembly and the benefits of weight optimization. Airbus and Boeing establish seat engineering freeze dates approximately 15 months before delivery, offering suppliers well-defined schedules and predictable revenue streams. Meanwhile, retrofit activity is projected to grow at a compound annual growth rate (CAGR) of 6.05%, as airlines increasingly prioritize cabin upgrades to keep pace with fleet renewal cycles. The commercial aircraft cabin seating market size for retrofit solutions is anticipated to expand from USD 1.37 billion in 2026 to USD 1.84 billion by 2031. Key challenges, including program complexity, limited downtime availability, and supply chain bottlenecks, continue to pose concerns. However, the thriving second-life aircraft market supports consistent demand for cost-effective and modular upgrade kits.
Geography Analysis
Asia-Pacific’s leadership stems from 6,000-plus aircraft on order and supportive airport infrastructure programs that absorb future seat production. Multi-class configurations tailored to family travel and short-haul business itineraries dominate, yet long-haul premium demand is rising on kangaroo routes and transpacific links. Local content rules in China prompt joint ventures between Western seat OEMs and domestic suppliers, ensuring compliance while preserving certification integrity.
North American carriers concentrate on fleet simplification and cabin densification. Frequent interior refresh cycles, averaging seven years, bolster aftermarket prospects for seat fabric vendors and smart-seat sensor retrofits. Europe, facing stringent circular economy mandates, spearheads recyclable cushion and biodegradable foam initiatives that ripple across global programs. The commercial aircraft cabin seating market, therefore, experiences a dual pull: cost-driven densification and sustainability-driven material innovation.
The Middle East and Africa, together, account for less than 10% of current revenue, yet promise outsized growth tied to tourism diversification strategies and regional hub competition. Gulf super-connectors invest heavily in first-class suites that function as brand showcases, while African flag carriers prioritize durable recliners able to withstand hot-and-humid conditions. Currency volatility and political risk temper adoption pace, but export-credit agency support and leasing models mitigate funding constraints, keeping the commercial aircraft cabin seating market’s geographic spread broadening through the decade.

Competitive Landscape
Market concentration is moderate, as the top five vendors —Collins Aerospace, Safran, RECARO, Stelia Aerospace, and Thompson Aero —collectively control approximately 55% of global shipments. Certification know-how, OEM line-fit approvals, and vertically integrated foam or cover production anchor their advantage. Collins Aerospace leverages its global MRO network to bundle seating support with avionics contracts, ensuring sticky aftermarket revenue streams. Safran deploys a standard composite shell across multiple product families, cutting development cycles and lowering per-seat cost while maintaining premium finishes.
Disruptive entrants emphasize ultra-light frames and 3-D-printed brackets that simplify assembly and facilitate rapid customization. Expliseat’s titanium-hybrid TiSeat E2, for instance, offers 40% weight savings and a parts count under 200, reducing installation man-hours. Established players respond by acquiring niche technology firms or establishing strategic partnerships to expand material and digital capabilities.
Intellectual property portfolios in modular monument integration and dynamic lumbar support systems become key differentiators as airlines request bespoke layouts within weeks, rather than months. Seat makers also invest in digital twins that simulate lifecycle wear, helping carriers predict overhaul intervals. Warranty risk-sharing agreements and power-by-the-hour seat-cover programs emerge as additional levers to secure long-term contracts in the commercial aircraft cabin seating market.
Commercial Aircraft Cabin Seating Industry Leaders
Collins Aerospace
Recaro Group
Safran
Airbus
Elevate Aircraft Seating LLC
- *Disclaimer: Major Players sorted in no particular order

Recent Industry Developments
- June 2025: FlySafair selected Acro Aircraft Seating for its fleet. Acro Aircraft Seating will supply multiple shipsets of Series 9 Fixed Back seats to FlySafair.
- April 2025: Riyadh Air selected Safran's Unity Business Class Suite for installation across its Boeing 787-9 fleet. The airline's decision aligns with its commitment to deliver premium passenger comfort and modern cabin amenities.
- February 2024: Air India selected Recaro Aircraft Seating to provide premium economy and economy seats for its widebody fleet expansion program, which is part of its 470-aircraft order. The agreement includes the installation of over 22,000 Recaro seats in the airline's linefit and retrofit twin-aisle aircraft programs during the next five to six years.
- June 2023: RECARO Aircraft Seating and Embraer signed an agreement to develop a Supplier Furnished Equipment (SFE) catalog of seats for E1 and E2 aircraft. The SFE catalog includes the BL3710 and SL3710 economy class seats, available for both linefit and retrofit configurations.


Global Commercial Aircraft Cabin Seating Market Report Scope
Narrowbody, Widebody are covered as segments by Aircraft Type. Asia-Pacific, Europe, Middle East, North America are covered as segments by Region.By Aircraft Type
| Narrowbody |
| Widebody |
| Regional Jet |
| Turboprop |
By Cabin Class
| Economy |
| Premium Economy |
| Business |
| First |
By Seat Type
| Standard Fixed-back |
| Recliner |
| Lie-flat |
| Suite/Full-privacy |
By Fitment
| Line-fit |
| Retrofit |
By Region
| North America | United States | |
| Canada | ||
| South America | Brazil | |
| Rest of South America | ||
| Europe | Germany | |
| France | ||
| United Kingdom | ||
| Spain | ||
| Italy | ||
| Russia | ||
| Rest of Europe | ||
| Asia-Pacific | China | |
| India | ||
| Japan | ||
| South Korea | ||
| Indonesia | ||
| Australia | ||
| Rest of Asia-Pacific | ||
| Middle East and Africa | Middle East | Saudi Arabia |
| UAE | ||
| Qatar | ||
| Rest of Middle East | ||
| Africa | South Africa | |
| Nigeria | ||
| Rest of Africa | ||
| By Aircraft Type | Narrowbody | ||
| Widebody | |||
| Regional Jet | |||
| Turboprop | |||
| By Cabin Class | Economy | ||
| Premium Economy | |||
| Business | |||
| First | |||
| By Seat Type | Standard Fixed-back | ||
| Recliner | |||
| Lie-flat | |||
| Suite/Full-privacy | |||
| By Fitment | Line-fit | ||
| Retrofit | |||
| By Region | North America | United States | |
| Canada | |||
| South America | Brazil | ||
| Rest of South America | |||
| Europe | Germany | ||
| France | |||
| United Kingdom | |||
| Spain | |||
| Italy | |||
| Russia | |||
| Rest of Europe | |||
| Asia-Pacific | China | ||
| India | |||
| Japan | |||
| South Korea | |||
| Indonesia | |||
| Australia | |||
| Rest of Asia-Pacific | |||
| Middle East and Africa | Middle East | Saudi Arabia | |
| UAE | |||
| Qatar | |||
| Rest of Middle East | |||
| Africa | South Africa | ||
| Nigeria | |||
| Rest of Africa | |||


Market Definition
- Product Type - The seats that are integrated into the passenger aircraft and which are made up of a different combination of materials are included in this study.
- Aircraft Type - All the passenger aircraft such as narrowbody and widebody which are single-aisle and twin-aisle are included in this study.
- Cabin Class - Business and First Class, economy and premium economy are classes of air travel provided by the airlines that offer various services to the passengers.
| Keyword | Definition |
|---|---|
| Gross domestic product (GDP) | Gross domestic product (GDP) is a monetary measure of the market value of all the final goods and services produced in a specific time period by countries. |
| Original Equipment Manufacturer (OEM) | An original equipment manufacturer (OEM) traditionally is defined as a company whose goods are used as components in the products of another company, which then sells the finished item to users. |
| High Dynamic Range (HDR) | Dynamic range describes the ratio between the brightest and darkest parts of an image. HDR is used to capture a greater dynamic range than SDR. |
| Federal Aviation Administration (FAA) | The division of the Department of Transportation is concerned with aviation. It operates Air Traffic Control and regulates everything from aircraft manufacturing to pilot training to airport operations in the United States. |
| European Aviation Safety Agency (EASA) | The European Aviation Safety Agency is a European Union agency established in 2002 with the task of overseeing civil aviation safety and regulation. |
| 4K Display | 4K resolution refers to a horizontal display resolution of approximately 4,000 pixels. |
| Organic Light Emitting Diode (OLED) | It is the light-emitting diode (LED) in which the emissive electroluminescent layer is a film of organic compound that emits light in response to an electric current. |
| Mean Time Between Failures (MTBF) | The mean time between failures is the predicted elapsed time between inherent failures of a mechanical or electronic system, during normal system operation. |
| (Low-Cost Carrier (LCCs) | It is an airline that is operated with an especially high emphasis on minimizing operating costs and without some of the traditional services and amenities provided in the fare |
| Electronically Dimmable Windows (EDW) | It is a type of window that blocks up to 99.96% of all visible light and provide full opacity, integrated into the window cassette of the sidewall panel. |


Research Methodology
Mordor Intelligence follows a four-step methodology in all our reports.
- Step 1: Identify Key Variables: In order to build a robust forecasting methodology, the variables and factors identified in Step-1 are tested against available historical market numbers. Through an iterative process, the variables required for market forecast are set and the model is built on the basis of these variables.
- Step 2: Build a Market Model: Market-size estimations for the historical and forecast years have been provided in revenue terms. For sales conversion to volume, the average selling price (ASP) is kept constant throughout the forecast period for each country, and inflation is not a part of the pricing.
- Step 3: Validate and Finalize: In this important step, all market numbers, variables and analyst calls are validated through an extensive network of primary research experts from the market studied. The respondents are selected across levels and functions to generate a holistic picture of the market studied.
- Step 4: Research Outputs: Syndicated Reports, Custom Consulting Assignments, Databases & Subscription Platforms


