
North America Agricultural Chemical Packaging Market Size and Share
Market Overview
| Study Period | 2020 - 2031 |
|---|---|
| Forecast Data Period | 2026 - 2031 |
| Base Year Market Size (2025) | USD 1.02 Billion |
| Market Size (2026) | USD 1.05 Billion |
| Market Size (2031) | USD 1.24 Billion |
| Growth Rate (2026 - 2031) | 3.35 % |
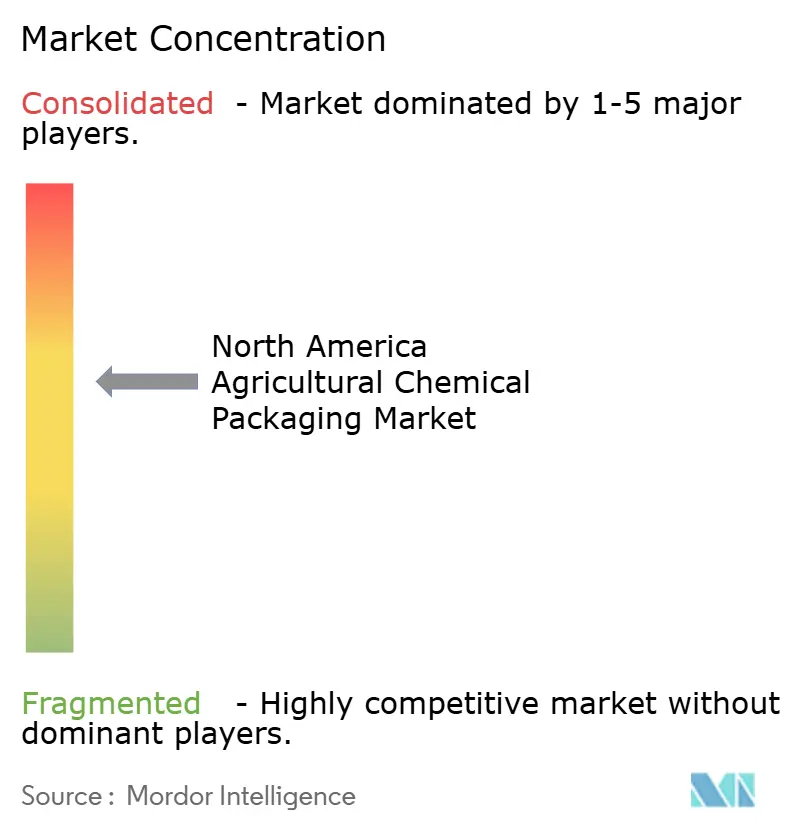
| Market Concentration | Medium |
Major Players *Disclaimer: Major Players sorted in no particular order Image © Mordor Intelligence. Reuse requires attribution under CC BY 4.0. | |
North America Agricultural Chemical Packaging Market Analysis by Mordor Intelligence
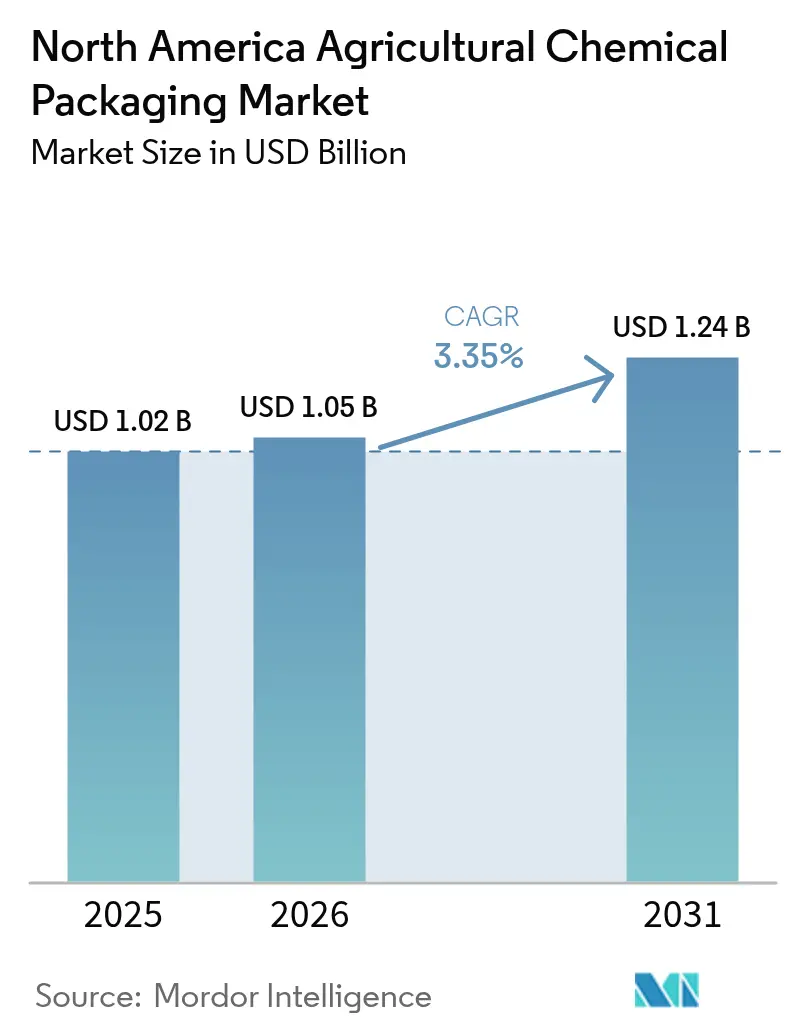
The North America agricultural chemical packaging market size is expected to grow from USD 1.02 billion in 2025 to USD 1.05 billion in 2026 and is forecast to reach USD 1.24 billion by 2031 at 3.35% CAGR over 2026-2031. This steady expansion shows the market’s shift from volume-driven growth toward value-added formats that function as precision-application enablers rather than simple containers. Precision farming, sustainability mandates, and tighter stewardship rules are prompting suppliers to redesign pack sizes, barrier properties, and traceability features to protect active ingredients and support data-driven application. Plastic remains the dominant material, but bio-based and composite options record the fastest gains as extended producer responsibility (EPR) fees reward recyclable formats. Capacity investments in domestic resin and conversion lines further stabilize supply while enabling specialty grades that meet regulated performance thresholds.
Key Report Takeaways
- By material type, plastic retained 64.65% of the North America agricultural chemical packaging market share in 2025, whereas composite and bio-based materials are projected to grow at a 4.35% CAGR through 2031.
- By product type, bags and pouches accounted for 43.92% of the North America agricultural chemical packaging market size in 2025, while intermediate bulk containers (IBCs) are expected to advance at a 4.67% CAGR to 2031.
- By application, fertilizers led with 48.35% of the North America agricultural chemical packaging market share in 2025 and biologicals and plant growth regulators are expanding at a 5.11% CAGR through 2031.
- By capacity range, containers under 20 liters contributed 51.02% of the North America agricultural chemical packaging market size in 2025, whereas units over 200 liters are set to post the quickest 4.89% CAGR to 2031.
- By geography, the United States held 70.85% of regional revenue in 2025 while Mexico is poised for the highest 4.92% CAGR during the forecast period.
Note: Market size and forecast figures in this report are generated using Mordor Intelligence’s proprietary estimation framework, updated with the latest available data and insights as of 2026.
Worldwide, activity is shaped by contributions from multiple regions, with North america representing one of the more structurally developed among them. The global report on agriculture chemical packaging market by Mordor Intelligence reflects how these regional layers combine into a single system.
Market Trends and Insights
Drivers Impact Analysis of North America Agricultural Chemical Packaging Market*
| Driver | (~) % Impact on CAGR Forecast | Geographic Relevance | Impact Timeline |
|---|---|---|---|
| Controlled-release and water-soluble films | +0.8% | United States Midwest and wider region | Medium term (2-4 years) |
| Recyclable and bio-based packaging shift | +0.6% | United States and Canada, Mexico catching up | Long term (≥ 4 years) |
| Smaller-dose high-barrier precision packs | +0.5% | Great Plains and Prairie provinces | Short term (≤ 2 years) |
| Bulk-container reusability programs | +0.4% | United States and Canada | Medium term (2-4 years) |
| Digitally traceable stewardship solutions | +0.3% | United States, moderate Canada uptake | Medium term (2-4 years) |
| Domestic resin and conversion investments | +0.2% | United States Gulf Coast and Canadian hubs | Long term (≥ 4 years) |
| Source: Mordor Intelligence | |||
Growth in Controlled-Release and Water-Soluble Film Adoption
Controlled-release packaging extends active ingredient efficacy and lowers labor inputs, answering the operational efficiency needs of large North American farms. Water-soluble films dissolve entirely in spray tanks and remove container-disposal headaches, improving safety and field productivity. Herbicide and fungicide applications benefit most because dosing precision directly affects yields and regulatory compliance. Precision-farming software accelerates uptake, as farmers favor packs that align with GPS-guided systems and variable-rate maps. As a result, packaging shifts from passive containment to a digitally integrated delivery component embedded in farm management workflows.
Sustainability-Driven Shift to Recyclable and Bio-Based Formats
EPR rules in five U.S. states impose eco-modulated fees that reward materials with recycled or renewable content, nudging converters toward polylactic acid (PLA), polyhydroxyalkanoate (PHA), and other bio-based resins. Cost premiums are narrowing as commercial-scale plants, such as Citroniq’s USD 12 million polypropylene line in Nebraska, increase supply. Brand sustainability pledges add downstream pressure, making carbon-footprint disclosure and recyclability critical purchase criteria for growers and input distributors. R&D now focuses on matching the moisture, oxygen, and UV barriers of conventional resins so that sensitive herbicides and biologicals remain stable throughout multi-season storage.
Precision-Farming Demand for Smaller-Dose, High-Barrier Packs
Variable-rate technologies boost demand for 250-milliliter to 5-liter containers that support precise titration across heterogeneous fields. Multi-layer films using nanocomposites deliver the oxygen and moisture barriers required to keep biological actives potent, while RFID tags tie container identifiers to agronomic software for automated compliance logs. Suppliers view these premium formats as revenue-enhancement opportunities that justify higher unit prices through dosage accuracy and shelf-life extension.
Bulk-Container Re-usability Programs by Large Distributors
Rental models operated by service providers such as CHEP illustrate how pooled IBC fleets lower capital outlays, standardize handling, and cut waste streams. Seasonal distributors appreciate on-demand capacity that scales with harvest cycles, while digital tracking enables real-time inventory optimization and predictive maintenance. Regulatory discussions around deposit systems further strengthen the economic case for multi-trip containers over single-use drums.
Restraints Impact Analysis of North America Agricultural Chemical Packaging Market*
| Restraint | (~) % Impact on CAGR Forecast | Geographic Relevance | Impact Timeline |
|---|---|---|---|
| Tightening UN and DOT hazardous-goods rules | -0.4% | United States and Canada | Short term (≤ 2 years) |
| Volatile polymer and metal feedstock prices | -0.6% | North America-wide, Gulf Coast exposure | Short term (≤ 2 years) |
| Farmer push-back on packaging waste fees | -0.2% | U.S. EPR states | Medium term (2-4 years) |
| Distributor destocking cycles post-2023 | -0.3% | United States and Canada | Short term (≤ 2 years) |
| Source: Mordor Intelligence | |||
Tightening UN and DOT Hazardous-Goods Regulations
Enhanced performance tests for drums and IBCs raise certification expenses by USD 50,000-100,000 per product line, a burden that smaller converters struggle to absorb. Inventory phase-outs of non-compliant stock disrupt supply chains and accelerate consolidation as niche suppliers seek acquisition by firms with established compliance laboratories and testing budgets.
Volatile Polymer and Metal Feedstock Prices
Polypropylene and polyethylene spot prices climbed 15% in March 2025, mirroring energy-market swings that feed directly into resin costs.[1] Steel volatility likewise reshapes drum pricing. Large converters hedge or diversify sourcing, whereas small-scale players endure margin compression and delay capex decisions amid uncertain payback windows. The unpredictability complicates pricing agreements with distributors who demand stable year-ahead budgets.
*Our forecasts treat driver/restraint impacts as directional, not additive. The impact forecasts reflect baseline growth, mix effects, and variable interactions.
North America Agricultural Chemical Packaging Market Segment Analysis
By Material Type:
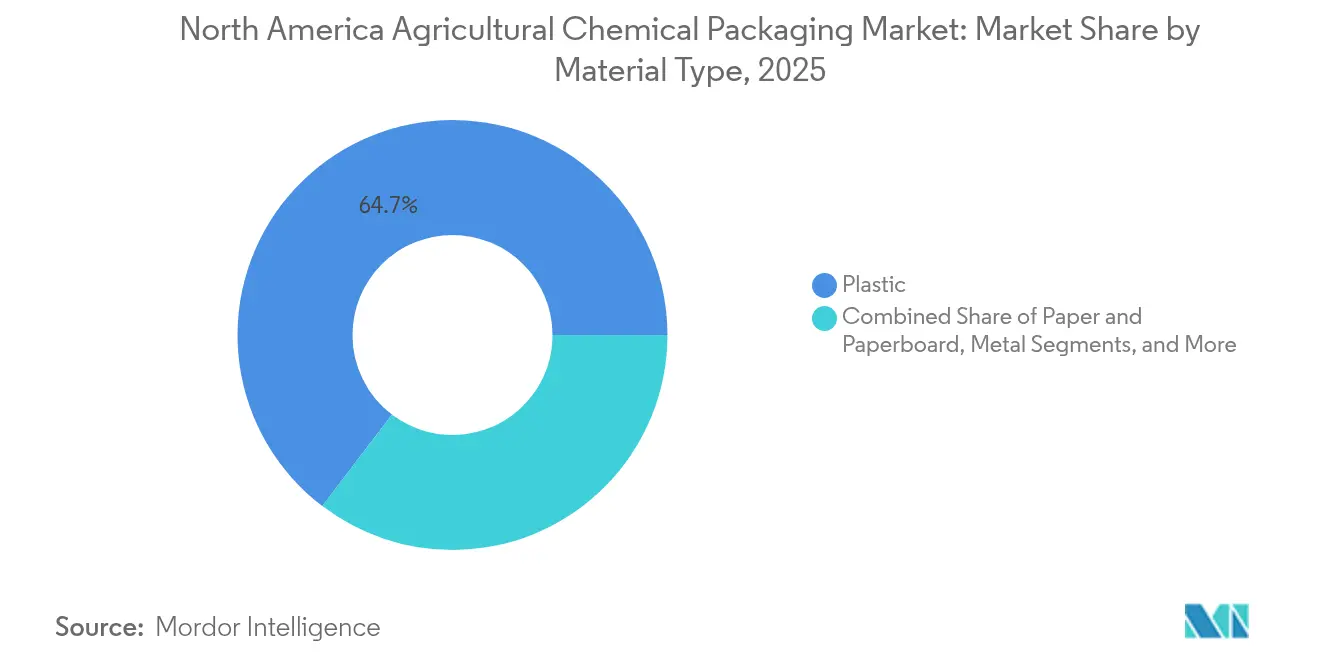
Plastic Dominance Faces Bio-Based DisruptionPlastic captured 64.65% of the North America agricultural chemical packaging market in 2025 owing to its high chemical resistance and favorable cost-to-performance ratio. The segment’s CAGR remains modest as bio-based and composite substrates outpace at 4.35%, propelled by EPR incentives and farm-level sustainability pledges. Composite laminates marry mechanical strength with downgauging potential, cutting polymer mass by up to 15% without forfeiting puncture resistance. Bio-based polypropylene sourced from non-food biomass increasingly meets moisture and oxygen protection criteria, positioning it for premium-priced specialty herbicide and biological packs.
Demand heterogeneity is widening: fertilizers rely on rugged HDPE jugs for cost efficiency, whereas living microbial products require oxygen-scavenging multilayers. Consequently, converters diversify material portfolios to hedge against policy changes and customer mix volatility. The North America agricultural chemical packaging market size devoted to bio-based formats is still niche, but early movers gain specification lock-ins as sustainability scorecards become standard in procurement.

By Product Type:
IBCs Accelerate on Efficiency DemandsBags and pouches delivered 43.92% revenue in 2025 because they fit existing filling lines, ship flat, and support water-soluble or controlled-release films. Yet IBCs register the highest 4.67% CAGR through 2031 as bulk intermediaries consolidate volumes to trim freight and labor. Digital-ready IBCs, fitted with QR plates or low-power sensors, shift containers from static storage to active visibility nodes in distributor networks.
Flexible intermediate bulk containers (FIBCs) and rigid combo totes broaden applications, especially for granular fertilizers where pallet-layer stability matters. Conversely, pouches evolve toward multilayer formats with built-in surfactants that improve spray-tank dispersion. The North America agricultural chemical packaging market share of pouches stays meaningful due to their role in precision dosing, yet the service-based economics of pooled IBC programs attract large retailers seeking waste-reduction credits and cost predictability.
By Application Type:
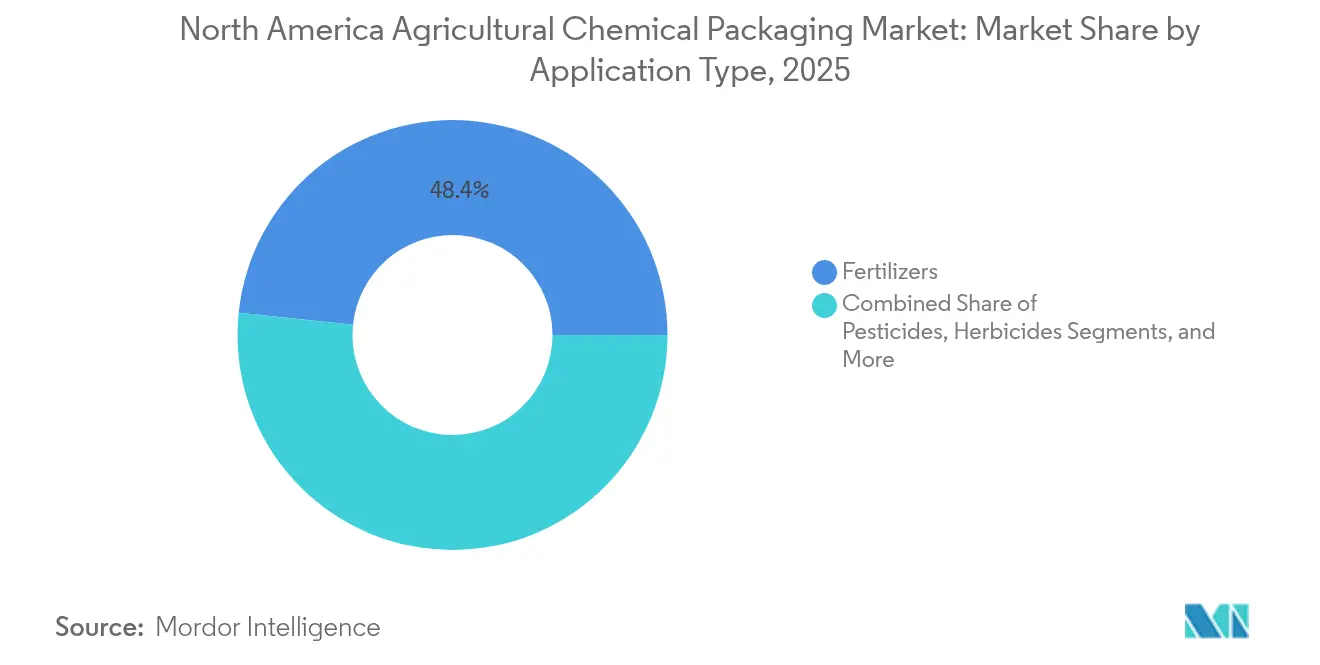
Biologicals Drive Innovation Beyond Traditional ChemicalsFertilizers maintained 48.35% market share in 2025, anchored by predictable bulk demand cycles and mature moisture-barrier needs. However, biologicals and plant growth regulators carve a 5.11% CAGR niche as integrated pest-management adoption expands. Live microbial inoculants necessitate refrigerated storage and high-barrier vials, prompting converters to adapt pharmaceutical-grade laminates for farm distribution.
Pesticide and herbicide packs push controlled-release and child-resistant closures to satisfy safety rules while aligning with labor-saving spray regimes. Segment diversity forces suppliers to maintain broad technical capabilities across moisture, oxygen, and UV protection. Thus, the North America agricultural chemical packaging market size devoted to specialty biologicals, though still small, commands superior margins and drives multilayer film R&D.
By Capacity Range:
Precision Agriculture Reshapes Size PreferencesContainers below 20 liters held 51.02% share in 2025 as variable-rate seed and nutrient maps require small batches matched to field zones. Near-term growth persists, yet packages above 200 liters deliver the quickest 4.89% CAGR as national distributors routinize centralized blending and refill stations. Intermediate 21-200 liter drums cater to mid-scale horticulture and specialty-crop users demanding ergonomic handling without sacrificing throughput.
Smaller packs integrate RFID chips or near-field-communication tags that automate spray-record uploads into compliance databases. Large-capacity formats embed steel-frame reinforcements for rack safety and leverage HDPE liners for chemical integrity. Consequently, converters design modular lines capable of switching from 10-liter multilayer jugs to 1,000-liter composite IBCs within one shift to capture the full capacity spectrum of the North America agricultural chemical packaging market.
Geography Analysis
United States Agricultural Chemical Packaging Market
The United States controlled 70.85% of the North America agricultural chemical packaging market in 2025 thanks to its vast crop acreage, sophisticated distribution, and robust regulatory infrastructure. Precision-ag adoption is highest, creating demand for digitally traceable packs, controlled-release films, and high-barrier laminates that keep biologicals viable. EPR legislation in five states adds tiered fees favoring recycled content, accelerating material shifts toward multilayer composite grades that separate easily at recycling plants.
Canada Agricultural Chemical Packaging Market
Canada represents a mature but weather-challenged landscape where packaging must withstand cold-chain disruptions and compressed application windows. Carbon tax expenses of USD 8,000-15,000 per grain farm encourage logistics optimization, prompting uptake of pooled IBC systems and downgauged multilayer films that lower outbound weight. Provincial alignment with U.S. hazardous-goods codes eases cross-border flows yet requires bilingual labeling and specific metric/imperial markings, adding complexity for converters.
Mexico Agricultural Chemical Packaging Market
Mexico is the fastest-growing sub-region at 4.92% CAGR, driven by near-shoring of ag-chemical formulation plants and irrigation-led acreage expansion. Modernization efforts spur demand for packaging that meets stricter labeling norms and potentially higher excise taxes on agrochem inputs. Water scarcity concerns raise interest in controlled-dose pouches and drip-fertigation soluble films tailored to reduce runoff. Mexico thus offers early-stage opportunities for suppliers able to transfer U.S. technology at cost points suited to local purchasing power.
Regulatory Landscape
In the United States, agricultural chemical packaging for pesticides is governed by EPA requirements such as 40 CFR Part 165, which sets design, construction, and management standards for nonrefillable and refillable containers and associated repackaging practices. Labeling provisions also shape packaging format choices by requiring clear container statements (for example, refillable vs nonrefillable) and other label-linked packaging information. For bulk pesticide packaging, compliance additionally includes US DOT hazardous materials rules under 49 CFR Parts 171-180.
In Canada, pesticide packaging and labeling requirements fall under the Pest Control Products Regulations (SOR/2006-124) and related labeling frameworks administered by Health Canada (PMRA). Bilingual (English and French) legibility expectations influence label real estate and pack architecture. Cross-border logistics add another compliance layer, as 49 CFR 171.12 provides a pathway for transiting shipments between the United States and Canada when equivalent safety standards are met. This reinforces the need for harmonized UN/DOT performance packaging and dual-market label workflows across North American supply chains.
Value Chain Analysis
The value chain starts with raw materials (including resins such as HDPE/PP, barrier layers, and additives), then moves into packaging conversion (blow molding for jugs and jerrycans, drum and IBC fabrication, flexible film extrusion, and pouch conversion). Filling and repackaging typically occur at agrochemical manufacturers, toll formulators, and through distributor networks. Regulatory compliance is embedded in these steps through EPA container and containment rules (40 CFR Part 165), which affect container selection, testing cadence, and the economics of refillable versus nonrefillable systems, particularly for IBCs and drums.
Downstream, agricultural cooperatives and specialty-crop distribution channels influence specifications around handling efficiency, traceability, and end-of-life management. Stewardship and recycling programs support circularity claims for compliant container designs, with the Ag Container Recycling Council (ACRC) reporting more than 268 million pounds of agricultural plastic containers recycled since 1992, covering rigid HDPE containers 55 gallons and smaller. On the service and logistics side, investments in regional packaging and supply-chain hubs, including Rainbow North America Partner Production Center in Champaign, Illinois (opened in 2025 with six automated production lines and Free Trade Zone status), show packaging and kitting being integrated closer to agricultural demand centers.
Competitive Landscape
Industry consolidation shapes supplier dynamics as mega-mergers enlarge purchasing clout and R&D scale. Amcor’s proposed USD 8.4 billion purchase of Berry Global would create a USD 27.2 billion resin-buying powerhouse, streamlining raw-material negotiation and industrial footprint. [3] Smurfit Kappa’s USD 12.7 billion deal for WestRock strengthens corrugated offerings for secondary farm-input shipments. ProAmpac targets USD 5 billion revenue by 2028 by acquiring niche converters that possess precision-ag film know-how, illustrating a roll-up strategy that tilts the North America agricultural chemical packaging market toward a handful of diversified groups.
Technology differentiation, not just scale, is emerging as the key moat. CHEP’s tracking-enabled IBC rental service embeds logistics data feeds into customer ERPs, raising switching costs. Greif’s ModCan modular drum blends square-footage optimization with UN-certified performance to recapture share in concentrated-chemical transport. Smaller converters survive by specializing in bio-based resins or narrow-gauge blown-film lines that larger firms find uneconomical to tool.
Compliance investment is another barrier. The capital needed for UN 4G/11H testing rigs and in-house labs reinforces consolidation because only larger groups can amortize costs across high-volume SKU portfolios. Consequently, the North America agricultural chemical packaging industry shows a gradual but unmistakable tilt toward vertically integrated multinationals capable of spanning resin production through distribution-ready container fleets.
North America Agricultural Chemical Packaging Industry Leaders
-
Amcor plc
-
Greif Inc.
-
Mondi plc
-
Sonoco Products Company
-
ProAmpac LLC
- *Disclaimer: Major Players sorted in no particular order
North America Agricultural Chemical Packaging Market Companies Covered in this Report
- Amcor plc
- Greif Inc.
- Mondi plc
- Sonoco Products Company
- ProAmpac LLC
- LC Packaging International BV
- Mauser Packaging Solutions Holding Co.
- Silgan Holdings Inc.
- NNZ B.V.
- International Paper Company
- Smurfit WestRock
- Sealed Air Corporation
- Uflex Limited
- Constantia Flexibles Group GmbH
- Schutz GmbH & Co. KGaA
- Hoover CS LLC
- FlexPak Services LLC
- Intertape Polymer Group Inc.
Market Opportunities and Future Outlook
The most actionable opportunity is in compliant, high-performance packaging that meets hazardous-goods performance requirements while aligning with tightening sustainability scorecards. Where EPR fee structures and stewardship expectations push brand owners toward recycled content and improved recyclability, suppliers can differentiate through consistent mechanical properties, chemical resistance, and traceability-ready labeling surfaces that still meet UN/DOT performance packaging requirements. In May 2026, BASF introduced recycled plastic packaging for crop protection products in Canada, including Liberty AMP herbicide totes with up to 30% recycled content enabled by Irgastab additive technology, pointing to validated recycled-content pathways in higher-spec agricultural formats rather than only low-demand consumer packs.
Material and format innovation for precision application also supports specific lane opportunities in smaller-dose, high-barrier packs and in water-soluble systems that simplify on-farm handling and disposal. Evidence of active commercialization includes June 2025 adoption of a spouted pouch by ScottsMiracle-Gro and ProAmpac to reduce plastic use versus rigid containers for an insecticide product, and ongoing 2026 activity around water-soluble agriculture packaging offerings and barrier architectures, such as HDPE/EVOH multilayer COEX containers targeting oxygen and migration control. As distributors expand pooled and reusable bulk handling, and as biologicals and specialty actives demand tighter oxygen, moisture, and UV control, suppliers with multilayer film capability, COEX barrier know-how, and digitally traceable stewardship solutions can target differentiation across the United States, Canada, and Mexico.
Recent Industry Developments in North America Agricultural Chemical Packaging Market
- March 2026: Amcor partnered with De Ceuster Meststoffen NV (DCM) to introduce recycle-ready, mono-material polyethylene fertilizer packaging featuring post-consumer recycled content. The partnership underscores ongoing re-engineering of flexible structures toward recyclability, with implications for barrier design and seal integrity requirements in agricultural inputs packaging.
- June 2025: ProAmpac and ScottsMiracle-Gro launched a spouted pouch for an insecticide product (Ortho Home Defense Max), positioned to reduce plastic use versus traditional rigid packaging. The format shift also aligns packaging design with e-commerce handling needs, reinforcing demand for durable flexible packs that protect product performance through distribution.
- December 2024: Sonoco completed its acquisition of Eviosys, expanding its metal packaging and closures capabilities. The deal broadens Sonoco's portfolio depth for regulated packaging components and can influence supplier options for closures and metal formats used in agricultural chemical and related input packaging.
North America Agricultural Chemical Packaging Market Report Scope and Research Methodology
Market Definition and Coverage
For this study, we define the market as the value of packaging used to store, handle, and ship agricultural chemicals across North America, measured as packaging supplier revenue tied to agrochemical demand in the region.
Scope exclusions: It excludes bulk commodity resin and paper sales that are not converted into finished packs, and it also excludes labels, caps, and closures when they are not sold as part of the packaging unit.
Segments Covered in This Report
- By Material Type
- Plastic
- Paper and Paperboard
- Metal
- Composite and Bio-Based Materials
- By Product Type
- Bags and Pouches
- Containers and Cans
- Intermediate Bulk Containers (IBCs)
- Drums
- Other Product Types
- By Application Type
- Fertilizers
- Pesticides
- Herbicides
- Biologicals and Plant Growth Regulators
- By Capacity Range
- ≤ 20 L
- 21 – 200 L
- > 200 L
- By Country
- United States
- Canada
- Mexico
Data Sources, Market Sizing, and Validation
Desk Research
Desk research was used to set the North America demand context and to lock the market boundaries before any modeling started. We relied on public sources such as the US EPA pesticide program publications, USDA crop and farm input statistics, USITC trade data for relevant packaging and chemical-related codes, Statistics Canada tables, and Mexico trade and industry releases (where available).
To convert those signals into packaging demand logic, we reviewed association and standards material that explains pack safety and handling (for example, UN performance packaging guidance, ISO references, and relevant industry association notes), then matched it with company filings, investor decks, and trusted press coverage on packaging capacity and material shifts. In a few places, paid subscriptions that cover company financials, patents, and shipment-level import-export records were used to sanity check directionally, especially when public data was delayed. The desk source list above is illustrative only, and we also referred to other sources for data collection, validation, and research clarification.
Primary Interviews and Surveys
Primary work was used to confirm what actually gets purchased in the region, and to pressure test assumptions around pack type mix, material selection, and pricing movement. We spoke with packaging converters, distributors, and agrochemical supply chain roles, and then validated patterns across the United States, Canada, and Mexico so the model reflects procurement behavior rather than only reported production statistics.
Distribution of primary research fieldwork respondents
| Company type | Respondent position |
|---|---|
| Top tier: 33% | CXOs: 15% |
| Mid tier: 50% | Functional/Unit leaders: 29% |
| Smaller Players: 17% | Managers: 56% |
Market-Sizing & Forecasting
Sizing starts from a top-down build that reconstructs the packaging demand pool from agrochemical activity in North America, then filters it into the packaging formats used for distribution and on-farm handling. In practice, we connect chemical use intensity and crop mix with typical pack-out patterns, then apply an average selling price ladder by format and material that is checked through interviews.
To keep it practical, the model uses a small set of repeatable inputs, such as the split between liquid and dry formulations, the share of small packs versus bulk (including IBC usage), the adoption of closed handling and safety-driven pack specifications, resin and paper price direction, and regulatory-driven changes that affect pack design and compliance. Results are then corroborated with selective bottom-up approximations, including supplier and converter revenue roll-ups where coverage is available, plus sampled price-times-volume checks for key pack formats. When company disclosures do not separate agricultural chemicals from adjacent chemical packaging, we use transparent allocation keys based on product mix and customer exposure, and we re-check those keys with primary respondents.
For forecasting, we mainly run scenario analysis tied to expected crop protection demand, planting area direction, and packaging material substitution paths, since these variables tend to move together in non-linear ways during cost swings and regulatory updates. Each scenario is reviewed with industry experts, and the final forecast is selected only after the implied pack mix and pricing trend lines remain consistent with what respondents report in contracting and procurement cycles.
Data Validation & Update Cycle
We validate outputs through multiple passes that check for internal consistency and alignment with independent market signals. The checks include year-to-year variance testing by pack type and material, comparisons against trade flow direction where applicable, and a review of implied prices so outliers are flagged early.
Before sign-off, another analyst reviews the model logic, assumptions, and the link between inputs and totals, then completes a final variance check against the latest public releases. If a major mismatch shows up, we re-contact selected experts to confirm whether the change reflects real movement or a scope or timing issue. Reports are refreshed annually, and interim updates are made when material events occur, followed by a last pre-delivery pass so clients receive the most current view.
Mordor Intelligence's North America Agricultural Chemical Packaging Market Size Compared Against Other Published Estimates
Published market values for agricultural chemical packaging in North America can differ materially, even when the market label is the same. Variations typically trace back to what is counted as packaging, how pricing is treated across formats, and whether the estimate is anchored to chemical demand signals or to broader packaging shipments.
Some published figures expand into wider agricultural packaging, or they include non-chemical farm inputs that use similar containers. In Mordor Intelligence's approach, revenue is counted only for packaging units tied to agricultural chemicals across the United States, Canada, and Mexico, and the pack mix is built around formats like bags and pouches, IBCs, and cans and containers, rather than adding adjacent farm packaging categories.
Benchmark comparison
| Source | Market Size | Gaps in Research Methodology |
|---|---|---|
| Mordor Intelligence | USD 1.02 B (2025) | |
| Regional Consultancy A | USD 2.80 B (2026) | This figure appears to use a broader packaging scope and longer-range framing, which can pull in adjacent agricultural packaging and apply higher average pricing without separating chemical-only packs by format and capacity. |
| Trade Journal B | USD 2.36 B (2028) | The estimate is presented with limited clarity on inclusions and the time base, and it likely applies a generalized CAGR to a wide demand pool, which can overstate value when pack type mix and resin driven price swings are not validated by regional buyer behavior. |
The spread in the table is mainly explained by scope and by how pack mix and pricing are handled year by year. By keeping the count tied to agricultural chemical packaging units and then validating the implied prices and volume mix through repeatable checks, the resulting number stays easier to trace and easier to replicate when assumptions are updated.
Key Questions Answered in the Report
How large is the North America agricultural chemical packaging market in 2026?
It is valued at USD 1.05 billion in 2026 and is forecast to reach USD 1.24 billion by 2031.
Which material holds the biggest share of agricultural chemical packaging in North America?
Plastic commands 64.65% of regional revenue due to cost efficiency and chemical resistance.
What is driving the fastest growth in product types?
Intermediate bulk containers show a 4.67% CAGR as distributors prioritize reusability and logistics savings.
Why are smaller pack sizes gaining popularity?
Precision-agriculture equipment relies on smaller-dose, high-barrier containers that enable accurate variable-rate applications.
Which country is the fastest-growing market within North America?
Mexico is projected to grow at a 4.92% CAGR, aided by near-shoring and farm-modernization trends.
How are EPR regulations influencing packaging choices?
Eco-modulated fees in five U.S. states incentivize recyclable and bio-based formats, accelerating material shifts toward high-PCR and renewable resins.