Agentic AI Monitoring, Analytics, And Observability Tools Market Size and Share
Market Overview
| Study Period | 2019 - 2030 |
|---|---|
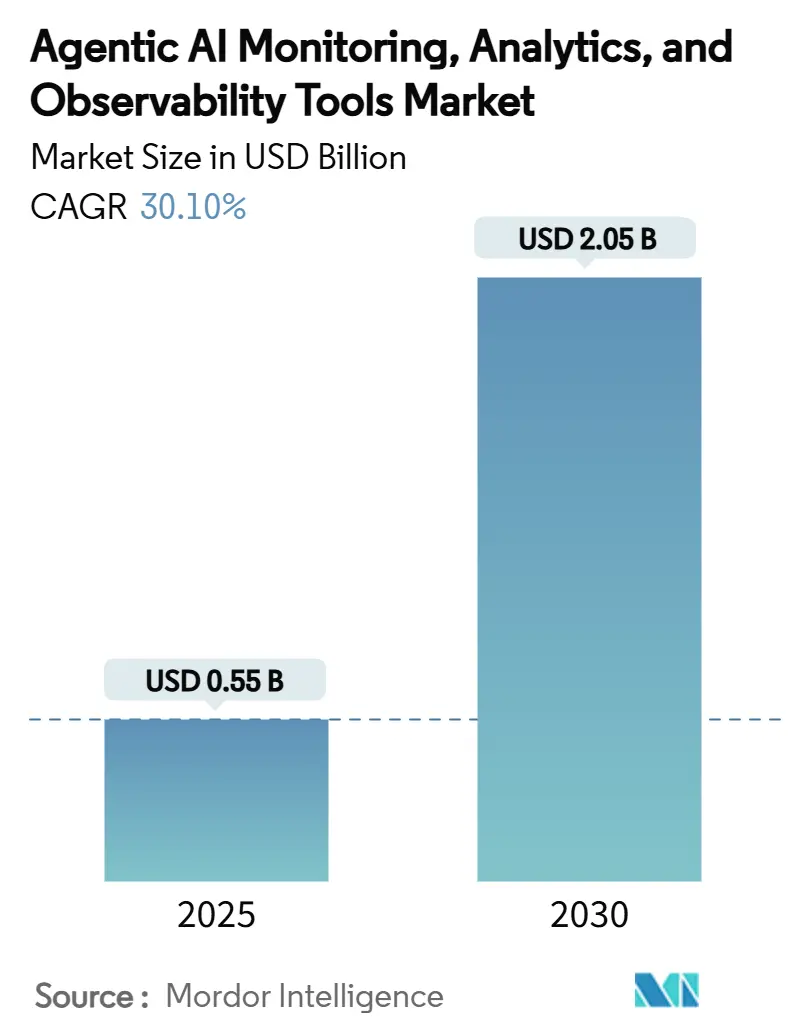
| Market Size (2025) | USD 0.55 Billion |
| Market Size (2030) | USD 2.05 Billion |
| Growth Rate (2025 - 2030) | 30.10% CAGR |
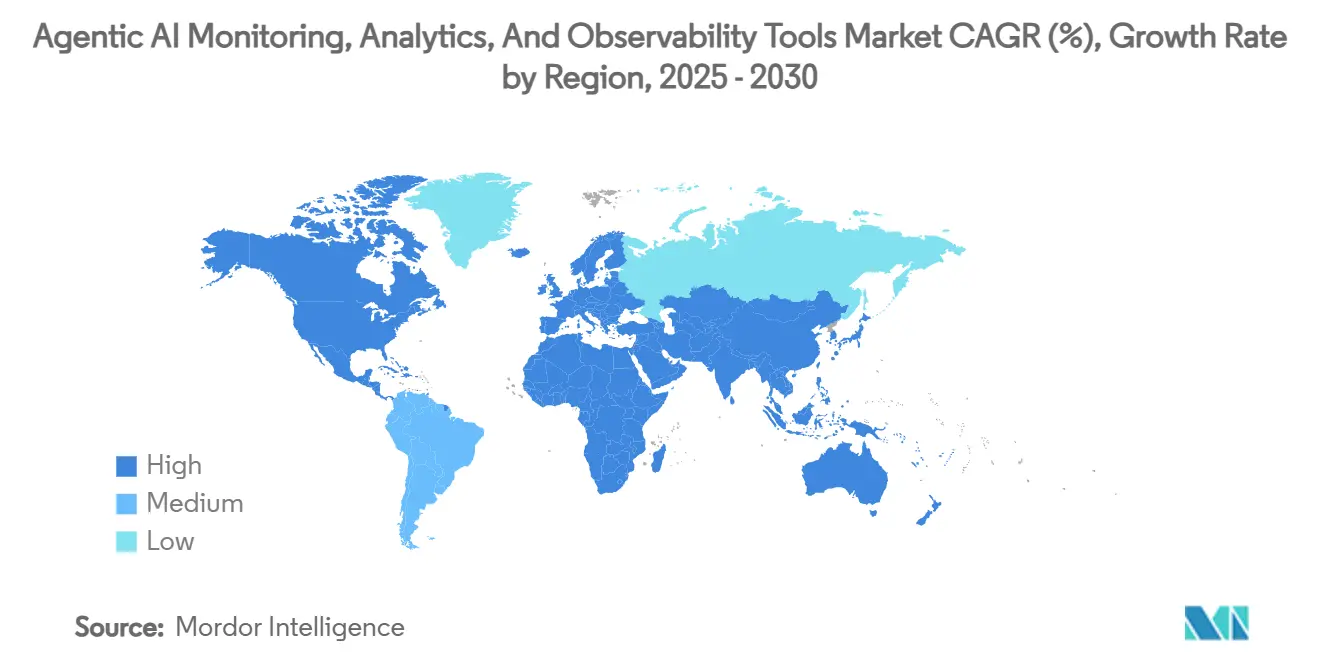
| Fastest Growing Market | Asia Pacific |
| Largest Market | North America |
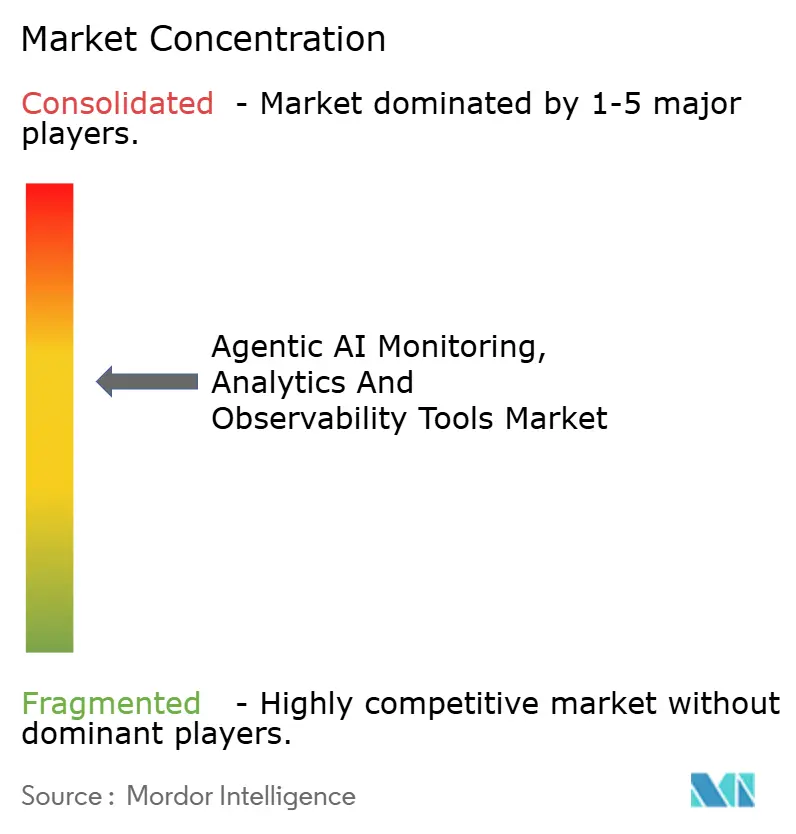
| Market Concentration | Medium |
Major Players *Disclaimer: Major Players sorted in no particular order Image © Mordor Intelligence. Reuse requires attribution under CC BY 4.0. | |
Agentic AI Monitoring, Analytics, And Observability Tools Market Analysis by Mordor Intelligence
The agentic AI monitoring, analytics, and observability tools market size stands at USD 0.55 billion in 2025 and is forecast to touch USD 2.05 billion by 2030, reflecting a 30.10% CAGR during the period. Growth rests on an urgent enterprise need to track the reasoning chains, tool invocations, and evolving workflows of autonomous AI agents in real time. Heightened scrutiny from the EU AI Act and the NIST AI Risk Management Framework pushes organizations toward tamper-proof logging and continuous assurance, especially in regulated verticals. Cloud-native architectures, high-cardinality telemetry, and edge deployments further widen the addressable opportunity as legacy APM products prove inadequate. Vendor strategies now cluster around platform bundling, compliance automation, and guardrail agents that intervene before failures propagate. At the same time, open-source alternatives such as Langfuse pressure incumbents on pricing and data-sovereignty concerns.
Key Report Takeaways
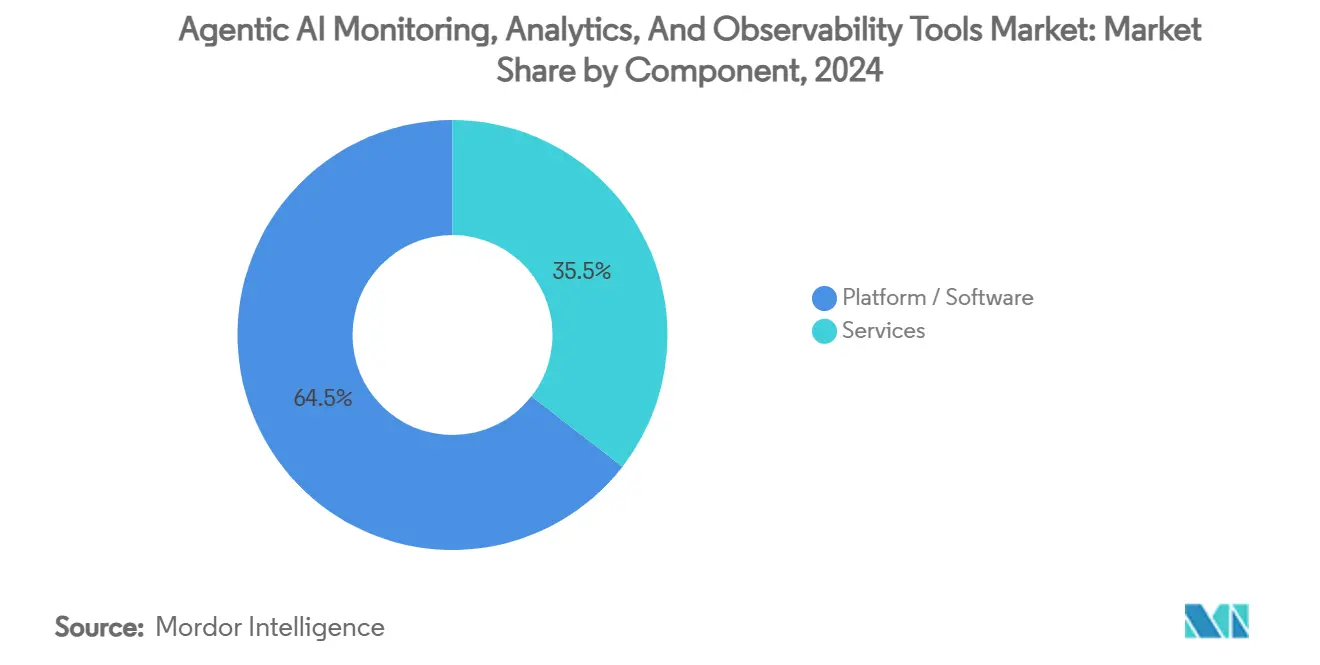
- By component, Platform/Software led with 64.5% revenue share in 2024; Services is projected to expand at a 31.4% CAGR through 2030.
- By deployment model, Cloud-native SaaS captured 59.8% of the agentic AI monitoring, analytics, and observability tools market share in 2024, while Edge and Embedded deployment advances at a 34.9% CAGR to 2030.
- By tool category, LLM/Agent Observability accounted for a 40.1% share of the agentic AI monitoring, analytics, and observability tools market size in 2024, and Security and Compliance Monitoring is rising at a 32.7% CAGR through 2030.
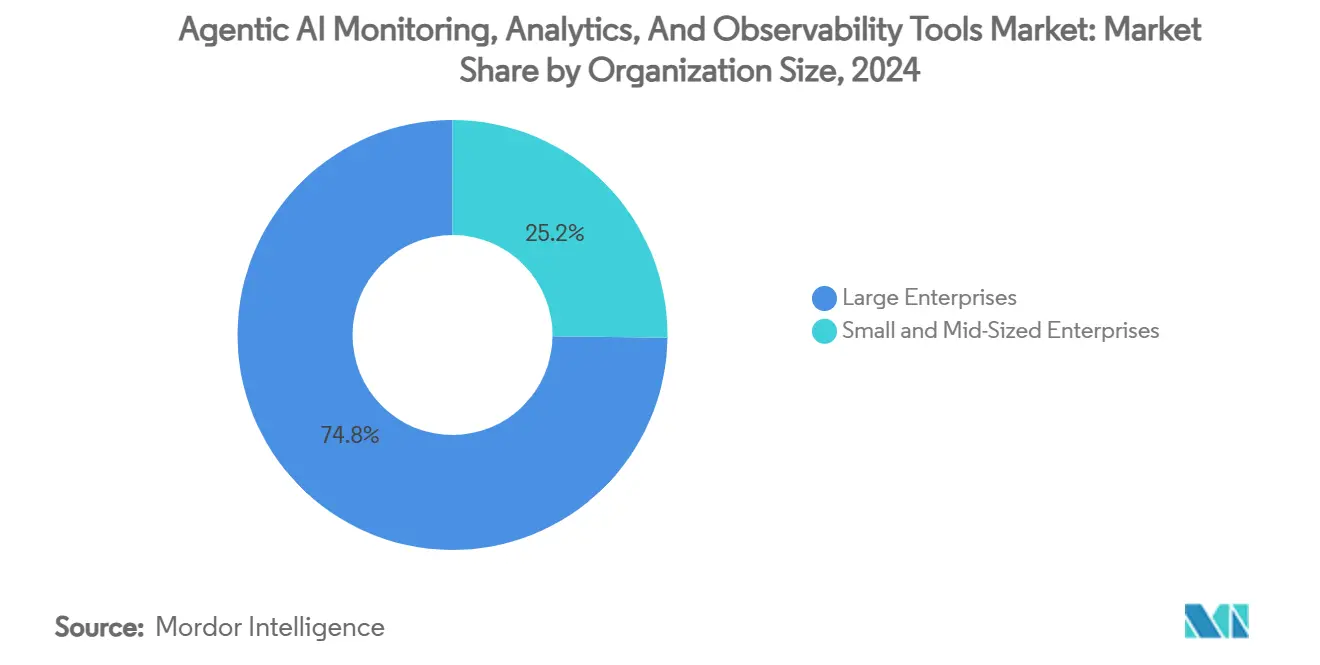
- By organization size, Large Enterprises held 74.8% of the agentic AI monitoring, analytics, and observability tools market size in 2024; SMEs registered the fastest CAGR at 32.4% between 2025-2030.
- By end-use industry, BFSI commanded 34.6% of the agentic AI monitoring, analytics, and observability tools market share in 2024, whereas Healthcare and Life-Sciences exhibit a 33.2% CAGR to 2030.
- By geography, North America held 39.4% of the market size in 2024; Asia-Pacific registered the fastest CAGR at 34.1% between 2025-2030.
Global Agentic AI Monitoring, Analytics, And Observability Tools Market Trends and Insights
Drivers Impact Analysis*
| Driver | (~) % Impact on CAGR Forecast | Geographic Relevance | Impact Timeline |
|---|---|---|---|
| Mainstream GenAI and LLM roll-outs need runtime assurance | +8.2% | Global, North America, and the EU core | Medium term (2-4 years) |
| Tightening AI-specific regulations demand tamper-proof logging | +6.8% | EU primary, North America secondary | Long term (≥ 4 years) |
| Explosion of cloud-native micro-services and high-cardinality telemetry | +5.4% | Global, cloud-first regions | Short term (≤ 2 years) |
| Shift to RAG and agent tool-use raises new observability attack surfaces | +4.7% | North America and EU, Asia-Pacific rising | Medium term (2-4 years) |
| Emergence of enforcement DSLs enabling embedded guardrails | +2.9% | US innovation hubs, EU compliance | Long term (≥ 4 years) |
| Board-level AI fluency programs fund observability budgets | +2.0% | Large enterprises worldwide | Short term (≤ 2 years) |
| Source: Mordor Intelligence | |||
Mainstream GenAI and LLM roll-outs need runtime assurance
Large language model deployments have graduated from pilots to revenue-impacting workloads such as customer support and content generation. Enterprises now require continuous validation of hallucination rates, latency, and resource consumption to avoid customer churn or regulatory fines. Azure AI Foundry Agent Service, introduced in May 2025, exemplifies vendor movement toward built-in agent tracing and metric export designed for multi-agent applications [1]AI Agent Store Editors, “Daily AI Agent News – May 2025,” aiagentstore.ai. Financial services and healthcare users dominate early spending because service failures can trigger compliance violations and patient-safety incidents. This shift reshapes purchasing criteria; platform buyers prioritize reasoning-chain visibility over conventional model accuracy dashboards.
Tightening AI-specific regulations demand tamper-proof logging
The EU AI Act, enforced since August 2024, obliges developers of high-risk AI systems to maintain immutable audit trails and to report serious incidents within defined timelines. Similar guidance from NIST extends those expectations to US-based operators. Healthcare providers face double exposure because sector-specific privacy requirements sit atop the Act’s provisions. Vendors therefore embed compliance templates, hash-chain log sealing, and automated incident workflows. The projected annual compliance cost of USD 29,277 per AI unit encourages off-the-shelf observability contracts rather than in-house builds [2]2021.AI Research, “Understanding the EU AI Act Penalties and Achieving Regulatory Compliance,” 2021.ai.
Explosion of cloud-native micro-services and high-cardinality telemetry
Micro-services, containers, and serverless functions fragment application logic into thousands of ephemeral entities, producing millions of unique time-series. Traditional APM tools cannot correlate this scale of data or decode transformer-based telemetry. The OpenTelemetry community now offers semantic conventions for LLM traces, letting operators stitch together conversations, embeddings, and token-level latencies [3]Uptrace Engineering Blog, “OpenTelemetry for AI Systems: Implementation Guide,” uptrace.dev. High-resolution data feeds power anomaly detection models like Datadog’s Toto, which learns from 350 million observations to surface precursor signals of drift.
Shift to RAG and agent tool-use raises new observability attack-surfaces
Retrieval-augmented generation pipelines combine external knowledge bases with generative models. Malicious actors can poison those sources or inject prompts to manipulate downstream answers. Autonomous agents compound exposure by chaining API calls without human oversight. Observability platforms must therefore monitor data-source integrity, API usage patterns and access privileges alongside model outputs. BFSI adopters insist on lineage tracking to prove that investment reports or credit decisions relied on verified knowledge bases. Specialized vendors now bundle vector-store auditing and agent-policy visualization into single dashboards, expanding market scope for security-centric buyers.
Restraints Impact Analysis*
| Restraint | (~) % Impact on CAGR Forecast | Geographic Relevance | Impact Timeline |
|---|---|---|---|
| Data-sovereignty and privacy fears around prompt/trace storage | −4.1% | EU primary, Asia-Pacific emerging | Medium term (2-4 years) |
| Shortage of staff skilled in LLM/agent telemetry | −3.6% | Global, acute in emerging markets | Long term (≥ 4 years) |
| High total cost of ownership for full-stack observability | −2.7% | SMEs worldwide | Short term (≤ 2 years) |
| Integration complexity with legacy DevOps pipelines | −2.3% | Large multinationals | Medium term (2-4 years) |
| Source: Mordor Intelligence | |||
Data-sovereignty and privacy fears around prompt/trace storage
Enterprises hesitate to export rich agent traces that may embed personal data, trade secrets, or model parameters to multi-tenant SaaS platforms. European controllers operating under GDPR demand local storage or in-country cloud nodes, complicating global roll-outs. Healthcare and finance firms often split deployments, running redacted telemetry to centralized analysis while keeping raw logs on-premises. Emerging privacy-preserving techniques, such as differential privacy, mask sensitive tokens, but adoption remains low due to processing overhead.
Shortage of staff skilled in LLM/agent telemetry
Observability for agentic systems spans DevOps, ML engineering, and security analytics. Talent capable of decoding attention heads, chain-of-thought traces, and hybrid cloud metrics is scarce. Universities lag in updating curricula, and certification programs remain nascent. As a result, many firms outsource monitoring design to professional-services arms of platform vendors, which inflates project timelines and budgets. Skill scarcity is most acute in Latin America, the Middle East, and Tier-2 Asian markets, slowing regional uptake.
*Our forecasts treat driver/restraint impacts as directional, not additive. The impact forecasts reflect baseline growth, mix effects, and variable interactions.
Segment Analysis
By Component: Services outpace in growth as platforms scale
Platform solutions dominated 2024 revenue with a 64.5% share of the agentic AI monitoring, analytics, and observability tools market size as buyers favored integrated stacks covering log ingestion, trace analytics, and policy engines. However, Services log a 31.4% CAGR through 2030, reflecting demand for customization, integration, and managed runbooks. Financial institutions and public-sector agencies often contract specialist firms to align platform outputs with internal governance playbooks. Complexities multiply when edge nodes or air-gapped networks are involved, reinforcing services pull.
Implementation partners build connectors between reasoning-chain telemetry and traditional SIEM, design escalation flows for guardian agents, and train staff on prompt-trace triage. Managed detection offerings appeal to SMEs lacking round-the-clock engineering teams. As autonomous agents spread into middle-office processes, incident response becomes business-critical, deepening reliance on external expertise. Consequently, vendor ecosystems increasingly resemble cybersecurity MSSP models rather than classical software maintenance contracts.


By Deployment Model: Edge momentum challenges cloud hegemony
Cloud-native SaaS still owns 59.8% of the agentic AI monitoring, analytics, and observability tools market share thanks to frictionless onboarding and instant scalability. Yet Edge and Embedded deployments sprint ahead at 34.9% CAGR as sovereignty AI regulations force inference to occur near data sources. Retailers, airlines, and telcos push inference closer to end users to cut latency below 50 milliseconds and keep proprietary data behind corporate firewalls.
Edge scenarios create novel telemetry gaps. Devices may operate offline for hours, then burst upload compressed traces. Observability platforms have responded with adaptive sampling and on-device anomaly detection agents that flag policy breaches even without connectivity. Hybrid rollouts blend regional cloud hubs with fleet-level gateways, demanding federated dashboards that reconcile local and global views. These requirements widen the addressable base for platform-agnostic, agent-centric monitoring suites.
By Tool Category: Security and compliance enter hyper-growth
LLM/Agent Observability tools commanded 40.1% of 2024 revenue, cementing their status as the core buying center. Infrastructure and APM modules remain essential for resource utilization tracking, but risk commoditization. Security and Compliance Monitoring, only 10% of spend today, is the fastest climber at 32.7% CAGR, as regulators and insurers demand proof that AI outputs cannot be tampered with.
Security-first offerings embed guardrail agents that execute kill switches when anomalies breach thresholds. They integrate with enforcement DSLs such as AgentSpec, allowing policy authors to define permissible tool invocations or data sources. Demand also rises for cryptographic attestation of inference logs, creating overlap with zero-trust initiatives. Traditional SIEM vendors eye the niche but must ingest novel payloads like chain-of-thought tokens and embedding vectors, which stretch legacy schemas.
By Organization Size: SMEs narrow the capability gap
Large Enterprises captured 74.8% of 2024 spending due to ample budgets and board-mandated AI assurance programs. Yet SMEs post a 32.4% CAGR, fast closing capability gaps as SaaS pricing tiers democratize advanced observability. Surveys show 18% of SMEs already deploy generative AI, and 72% use data-driven decisions, creating fertile ground for lightweight monitoring [4]OECD Policy Division, “SME Digitalisation to Manage Shocks and Transitions,” oecd.org.
SMEs demand turnkey dashboards, pay-as-you-grow telemetry quotas, and AI-assisted configuration. Vendors respond with opinionated templates that auto-detect LLM providers and surface baseline safety metrics. Managed services bundles counteract skills shortages, while marketplace integrations with productivity suites lower switching costs. Over the forecast window, feature parity between enterprise and SME editions will erode price differentials, expanding total addressable uptake.
By End-use Industry: Healthcare rivals BFSI for growth spotlight
BFSI held a 34.6% share in 2024, driven by stringent audit trails for trading algorithms and fraud detection. Regulators require immutable logging of model decisions and risk-score rationales, which align with agentic observability capabilities. Healthcare and Life-Sciences, with a 15% base, accelerates at 33.2% CAGR through 2030 as hospitals adopt continuous patient-monitoring AI that must prove reliability to clinicians.
Clinical deployments introduce tough latency and privacy constraints. Observability agents must redact protected health information yet retain enough context for root-cause analysis. Life-science researchers also log reagent provenance in AI-driven drug-discovery workflows, extending monitoring beyond code to lab equipment. Retail, Government, and Automotive segments follow with personalized commerce, citizen-service chatbots, and autonomous vehicle stacks, respectively, each layering sector-specific governance onto baseline telemetry.
Geography Analysis
North America generated 39.4% of 2024 revenue for the agentic AI monitoring, analytics, and observability tools market. Early adoption stems from venture-backed startups and established hyperscalers expanding platform portfolios. Datadog, Splunk, and Dynatrace rally existing customers by weaving LLM traces into familiar dashboards, while West Coast VC financing fuels newcomers such as Lightrun and LangChain.
Asia-Pacific leads in expansion at 34.1% CAGR. Governments subsidise cloud capacity and AI talent, doubling regional data-centre footprints within five years. South Korea and Japan modernise telecom cores with agentic network optimisers, while Singaporean banks pilot guardian-agent frameworks. China’s domestic vendors, aligned with local cloud ecosystems, compete fiercely on price and data-residency assurances. India and Indonesia present long-tail upside as digital-public-goods programmes seed AI literacy.
Europe's growth is propelled by the EU AI Act. German automakers instrument driver-assist agents, and Nordic banks log autonomous credit decisions. Privacy mandates tilt deployments toward on-premises or hybrid topologies, fostering demand for open-source stacks like Langfuse that minimise outbound data. Growth is slower than in Asia-Pacific, yet steady as compliance deadlines phase in across member states.

Competitive Landscape
Incumbent observability giants pursue feature expansion to retain accounts. Cisco’s USD 28 billion Splunk buyout fuses security analytics with AI tracing, signalling the convergence of cyber and agentic monitoring. Datadog responds through open-weights Toto and community benchmarks, courting developers while upselling enterprise guardrails [5]Datadog Investor Relations, “Datadog AI Research Launches New Open-Weights AI Foundation Model and Observability Benchmark,” datadoghq.com.
Specialised vendors differentiate on the depth of LLM insights. Arize AI visualises embedding drift, Fiddler Labs automates bias alerts, and LangChain embeds tracing into agent frameworks. Consolidation accelerates: Coralogix acquired Aporia to blend log analytics with LLM evaluation, and Arize AI purchased Velvet to extend auto-grading. Despite M&A, the top five suppliers still account for under 40% of global revenue, leaving room for open-source communities.
White-space innovation skews toward edge observability, guardian agents, and policy DSLs. Startups like Patronus AI ship agent failure detection engines, while Invariant Labs debuts Guardrails that enforce contextual security rules. Traditional SIEM players and cloud providers chase the niche, hinting at cross-layer platform wars over the next three years. Vendor lock-in fears keep procurement cycles agile, pushing buyers to pilot multiple tools before consolidation.
Agentic AI Monitoring, Analytics, And Observability Tools Industry Leaders
Datadog Inc.
Dynatrace Inc.
New Relic Inc.
Splunk Inc. (Cisco Systems, Inc.)
Amazon Web Services, Inc.
- *Disclaimer: Major Players sorted in no particular order

Recent Industry Developments
- July 2025: NVIDIA introduced Helix Parallelism to speed large-context inference by 32× on Blackwell GPUs, reducing observability blind spots during long-running chains.
- May 2025: Datadog launched Toto, an open-weights foundation model and the BOOM benchmark, anchoring AI-native anomaly detection.
- May 2025: Patronus AI unveiled Percival to monitor failing autonomous agents at enterprise scale.
- April 2025: Lightrun raised USD 70 million for AI-based production debugging tools.


Global Agentic AI Monitoring, Analytics, And Observability Tools Market Report Scope
| Platform / Software |
| Services |
| Cloud-native (SaaS) |
| On-premises |
| Hybrid and Multi-cloud |
| Edge and Embedded |
| LLM / Agent Observability |
| MLOps and Model Monitoring |
| Infrastructure / APM Observability |
| Security and Compliance Monitoring |
| Large Enterprises |
| Small and Mid-Sized Enterprises |
| IT and Telecom |
| BFSI |
| Healthcare and Life-Sciences |
| Retail and E-commerce |
| Government and Defence |
| Automotive and Mobility |
| North America | United States | |
| Canada | ||
| Mexico | ||
| South America | Brazil | |
| Argentina | ||
| Rest of South America | ||
| Europe | Germany | |
| United Kingdom | ||
| France | ||
| Italy | ||
| Spain | ||
| Russia | ||
| Rest of Europe | ||
| Asia-Pacific | China | |
| Japan | ||
| India | ||
| South Korea | ||
| Australia and New Zealand | ||
| Rest of Asia-Pacific | ||
| Middle East and Africa | Middle East | Saudi Arabia |
| United Arab Emirates | ||
| Turkey | ||
| Rest of Middle East | ||
| Africa | South Africa | |
| Nigeria | ||
| Egypt | ||
| Rest of Africa | ||
| By Component | Platform / Software | ||
| Services | |||
| By Deployment Model | Cloud-native (SaaS) | ||
| On-premises | |||
| Hybrid and Multi-cloud | |||
| Edge and Embedded | |||
| By Tool Category | LLM / Agent Observability | ||
| MLOps and Model Monitoring | |||
| Infrastructure / APM Observability | |||
| Security and Compliance Monitoring | |||
| By Organisation Size | Large Enterprises | ||
| Small and Mid-Sized Enterprises | |||
| By End-use Industry | IT and Telecom | ||
| BFSI | |||
| Healthcare and Life-Sciences | |||
| Retail and E-commerce | |||
| Government and Defence | |||
| Automotive and Mobility | |||
| By Geography | North America | United States | |
| Canada | |||
| Mexico | |||
| South America | Brazil | ||
| Argentina | |||
| Rest of South America | |||
| Europe | Germany | ||
| United Kingdom | |||
| France | |||
| Italy | |||
| Spain | |||
| Russia | |||
| Rest of Europe | |||
| Asia-Pacific | China | ||
| Japan | |||
| India | |||
| South Korea | |||
| Australia and New Zealand | |||
| Rest of Asia-Pacific | |||
| Middle East and Africa | Middle East | Saudi Arabia | |
| United Arab Emirates | |||
| Turkey | |||
| Rest of Middle East | |||
| Africa | South Africa | ||
| Nigeria | |||
| Egypt | |||
| Rest of Africa | |||


Key Questions Answered in the Report
What is the projected size of the agentic AI monitoring, analytics and observability tools market in 2030?
The market is forecast to reach USD 2.05 billion by 2030.
Which deployment model grows fastest between 2025 and 2030?
Edge and Embedded deployments expand at a 34.9% CAGR as data-sovereignty and latency demands surge.
Why are security-focused observability tools gaining traction?
Regulators and insurers require proof that AI outputs remain untampered, driving 32.7% CAGR for Security and Compliance Monitoring solutions.
Which geography offers the highest growth opportunity?
Asia-Pacific posts the strongest growth momentum at 34.1% CAGR due to large-scale data-centre expansion and government digital programmes.
Page last updated on:


