Africa Used Car Market Size and Share
Market Overview
| Study Period | 2019 - 2031 |
|---|---|
| Forecast Data Period | 2026 - 2031 |
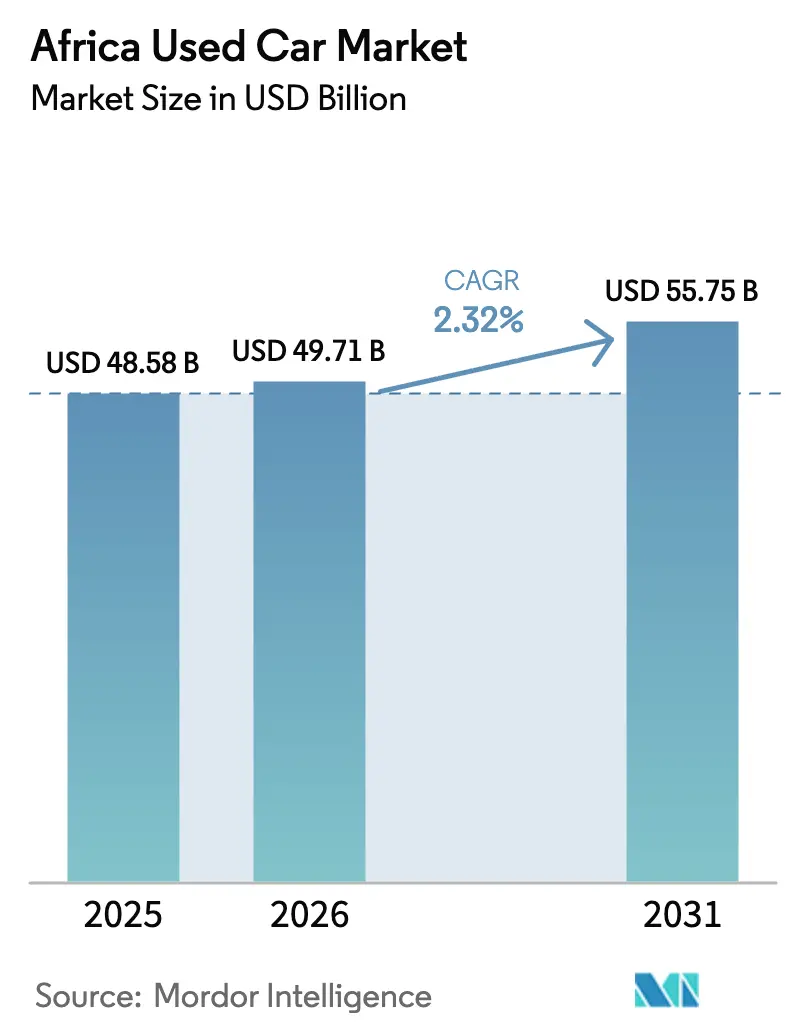
| Base Year Market Size (2025) | USD 48.58 Billion |
| Market Size (2026) | USD 49.71 Billion |
| Market Size (2031) | USD 55.75 Billion |
| Growth Rate (2026 - 2031) | 2.32% CAGR |
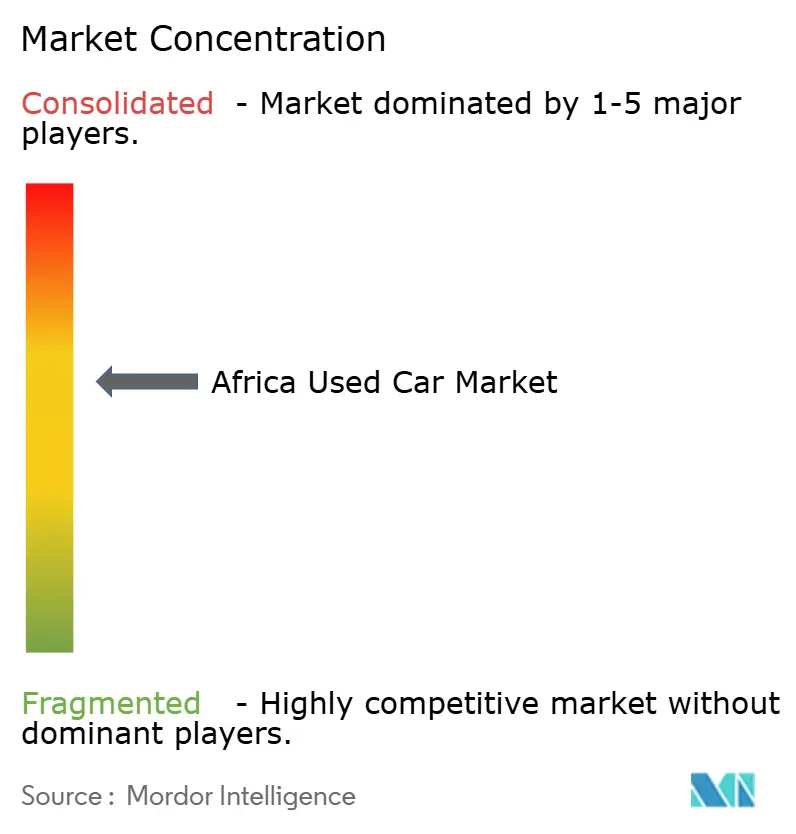
| Market Concentration | Medium |
Major Players
*Disclaimer: Major Players sorted in no particular order Image © Mordor Intelligence. Reuse requires attribution under CC BY 4.0. |
|
Africa Used Car Market Analysis by Mordor Intelligence
The African used car market size is expected to grow from USD 48.58 billion in 2025 to USD 49.71 billion in 2026, and is forecast to reach USD 55.75 billion by 2031 at a 2.32% CAGR over 2026-2031. Structural shifts underpin this steady trajectory. As mobile penetration increases in Sub-Saharan Africa, digital-only retailers are experiencing significant growth. In contrast, physical franchise dealerships, which still account for a substantial share of revenue, face shrinking margins. This decline is driven by price-transparency platforms and stricter import age regulations, which encourage buyers to opt for newer inventory. Organized vendors are expanding steadily, supported by warranty-backed transactions that appeal to risk-averse consumers. This growth contrasts sharply with the minimal progress observed among unorganized vendors. Demand is primarily driven by body-on-frame SUVs and MUVs, a trend influenced by challenging rural roads and multi-generational travel needs. While petrol engines remain dominant, hybrids and EVs are gaining traction. This shift is supported by regulatory measures, such as bans on internal combustion engines and certifications that verify that imported goods meet specific standards.
Key Report Takeaways
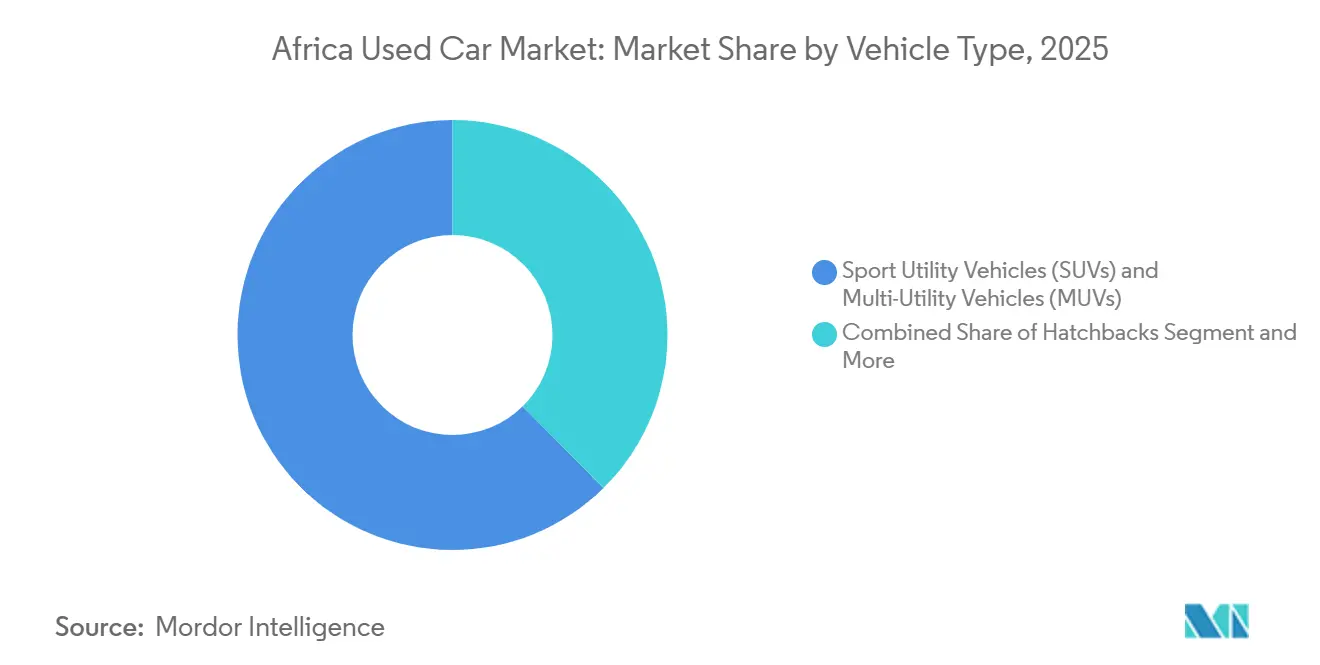
- By vehicle type, sport utility vehicles (SUVs) and multi-utility vehicles (MUVs) led the African used car market with 62.39% share in 2025, and the same segment is projected to record the fastest 4.86% CAGR through 2031.
- By fuel type, petrol models held 68.33% share in 2025, whereas hybrids and EVs are forecast to expand at an 8.21% CAGR between 2026 and 2031.
- By price segment, models under the range of USD 5,500–10,999 captured 45.82% share in 2025; the USD 11,000–21,999 bracket is advancing at the highest 5.85% CAGR to 2031.
- By sales channel, physical franchise dealerships commanded a 49.52% share in 2025, while digital pure-play retailers are scaling at a 10.65% CAGR through 2031.
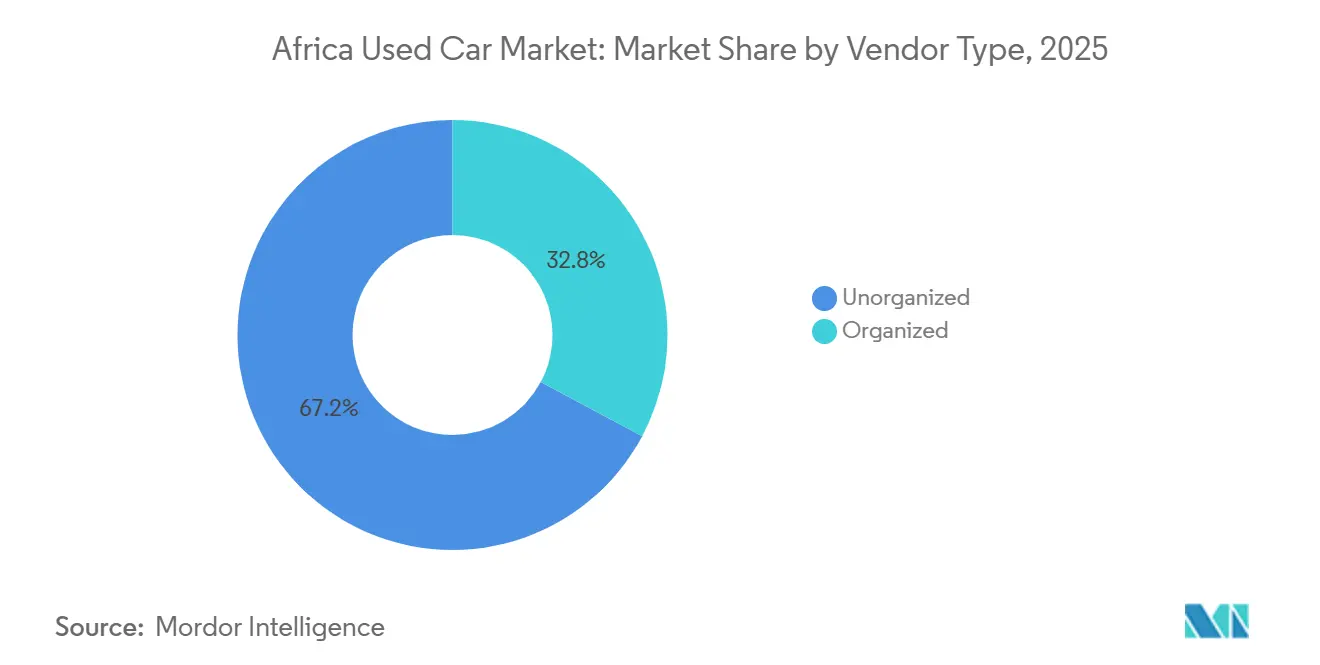
- By vendor type, unorganized independents retained a 67.22% share in 2025, yet organized dealerships are moving fastest with a 4.72% CAGR over 2026-2031.
- By vehicle age, 3-to-5-year units secured 39.46% share in 2025, whereas the 0-to-2-year cohort is projected to post the top 3.87% CAGR to 2031.
- By country, South Africa accounted for 29.18% of regional revenue in 2025, while Uganda is set to deliver the fastest 5.11% CAGR through 2031.
Note: Market size and forecast figures in this report are generated using Mordor Intelligence’s proprietary estimation framework, updated with the latest available data and insights as of 2026.
Proportional positioning is established by comparing regional contributions against the global total, including that of Africa. The used car market share in our global report expresses these relative weights.
Africa Used Car Market Trends and Insights
Drivers Impact Analysis*
| Driver | (~) % Impact on CAGR Forecast | Geographic Relevance | Impact Timeline |
|---|---|---|---|
| Cost of New Cars and Affordability | +0.8% | Nigeria, Kenya, Ghana, South Africa | Medium term (2-4 years) |
| Expansion of Vehicle-Financing | +0.6% | South Africa, Kenya, Nigeria; emerging in Ethiopia, Tanzania | Medium term (2-4 years) |
| Internet Penetration and Online Classifieds | +0.5% | Lagos, Nairobi, Johannesburg, Cairo | Short term (≤ 2 years) |
| Urbanization Driving Mobility Demand | +0.4% | Sub-Saharan Africa core cities | Long term (≥ 4 years) |
| Euro-Spec Hybrid/EV Used Cars | +0.3% | Ethiopia, Kenya, South Africa | Medium term (2-4 years) |
| OEM-Certified Pre-Owned Programs | +0.2% | South Africa, Kenya; expanding to Nigeria, Morocco | Medium term (2-4 years) |
| Source: Mordor Intelligence | |||


High Cost of New Cars and Affordability Gap
New vehicles frequently sell for significantly more than the median household income, bolstering the demand for second-hand cars. A new Nissan Sentra in South Africa is priced substantially higher than the average used-car price, highlighting that even high-end pre-owned vehicles are more affordable than mid-range new ones. In Nigeria, new car sales represent only a small fraction of the broader automotive market, with the majority being used imports. A tariff reduction in Algeria has made Chinese used cars much more affordable, causing their market share to surge significantly. Meanwhile, regional assembly plants struggle to compete with the landed costs of older Japanese imports, keeping the affordability gap.
Expansion of Vehicle-financing Options
While penetration remains low in many markets, specialized products are targeting the mid-range price segment. In Kenya, banks are now offering loans with flexible down payments, varying terms, and competitive interest rates. Meanwhile, in South Africa, reductions in lending rates have revitalized balloon-payment deals, especially when paired with extended warranties. In a strategic move, CFAO Mobility partnered with Moove to introduce asset-backed loans for ride-hail drivers in Nigeria and Ghana, effectively turning cars into revenue-generating assets. Looking ahead, standardized credit bureau regulations under the AfCFTA might lead to more favorable credit rates.
Growing Internet Penetration and Online Classifieds
Internet penetration in Sub-Saharan Africa has significantly increased, and smartphone ownership has grown substantially in major cities. This digital growth has enabled online retailers to drive strong expansion of the African used-car market. AutoTrader has experienced a notable surge in traffic. Cars45 has merged with Jiji, consolidating Nigeria’s leading classifieds and supported by multiple physical inspection centers. Sylndr, based in Egypt, has secured funding to enhance its AI-driven pricing engine, which eliminates uncertainties in price negotiations. Increased transparency has reduced dealer margins but has successfully attracted first-time buyers who were previously hesitant about informal car lots.
Rapid Urbanization Driving Mobility Demand
Africa’s urban population is projected to reach 1.4 billion by 2050, creating metropolitan clusters where personal mobility offsets limited public transit [1]"Africa's Urbanisation Dynamics 2025", Organisation for Economic Co-operation and Development, oecd.org. Africa's urban population is expected to grow significantly, driving an increased need for individual mobility. Urbanization rates are steadily rising across cities and towns, with major urban centers such as Lagos, Nairobi, and Johannesburg experiencing substantial annual population growth. Additionally, car ownership in Africa is associated with greater employment opportunities and shorter commute times, highlighting the strong and sustained demand for the continent's used-car market.
Restraints Impact Analysis*
| Restraint | (~) % Impact on CAGR Forecast | Geographic Relevance | Impact Timeline |
|---|---|---|---|
| Import-age and Emissions Rules | -0.6% | Kenya, Nigeria, Ghana | Short term (≤ 2 years) |
| Export Bans in Source Countries | -0.4% | Japan-Africa corridor | Medium term (2-4 years) |
| Digital Transparency Squeezes Profit Margins | -0.3% | Urban Africa | Short term (≤ 2 years) |
| Weak After-sales Service Network | -0.2% | Sub-Saharan Africa (ex-SA) | Long term (≥ 4 years) |
| Source: Mordor Intelligence | |||
Stringent Import-age and Emissions Rules
Kenya enforces an eight-year age cap and tighter 2025 emissions standards that lifted import prices 10-20% [2]“Kenya’s 2025 Vehicle Age Rule,”, AutosKenya, autoskenya.com. Nigeria has increased tariffs, while Ghana has imposed restrictions on importing vehicles older than ten years. These regulatory shifts are creating a patchwork of rules that are pinching dealer margins tightly. Though policymakers are pursuing strategies to stimulate local vehicle assembly, the immediate consequence has been a constricted supply that dampens short-term growth in the used car market across Africa.
Export Bans in Source Countries
Japan's move to restrict exports to Russia has sparked worries about possible similar measures affecting shipments to Africa. Such restrictions could have far-reaching implications for Africa's trade dynamics, given its reliance on imports for various sectors, including automotive and machinery. The Netherlands, after finding that many departing vehicles had misrepresented their condition, mandated pre-export inspections. These inspections aim to ensure compliance with international standards and prevent the entry of substandard goods into global markets. A united front by G7 nations threatens to disrupt a significant chunk of Africa's import supply chain, casting doubt on the region's projected growth rate. This potential disruption could hinder the development of key industries and slow economic progress across the continent.
*Our forecasts treat driver/restraint impacts as directional, not additive. The impact forecasts reflect baseline growth, mix effects, and variable interactions.
Segment Analysis
By Vehicle Type: SUVs and MUVs Drive Market Dominance and Growth
Sport utility vehicles (SUVs) and multi-utility vehicles (MUVs) captured 62.39% of the African used-car market share in 2025 and will grow at a 4.86% CAGR through 2031. Body-on-frame models, like the Toyota Highlander and Ford Explorer, dominate the volume, proving their mettle on unpaved roads. While sedans maintain a presence in urban centers, they're losing traction as buyers shift towards peri-urban areas with gravel access. Hatchbacks are pulling back, sidelined by import-age ceilings that affect older Japanese models. The market for used SUVs in Africa is set to expand, driven by Euro-spec hybrids boasting better fuel economy and Kenya's stringent emissions policies phasing out older sedans.
Middle-class families, valuing versatility for both weekday commutes and weekend cargo, are gravitating towards seven-seat SUVs. In a strategic move, BAIC is setting up an assembly in South Africa, targeting corporate shuttle fleets. Regulatory pressures, though indirect, pack a punch; enforcement in Kenya snagged non-registered sedans, inadvertently boosting demand for compliant SUVs.


By Fuel Type: Petrol Dominance Faces Electric Disruption
Petrol models accounted for 68.33% of the African used-car market in 2025, but hybrids and EVs are advancing at an 8.21% CAGR. As South African low-emission zones clamp down on pre-Euro 5 engines, diesel's market share finds itself at a standstill. While electric vehicle adoption is closely tied to the availability of charging stations, Kenya has only a few public fast chargers, while South Africa has slightly more. Ethiopia's surprising policy shift highlights the potential: a significant portion of its vehicle registrations were electric.
Set to debut in the near future, Morocco's Gotion battery plant is poised to offer replacements at competitive costs, bolstering confidence in residual values. While petrol continues to penetrate every rural nook, creating a logistical advantage, electric vehicles will only bridge this gap once the African Development Bank's grid projects come to fruition.
By Price Segment: Mid-Range Vehicles Dominate Affordable Mobility
The USD 5,500–10,999 tier accounted for 45.82% in 2025, yet has risen only slowly because import ceilings raise compliance costs. Conversely, the USD 11,000–21,999 slice grows at 5.85% as lenders finance aspiring buyers. In the African used-car market, a burgeoning middle segment is emerging. This segment not only meets collateral requirements but also offers a respite from the shock of new-car prices. While older units grapple with customs barriers, transactions in the lower price range are thriving. Conversely, the premium tier holds a modest market share.
Due to Algeria's tariff cuts, imports have found a sweet spot in the mid-price bracket, highlighting the significant impact of policy on pricing. Meanwhile, CFAO-Moove's ride-hailing loans are invigorating this financeable middle, turning cars into lucrative revenue streams.
By Sales Channel: Digital Momentum, Physical Scale
Physical dealerships still capture 49.52% of the African used-car market, but online pure-plays grow by 10.65% annually. Classified portals like AutoTrader have experienced growth, driven by smartphones streamlining the search process. Dealer-owned platforms that balance credibility and convenience are also advancing steadily. Independent lots, focusing on quick cash sales, face challenges from tightening regulations. Meanwhile, auctions cater to wholesalers and fleet disposals, maintaining their role in the market.
Cars45 and Jiji's merged marketplace is breaking down trust barriers in West Africa by combining online discovery with on-site inspections. Similarly, WeBuyCars' Inspectify enhances throughput efficiency through automated damage reports, showcasing how technology integration bolsters physical networks.
By Vendor Type: Organized Dealers Win Trust Premium
Unorganized independents maintained a 67.22% share in 2025. Organized dealers grow at a 4.72% CAGR as warranties and financing lure cautious buyers. Kenya’s penalties for unregistered vehicles highlight compliance challenges impacting informal players. WeBuyCars’ debut on the JSE demonstrated investor confidence in the organized model, with plans to significantly increase monthly throughput in the coming years.
Digital middle-ground platforms such as Autochek bridge segments by offering escrow services and inspections. This approach reduces the dominance of traditional cash lots and accelerates the transformation of Africa's used car market.
By Vehicle Age: Younger Stock Gains Ground
Units aged 3–5 years accounted for 39.46% of the market in 2025, balancing price with reliability. The 0–2-year slice grows 3.87% as Ethiopian EV imports and South African lease returns inject fresh inventory.
Kenya's ceiling and ECOWAS proposals have restricted the influx of older vehicles, leading to a decline in that segment. These regulatory measures aim to reduce environmental pollution and promote the adoption of newer, more efficient cars. In contrast, the African used-car market is placing a premium on younger vehicles, with organized dealers refurbishing and certifying them to enhance resale value. This shift reflects a growing consumer preference for reliable and environmentally friendly options, further driving demand for certified pre-owned vehicles.
Geography Analysis
South Africa accounted for 29.18% of Africa's used-car market share in 2025. With a significant vehicle parc and mature auctions moving cars monthly, the market is bustling. Digital engagement is on the rise, as evidenced by AutoTrader's substantial growth in site visits over the past few years. However, dealers face challenges with illicit cross-border inflows through Mozambique, which erode their margins. North Africa, comprising Morocco, Algeria, and Egypt, collectively accounts for a notable portion of the market's value. A tariff cut in Algeria allowed Chinese brands to significantly boost their market share, reshaping the competitive landscape. Furthermore, Morocco's Gotion plant is set to establish the region as an EV battery hub in the near future.
East Africa, with Uganda pacing the continent at 5.11% CAGR, buoyed by Tanzania’s Dar es Salaam port funneling Zimbabwean trans-shipments that load Kampala lots. Kenya recently registered a significant number of vehicles in a short period, marking a shift towards formal channels. Meanwhile, Ethiopia's ban on internal combustion engines is pushing its inventory towards battery-powered models, a move likely to influence neighboring countries. West Africa boasts a significant market share, driven primarily by Nigeria's robust vehicle market. The merger between Cars45 and Jiji is further accelerating the region's digital transformation.
Markets in the rest of Africa, including Botswana, Zambia, and Zimbabwe, command a notable share and are witnessing steady growth, thanks in part to the AfCFTA's efforts to reduce tariff frictions. With Congo and Zambia being key suppliers of cobalt and copper, the region's stakes in the EV supply chain are undeniably rising. In a significant move, Afreximbank struck an accord with AAAM, aiming to alleviate automotive financing challenges, heralding a promising medium-term uplift.
Mordor Intelligence examines the used car market across diverse other regional markets as well, offering granular country-level perspectives for Ethiopia, Nigeria, Kenya, Tanzania, South Africa, Egypt, Norway, Myanmar, and Switzerland and more.
Competitive Landscape
The African used-car market shows moderate fragmentation: organized groups command a significant share of formal-sector volumes, while thousands of informal street-corner traders and import brokers transact the remainder. South Africa’s WeBuyCars captures scale economies through nationwide “car supermarket” formats.
WeBuyCars, following its recent IPO, aims to significantly increase monthly sales in the coming years [3]“Prospectus 2024,”, WeBuyCars, webuycars.co.za. AutoTrader continues to dominate South Africa's classified traffic, experiencing consistent growth in shopper activity. CFAO Mobility, utilizing its OEM expertise, has strengthened its position with pre-owned certifications and robust vehicle sales. Autochek, with an extensive dealer network spanning multiple countries, is optimizing its supply chain to enable seamless credit assessments. The merger of Cars45 and Jiji has established West Africa's largest digital marketplace, emerging as a strong competitor through AI-driven pricing strategies and advanced inspection centers.
OEM-certified programs add another competitive layer. Toyota’s Automark and Nissan Intelligent Choice sweep across franchise lots, recycling trade-ins into certified pipelines that uphold residual values. Organized dealers rely on analytics to optimize stocking mix and price elasticity, while informal traders face shrinking arbitrage as border digitization curbs undervaluation practices. White space remains in after-sales: rural repair networks and spare-parts distribution offer margin upside for players willing to invest beyond metropolitan hubs.
Africa Used Car Industry Leaders
-
Autochek Africa
-
AutoTrader South Africa
-
WeBuyCars (Pty) Ltd
-
Jiji Cars
-
YallaMotor
- *Disclaimer: Major Players sorted in no particular order

Recent Industry Developments
- June 2025: Peach Cars secured USD 11 million to transform the used-car retail landscape in Kenya, Nigeria, and Ghana through digitization. This funding aims to streamline the buying and selling process of used cars by leveraging technology, enhancing customer experience, and improving operational efficiency. The initiative is expected to address challenges in the traditional used-car market, such as a lack of transparency and inefficiencies, while fostering growth in the automotive retail sector across these regions.
- May 2025: Yitongda, a top exporter of used vehicles in China, actively participated in the Nigerian Auto Show held in Lagos. The company showcased a range of popular vehicle models and comprehensive export service solutions, highlighting its commitment to meeting the growing demand for used vehicles in the Nigerian market.


Africa Used Car Market Report Scope
The scope includes segmentation by vehicle type (hatchbacks, sedans, and sport utility vehicles and multi-purpose vehicles), fuel type (petrol, diesel, hybrid and electric, and others (LPG, CNG, etc.)), price segment (below USD 5,500, USD 5,500-10,999, USD 11,000 – 21,999, and ≥ USD 22,000), sales channel (online digital classified portals, pure-play e-retailers, dealer/OEM online platforms, physical franchise dealerships, independent used-car lots, auction houses (physical and online hybrid), and peer-to-peer (private) sales), vendor type (organized and unorganized), vehicle age (0 -2 years, 3-5 years, 6-8 years, and above 8 years). The analysis also covers country-level segmentation, including South Africa, Morocco, Algeria, Egypt, Nigeria, Ghana, Kenya, Ethiopia, Tanzania, Uganda, and the rest of Africa. Market size and growth forecasts are presented by value in USD and by volume in units.
| Hatchbacks |
| Sedans |
| Sport Utility Vehicles (SUVs) and Multi-Utility Vehicles (MUVs) |
| Petrol |
| Diesel |
| Hybrid and Electric |
| Others (LPG, CNG, etc.) |
| Below USD 5,500 |
| USD 5,500 – 10,999 |
| USD 11,000 – 21,999 |
| ≥ USD 22,000 |
| Online Digital Classified Portals |
| Pure-play e-Retailers |
| Dealer/OEM Online Platforms |
| Physical Franchise Dealerships |
| Independent Used-Car Lots |
| Auction Houses (Physical and Online Hybrid) |
| Peer-to-Peer (Private) Sales |
| Organized |
| Unorganized |
| 0 -2 Years |
| 3-5 Years |
| 6-8 Years |
| Above 8 Years |
| South Africa |
| Morocco |
| Algeria |
| Egypt |
| Nigeria |
| Ghana |
| Kenya |
| Ethiopia |
| Tanzania |
| Uganda |
| Rest of Africa |
| By Vehicle Type | Hatchbacks |
| Sedans | |
| Sport Utility Vehicles (SUVs) and Multi-Utility Vehicles (MUVs) | |
| By Fuel Type | Petrol |
| Diesel | |
| Hybrid and Electric | |
| Others (LPG, CNG, etc.) | |
| By Price Segment | Below USD 5,500 |
| USD 5,500 – 10,999 | |
| USD 11,000 – 21,999 | |
| ≥ USD 22,000 | |
| By Sales Channel | Online Digital Classified Portals |
| Pure-play e-Retailers | |
| Dealer/OEM Online Platforms | |
| Physical Franchise Dealerships | |
| Independent Used-Car Lots | |
| Auction Houses (Physical and Online Hybrid) | |
| Peer-to-Peer (Private) Sales | |
| By Vendor Type | Organized |
| Unorganized | |
| By Vehicle Age | 0 -2 Years |
| 3-5 Years | |
| 6-8 Years | |
| Above 8 Years | |
| By Country | South Africa |
| Morocco | |
| Algeria | |
| Egypt | |
| Nigeria | |
| Ghana | |
| Kenya | |
| Ethiopia | |
| Tanzania | |
| Uganda | |
| Rest of Africa |


Key Questions Answered in the Report
What is the projected value of the Africa used car market in 2031?
The sector is expected to reach USD 55.75 billion by 2031.
Which country is the largest single market for used cars in Africa?
South Africa held 29.18% of continental revenue in 2025.
Which segment is growing fastest within the Africa used car market?
Hybrid and electric vehicles are advancing at an 8.21% CAGR through 2031.
Why are SUVs favored over sedans in Africa?
Poor rural roads and multipurpose family transport needs drive demand for high-clearance, body-on-frame SUVs.
Page last updated on:


