Market Overview
| Study Period | 2020 - 2031 |
|---|---|
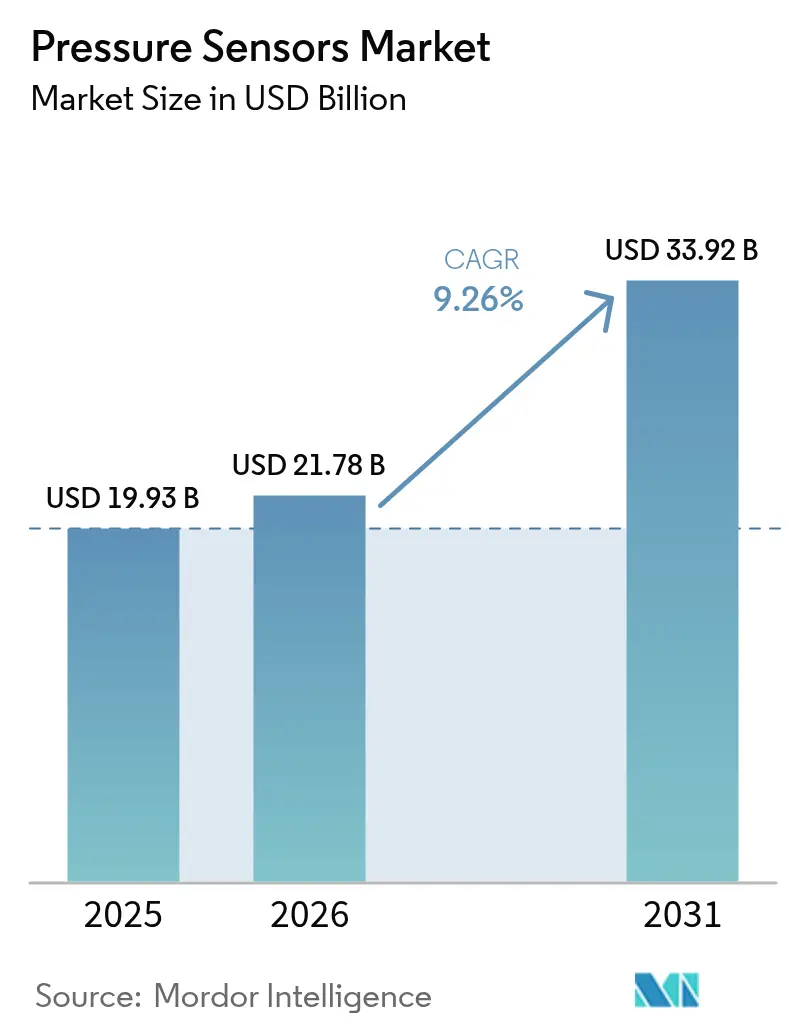
| Market Size (2026) | USD 21.78 Billion |
| Market Size (2031) | USD 33.92 Billion |
| Growth Rate (2026 - 2031) | 9.26% CAGR |
| Fastest Growing Market | Middle East |
| Largest Market | Asia Pacific |
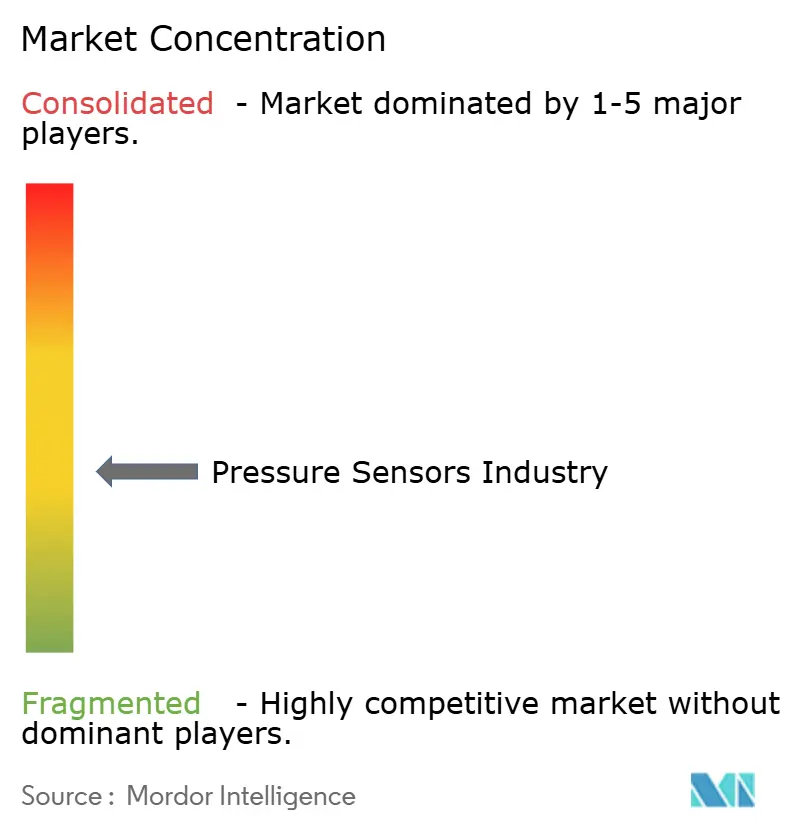
| Market Concentration | Medium |
Major Players *Disclaimer: Major Players sorted in no particular order Image © Mordor Intelligence. Reuse requires attribution under CC BY 4.0. | |
Pressure Sensors Market Analysis by Mordor Intelligence
The pressure sensors market size is projected to expand from USD 19.93 billion in 2025 and USD 21.78 billion in 2026 to USD 33.92 billion by 2031, registering a 9.26% CAGR between 2026 and 2031. Electrification mandates in automotive powertrains, smart-factory retrofits that favor wireless nodes, and the migration toward disposable MEMS catheters in outpatient cardiovascular care are the three most influential growth catalysts. Automotive original-equipment manufacturers are doubling sensor content per vehicle to meet evolving functional-safety and emissions rules, while process industries are adding battery-powered transmitters to legacy assets to streamline predictive-maintenance programs. At the same time, single-use pressure catheters eliminate reprocessing liability, making them attractive to ambulatory surgical centers that operate on tight capital budgets. Competitive intensity remains moderate, with the top five vendors holding about 35% to 40% of global revenue, although Chinese white-label dies priced at USD 8 to USD 52 continue to squeeze margins in cost-sensitive tiers.
Key Report Takeaways
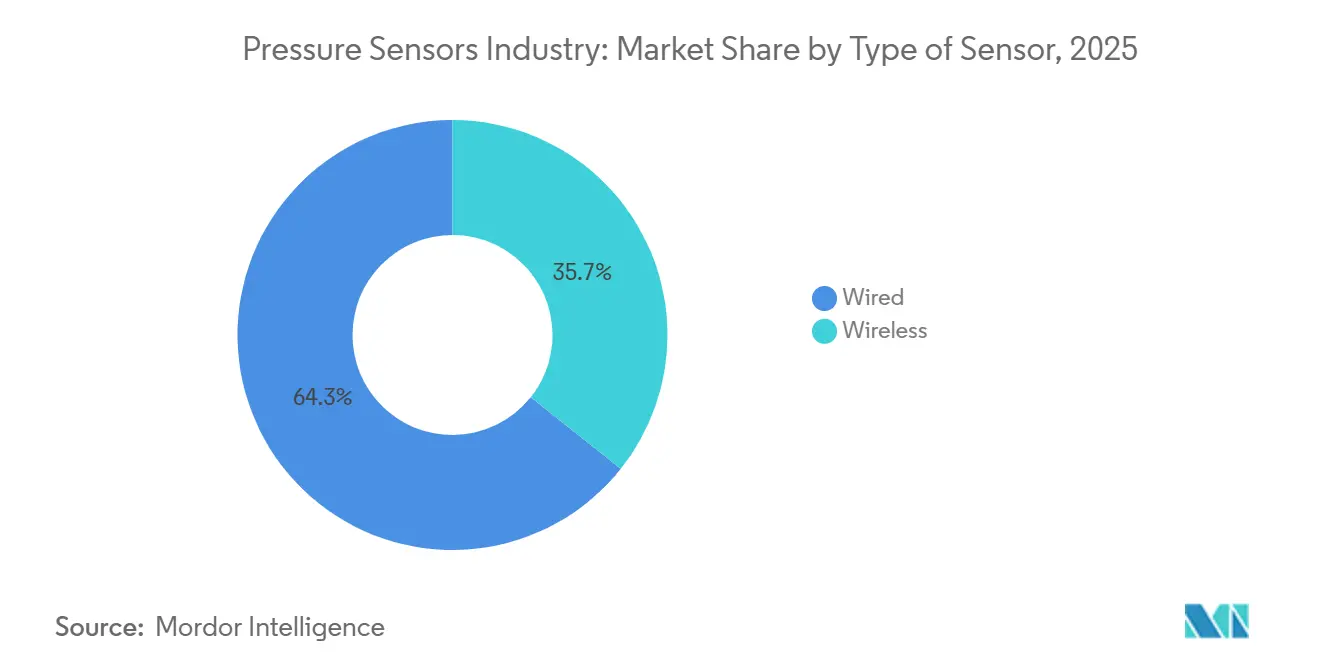
- By type of sensor, wired configurations led with 64.31% pressure sensors market share in 2025; wireless architectures are advancing at a 9.63% CAGR through 2031.
- By product type, absolute devices accounted for 42.29% of the pressure sensors market in 2025, while differential units are expanding at a 9.84% CAGR through 2031.
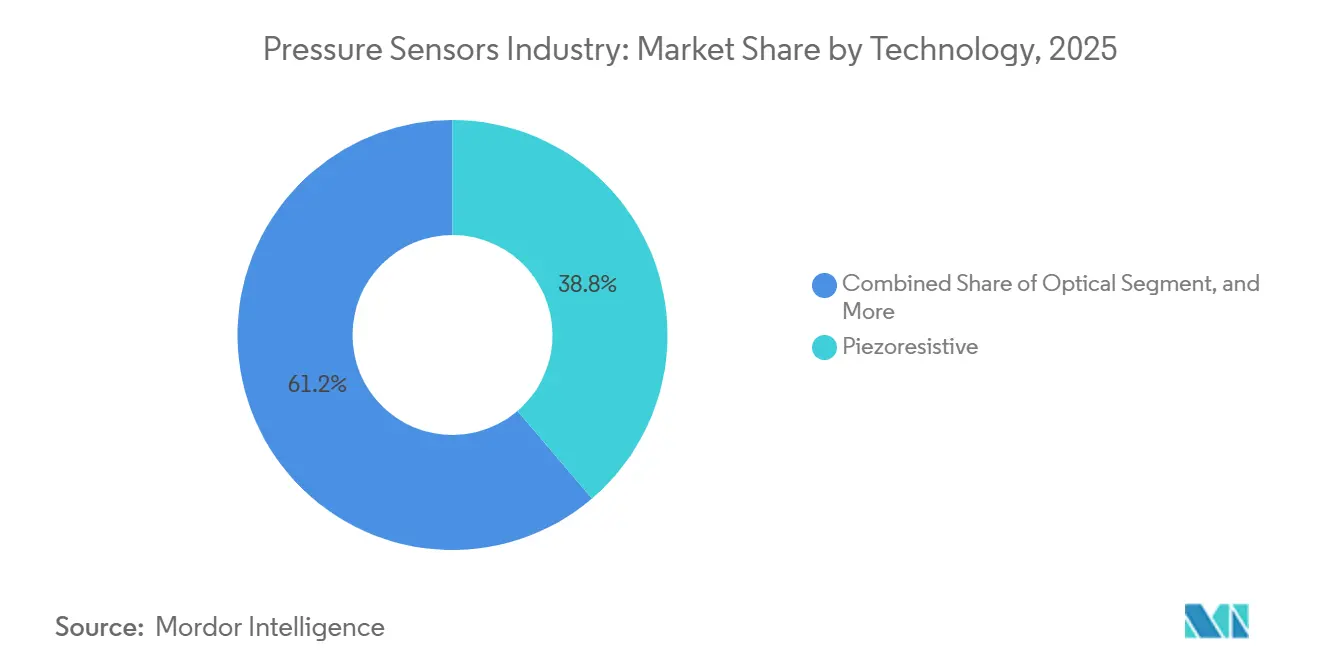
- By technology, piezoresistive silicon dominated with a 38.76% share in 2025; optical transducers post the fastest 10.47% CAGR during the forecast horizon.
- By application, automotive retained a 28.49% share in 2025, yet the medical segment is growing at a 10.66% CAGR through 2031.
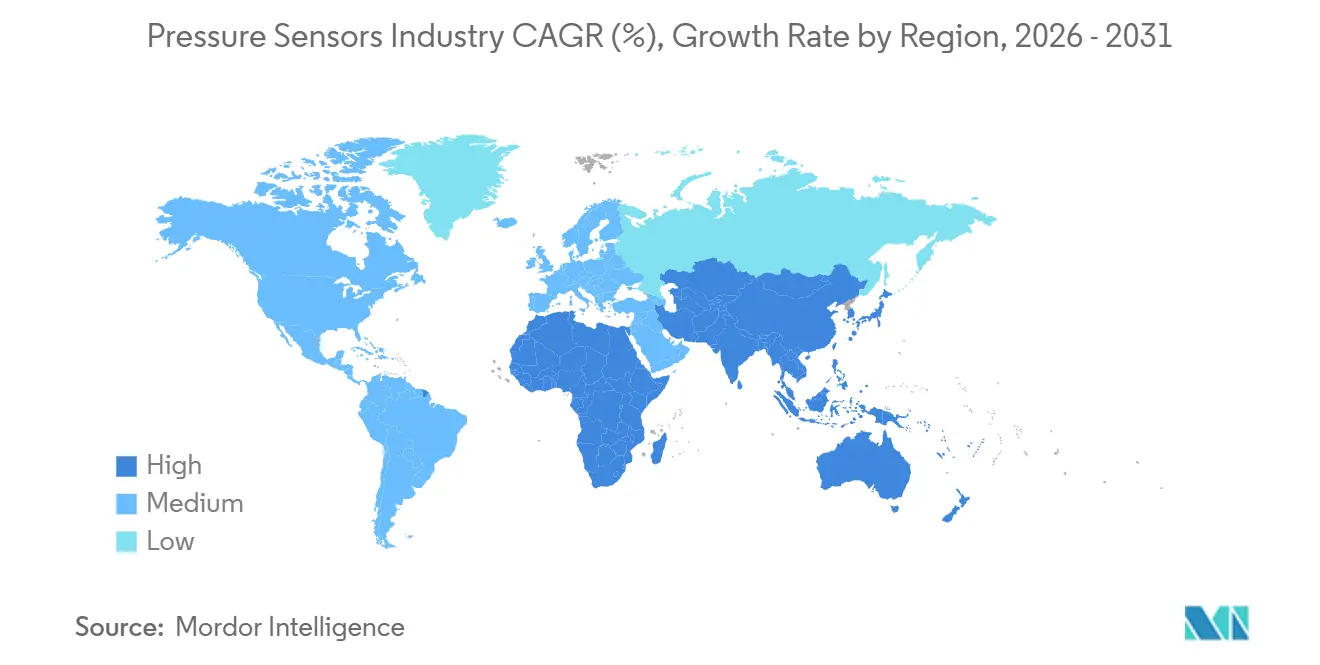
- By geography, Asia-Pacific held 39.73% revenue share in 2025, whereas the Middle East recorded the highest 10.23% CAGR to 2031.
Note: Market size and forecast figures in this report are generated using Mordor Intelligence’s proprietary estimation framework, updated with the latest available data and insights as of 2026.
Global Pressure Sensors Market Trends and Insights
Drivers Impact Analysis*
| Driver | (~) % Impact on CAGR Forecast | Geographic Relevance | Impact Timeline |
|---|---|---|---|
| Rapid electrification of xEV power-train control systems driving high-accuracy barometric sensing | +1.8% | Global, with concentration in China, EU, and North America | Medium term (2-4 years) |
| Expansion of smart factory retrofits boosting wireless sensor node demand | +1.5% | North America and EU core, spillover to Asia-Pacific industrial corridors | Medium term (2-4 years) |
| Mandatory tyre-pressure monitoring adoption waves in India and ASEAN two-wheelers | +1.2% | India, Indonesia, Thailand, Vietnam | Short term (≤ 2 years) |
| Accelerated roll-out of 5G mmWave radios requiring precision thermo-mechanical pressure control | +1.0% | Global, led by urban deployments in North America, EU, China, South Korea | Medium term (2-4 years) |
| Adoption of disposable MEMS pressure catheters in outpatient cardiovascular clinics | +0.9% | North America and EU, early uptake in urban Middle East | Long term (≥ 4 years) |
| LNG carrier fleet build-up elevating harsh-environment subsea pressure instrumentation | +0.7% | Middle East, North America Gulf Coast, Australia | Long term (≥ 4 years) |
| Source: Mordor Intelligence | |||
Rapid Electrification of xEV Power-Train Control Systems Driving High-Accuracy Barometric Sensing
Battery-electric and plug-in hybrid platforms now treat barometric sensors as safety-critical components because charge algorithms rely on altitude compensation to curb thermal runaway risk. Bosch’s BMP585 delivers ±0.5 hPa accuracy across automotive temperature ranges, enabling real-time charge-rate adjustments as vehicles climb mountain passes. NXP reported that the average pressure-sensor count per xEV doubled from 6 in 2020 to 12 in 2025, reflecting broader integration across brake vacuum loops, coolant expansion tanks, and refrigerant circuits. Two-wheeler ABS mandates in India are driving demand, as wheel-speed and TPMS dies can be co-packaged to reduce costs. Zero-emission targets in China, the EU, and North America fast-track ISO 26262 validation schedules, ensuring sustained pull for high-accuracy barometric devices.[1]Bosch Sensortec, “BMP585 Barometric Pressure Sensor,” bosch-sensortec.com
Expansion of Smart-Factory Retrofits Boosting Wireless Sensor Node Demand
Most North American and European manufacturing plants prefer brownfield upgrades over greenfield builds, so battery-powered wireless nodes that sidestep conduit work shorten installation downtime. Deloitte found that 62% of factories prioritized such retrofits in 2025, a trend reinforced by Emerson’s clamp-on Rosemount X-well, which reduces installation labor by up to 60%. Private-5G pilots achieved sub-10 ms latency, mitigating jitter concerns and opening previously restricted closed-loop use cases to 4-20 mA links. Protocol heterogeneity remains a hurdle, yet the economic case for pressure sensor market adoption of wireless nodes strengthens as energy-harvesting options now enable 10-year field life.
Mandatory Tyre-Pressure Monitoring Adoption Waves in India and ASEAN Two-Wheelers
India enforced ABS on motorcycles above 125 cc in January 2026, and OEMs quickly bundled TPMS with wheel-speed dies to capitalize on shared manufacturing steps. The rule influences roughly 18 million annual two-wheeler shipments and could lift TPMS penetration beyond 30% by 2028. Draft regulations in Indonesia and Thailand point to similar momentum by 2027, while premium electric-scooter brands like Ather already ship integrated TPMS as standard. Economic incentives are clear: Michelin data show that 20% under-inflation cuts tire life by 25% and increases rolling resistance by 10%, so riders recoup sensor costs through longer tire life and lower energy draw.[2]Ministry of Road Transport and Highways, “ABS Mandate for Two-Wheelers Above 125 cc,” morth.nic.in
Accelerated Roll-Out of 5G mmWave Radios Requiring Precision Thermo-Mechanical Pressure Control
mmWave base stations run hotter and face stricter ingress-protection thresholds than sub-6 GHz units, so enclosure pressure stability of ±2 mbar is now a design spec. Ericsson and ZTE deployments embed MEMS barometers to trigger active cooling and seal integrity alerts, slashing failure rates by 15% in desert climates. The forecast addition of 4 million to 5 million radio sites from 2026 to 2031 translates into at least 8 million incremental sensor sockets. Demand clusters in urban corridors across North America, China, South Korea, and Western Europe, where operators rush to densify mmWave coverage.[3]Ericsson, “mmWave Radio Unit Reliability Technical Brief,” ericsson.com
Restraints Impact Analysis*
| Restraint | (~) % Impact on CAGR Forecast | Geographic Relevance | Impact Timeline |
|---|---|---|---|
| ASP erosion from Chinese white-label MEMS foundries | -1.3% | Global, most acute in Asia-Pacific and price-sensitive industrial tiers | Short term (≤ 2 years) |
| Fragmented wireless protocol landscape inflating integration cost | -0.9% | Global, particularly North America and EU brownfield retrofits | Medium term (2-4 years) |
| Reliability concerns in optical pressure chips beyond 175 °C process lines | -0.5% | Petrochemical and power-generation sectors in Middle East, North America Gulf Coast | Long term (≥ 4 years) |
| Supply-chain exposure to bulk piezoresistive wafer shortages | -0.6% | Global, with bottlenecks in specialty silicon supply from Japan and Taiwan | Medium term (2-4 years) |
| Source: Mordor Intelligence | |||
ASP Erosion from Chinese White-Label MEMS Foundries
Turnkey dies priced 30% to 50% below Western equivalents entice OEMs in cost-sensitive tiers. Sensata acknowledged a loss of share in China as local TPMS suppliers meet national content rules, squeezing gross margins for incumbent brands, which are now pivoting toward value-added ASIC integration. Foundries are scaling eight-inch wafer lines and automating calibration to widen the price gap, challenging the premium positioning of global leaders.
Fragmented Wireless Protocol Landscape Inflating Integration Cost
Manufacturers juggle LoRaWAN for long-range assets, Zigbee for mesh reliability, BLE for smartphone pairing, and proprietary stacks from automation majors. A 2025 Industrial Internet Consortium poll revealed nearly half of respondents cite protocol chaos as the top barrier to scaling deployments, with one European food plant paying USD 225,000 in extra gateways and cloud fees to support three incompatible radios. In the absence of a universal standard, brownfield adopters will continue to bear elevated integration overheads.
*Our forecasts treat driver/restraint impacts as directional, not additive. The impact forecasts reflect baseline growth, mix effects, and variable interactions.
Segment Analysis
By Type of Sensor: Wireless Nodes Gain Despite Wired Dominance
Wired configurations captured 64.31% of the pressure sensors market share in 2025, reflecting decades of investment in 4-20 mA loops and fieldbus networks that guarantee deterministic latency inside refineries, power stations, and municipal water plants. These installations remain indispensable in safety-instrumented systems governed by IEC 61508 and in high-speed closed-loop controls where sub-millisecond updates are mandatory. Wireless nodes, however, are expanding at a 9.63% CAGR through 2031 because brownfield operators favor battery-powered devices that sidestep conduit costs and downtime. Emerson’s clamp-on transmitters, for example, cut retrofit labor by up to 60%, allowing payback in less than 18 months even after factoring in gateway and cloud fees. Private-5G pilots now deliver sub-10 ms latency, erasing the jitter barrier that once confined untethered sensors to non-critical roles.
Momentum is shifting toward wireless deployments that handle condition monitoring, leak detection, and mobile-asset tracking at one-second to ten-second intervals. Energy-harvesting modules and ultra-low-power chipsets extend field life to more than 10 years, easing maintenance anxiety for remote assets such as rotating kilns and overhead cranes. As a result, the pressure sensors market tied to wireless nodes could approach 40% of unit shipments by 2031, though wired links will likely retain value leadership thanks to higher per-unit pricing in safety-critical environments. The coexistence of both architectures compels vendors to offer hybrid gateways and unified device-management software that abstract underlying transport layers. Those who streamline multi-protocol integration are best positioned to capture incremental volume as factories gradually convert legacy loops to battery-powered meshes.


By Product Type: Differential Sensors Surge on Cleanroom and Filter Monitoring
Absolute units commanded 42.29% of 2025 shipments, serving xEV altitude compensation and barometric economizers in commercial HVAC. Yet differential devices are advancing at a 9.84% clip because pharmaceutical cleanrooms and hospital isolation wards must maintain 5 Pa to 15 Pa positive pressure against adjoining corridors. ISO Class 5 biologics facilities now replace analog manometers with digital MEMS transmitters that report drift-free data to building-management systems, driving rapid unit growth. HVAC operators likewise use differential sensors to flag filter clogging before airflow deteriorates, preventing energy waste and ensuring compliance with indoor air quality standards.
Gauge designs remain the workhorse for hydraulic and pneumatic circuits where ambient referencing simplifies calibration, but their growth trails the surging differential category. Frequent capital projects in semiconductor fabs, battery gigafactories, and life-science plants keep demand for absolute sensing robust, so all three products retain long-term relevance. Still, consistent double-digit expansion in cleanrooms tilts future revenue toward two-port devices that deliver higher average selling prices and value-added diagnostics. Vendors that pair differential outputs with on-sensor temperature and humidity data gain an edge because integrated monitoring reduces sensor count per room while satisfying increasingly stringent validation audits.
By Technology: Optical Transducers Outpace Piezoresistive in Harsh Environments
Piezoresistive silicon held a 38.76% share in 2025 thanks to wafer-level economies, small footprints, and an operating window of -40 °C to +125 °C that satisfies most automotive, industrial, and consumer needs. Nevertheless, optical and sapphire-fiber designs are climbing at a 10.47% CAGR as LNG carriers, petrochemical crackers, and downhole tools push exposure beyond 175 °C, where electromagnetic interference and dielectric drift render silicon and capacitive parts unreliable. Oil-service firms specify fiber-optic probes for 20,000 psi reservoirs, paying triple the price of piezoresistive probes because the uptime savings justify the premium.
Capacitive MEMS continues to win in battery-powered wireless nodes, offering nanoamp sleep currents that stretch battery life for remote transmitters. Resonant quartz units, prized for parts-per-billion stability, occupy niche territories such as satellite propulsion tests and national metrology labs. Each architecture thus anchors a distinct price-performance island, so the pressure sensors market will remain multi-technology through 2031. Suppliers that cross-license fabrication know-how or co-package multiple die types in a common housing can hedge against demand swings while broadening their bill-of-materials share in complex assemblies.

By Application: Medical Segment Leads Growth on Disposable Catheter Adoption
Automotive retained 28.49% revenue in 2025, underpinned by brake-by-wire, electronic stability control, and battery-thermal loops that collectively embed 6 to 12 sensors per light vehicle. Electrification mandates lift content even higher because altitude-adjusted charge profiles depend on barometric feedback. The medical field, however, is expanding fastest at a 10.66% CAGR as outpatient cardiovascular centers shift to single-use MEMS catheters, removing re-sterilization liability and capital amortization. BD’s acquisition of ICU Medical consolidated disposables expertise, while Edwards Lifesciences reported double-digit growth for its FloTrac line that targets ambulatory cath labs.
Industrial retrofits add steady volume by instrumenting compressors, steam lines, and hydraulic presses with smart transmitters that feed machine-learning maintenance models. Consumer electronics continue to order ultra-miniature dies under 2 mm² for smartphones, wearables, and drones, though unit margins remain thin. Aerospace and defense reserve SiC-based sensors for hypersonic jets and deep-subsea drones, niches that favor reliability over cost. Food and beverage processors, bound by 3-A sanitary codes, install flush-diaphragm transmitters that withstand caustic clean-in-place chemicals. As these diverse verticals mature, suppliers that tailor ruggedness, packaging, and digital features to each use case will capture an outsized share of the pressure sensors market.
Geography Analysis
Asia-Pacific accounted for a dominant 39.73% pressure sensors market share in 2025, anchored by China’s 26 million-unit passenger-car output and India’s vast two-wheeler base now covered by ABS-TPMS mandates. High-volume electronics clusters in Shenzhen, Hsinchu, and Suwon pull in ultra-miniature dies for smartphones and wearables, while Japan’s chip-equipment makers specify sub-mTorr transmitters for 300 mm CVD tools. South Korea installed more than 200,000 mmWave small cells in 2025, each requiring enclosure barometers that trigger active cooling and seal-integrity alarms. These diverse demand streams explain why regional OEMs and ODMs continue to localize MEMS capacity, shortening lead times and buffering currency swings. Asia-Pacific, therefore, remains the anchor for unit growth even as other regions accelerate value growth.
The Middle East is forecast to post the fastest CAGR of 10.23% through 2031, driven by LNG and petrochemical megaprojects that require cryogenic and high-temperature instrumentation. QatarEnergy’s 128-vessel LNG order represents up to 12,800 subsea transmitters, while Saudi Aramco’s Jafurah unconventional-gas program specifies SiC sensors that survive 175 °C downhole conditions. Hydrogen initiatives, such as ADNOC’s 1 GW electrolyzer, require hundreds of 700-bar differential gauges for compression trains and deionized-water skids. Regional EPC contractors increasingly favor fiber-optic designs for immunity to electromagnetic interference near 400 kV switchyards, widening the technology mix shipped into Gulf projects. This large backlog of capital work secures a steady runway for suppliers able to certify products under IECEx Zone 0 rules.
North America generated just under one-third of 2025 revenue as shale-gas services demanded 10,000-psi wellhead transmitters and U.S. battery-electric vehicle sales hit 1.8 million units, each equipped with altitude-compensated BMS logic. Europe follows closely, where Euro 7 exhaust rules and private-5G retrofits in legacy factories keep order books healthy for smart transmitters. Together, these mature markets emphasize digital readiness, cybersecurity hardening, and over-the-air calibration, lifting average selling prices even when unit volumes plateau. As a result, the regional pressure sensor market is growing faster than local vehicle or factory counts, reinforcing the case for value-added software wrappers. Suppliers that bundle gateways, analytics, and multiyear service contracts capture recurring revenue streams that insulate them from raw-die price swings.

Competitive Landscape
The top five vendors controlled roughly 35% to 40% of global revenue in 2025, a concentration that yields a moderate competitive score of 6. Bosch, Honeywell, Sensata, Emerson, and TE Connectivity anchor this tier, leveraging scale in automotive and industrial supply chains to protect share. Persistent average-selling-price erosion from Chinese white-label dies priced at USD 8 to USD 52 keeps gross-margin pressure high. To counter, incumbents funnel R&D into ASIC co-packaging, on-chip temperature compensation, and factory-calibrated digital outputs that shorten customer qualification cycles.
Strategic moves underscore this shift toward integrated value. Bosch’s BMP585 barometer merged FIFO memory with ±0.5 hPa accuracy in a 2 mm × 2 mm package to deepen xEV penetration. Emerson’s clamp-on Rosemount X-well cut retrofit labor by up to 60% and opened wireless opportunities inside hazardous zones. BD’s USD 4.8 billion purchase of ICU Medical cemented leadership in single-use medical transducers, while TE Connectivity rolled out the MS5839-02BA to capture drone and wearables sockets requiring IPx8 sealing. Each initiative aligns with a broader push to sell complete subsystems rather than commoditized sensing elements.
Below the top tier sit regional specialists and protocol-agnostic gateway vendors that thrive on customization. Chinese foundries expand eight-inch wafer lines and automate calibration to widen their price gap, luring cost-sensitive consumer and industrial buyers. European automation majors bundle sensors with proprietary cloud platforms, trading lock-in for integration simplicity. Private-equity activity, exemplified by the USD 8.2 billion Sensata take-private deal, injects capital for fab upgrades and consolidates mid-market players. As protocol harmonization lags, suppliers who can abstract LoRaWAN, Zigbee, BLE, and 5G into a single device-management stack gain a durable edge even on a fragmented battlefield.
Pressure Sensors Industry Leaders
Bosch Sensortec GmbH
TE Connectivity
Honeywell International Inc.
Emerson Electric Co.
Sensata Technologies Inc.
- *Disclaimer: Major Players sorted in no particular order

Recent Industry Developments
- January 2026: India’s ABS rule on motorcycles above 125 cc takes effect, indirectly boosting integrated TPMS volumes.
- October 2025: BD closes USD 4.8 billion ICU Medical deal to expand disposable catheter offerings.
- September 2025: QatarEnergy confirms 128-vessel LNG order worth USD 20 billion, each ship embedding up to 100 cryogenic pressure transmitters.
- July 2025: Emerson debuts clamp-on Rosemount X-well wireless pressure unit that trims retrofit labor by up to 60%.


Global Pressure Sensors Market Report Scope
The Pressure Sensors Industry Report is Segmented by Type of Sensor (Wired, and Wireless), Product Type (Absolute, Differential, Gauge), Technology (Piezoresistive, Electromagnetic, Capacitive, Resonant Solid-State, Optical, Other Technologies), Application (Automotive, Medical, Consumer Electronics, Industrial, Aerospace and Defense, Food and Beverage, HVAC), and Geography (North America, South America, Europe, Asia-Pacific, Middle East and Africa). The Market Forecasts are Provided in Terms of Value (USD).
By Type of Sensor
| Wired |
| Wireless |
By Product Type
| Absolute |
| Differential |
| Gauge |
By Technology
| Piezoresistive |
| Electromagnetic |
| Capacitive |
| Resonant Solid-State |
| Optical Transducers |
| Other Technologies |
By Application
| Automotive |
| Medical |
| Consumer Electronics |
| Industrial |
| Aerospace and Defense |
| Food and Beverage |
| HVAC |
By Geography
| North America | United States | |
| Canada | ||
| Mexico | ||
| South America | Brazil | |
| Argentina | ||
| Rest of South America | ||
| Europe | United Kingdom | |
| Germany | ||
| France | ||
| Italy | ||
| Rest of Europe | ||
| Asia Pacific | China | |
| Japan | ||
| India | ||
| South Korea | ||
| Rest of Asia Pacific | ||
| Middle East and Africa | Middle East | United Arab Emirates |
| Saudi Arabia | ||
| Rest of Middle East | ||
| Africa | South Africa | |
| Egypt | ||
| Rest of Africa | ||
| By Type of Sensor | Wired | ||
| Wireless | |||
| By Product Type | Absolute | ||
| Differential | |||
| Gauge | |||
| By Technology | Piezoresistive | ||
| Electromagnetic | |||
| Capacitive | |||
| Resonant Solid-State | |||
| Optical Transducers | |||
| Other Technologies | |||
| By Application | Automotive | ||
| Medical | |||
| Consumer Electronics | |||
| Industrial | |||
| Aerospace and Defense | |||
| Food and Beverage | |||
| HVAC | |||
| By Geography | North America | United States | |
| Canada | |||
| Mexico | |||
| South America | Brazil | ||
| Argentina | |||
| Rest of South America | |||
| Europe | United Kingdom | ||
| Germany | |||
| France | |||
| Italy | |||
| Rest of Europe | |||
| Asia Pacific | China | ||
| Japan | |||
| India | |||
| South Korea | |||
| Rest of Asia Pacific | |||
| Middle East and Africa | Middle East | United Arab Emirates | |
| Saudi Arabia | |||
| Rest of Middle East | |||
| Africa | South Africa | ||
| Egypt | |||
| Rest of Africa | |||


Key Questions Answered in the Report
How fast will global demand grow for pressure sensors through 2031?
The pressure sensors market is forecast to expand at a 9.26% CAGR from 2026 to 2031, reaching USD 33.92 billion by the end of the period.
Which regional bloc contributes the most revenue today?
Asia-Pacific held the largest 39.73% share in 2025, led by China’s vast automotive output and India’s two-wheeler mandates.
Where is the quickest geographic growth expected?
The Middle East posts the fastest 10.23% CAGR through 2031, fueled by LNG carrier orders and petrochemical expansions.
What sensor technology is gaining ground in harsh-temperature applications?
Optical and SiC-based pressure transducers are growing at double-digit rates because they tolerate environments above 175 °C.
Why are wireless pressure nodes gaining traction in factories?
Battery-powered transmitters avoid conduit installation, cut retrofit labor by up to 60%, and now achieve 10-year field life, making payback attractive.
Which end-use segment shows the highest growth?
Medical devices lead with a 10.66% CAGR as disposable MEMS catheters replace reusable systems in outpatient cardiovascular clinics.
Page last updated on:


