Africa Rice Market Analysis by Mordor Intelligence
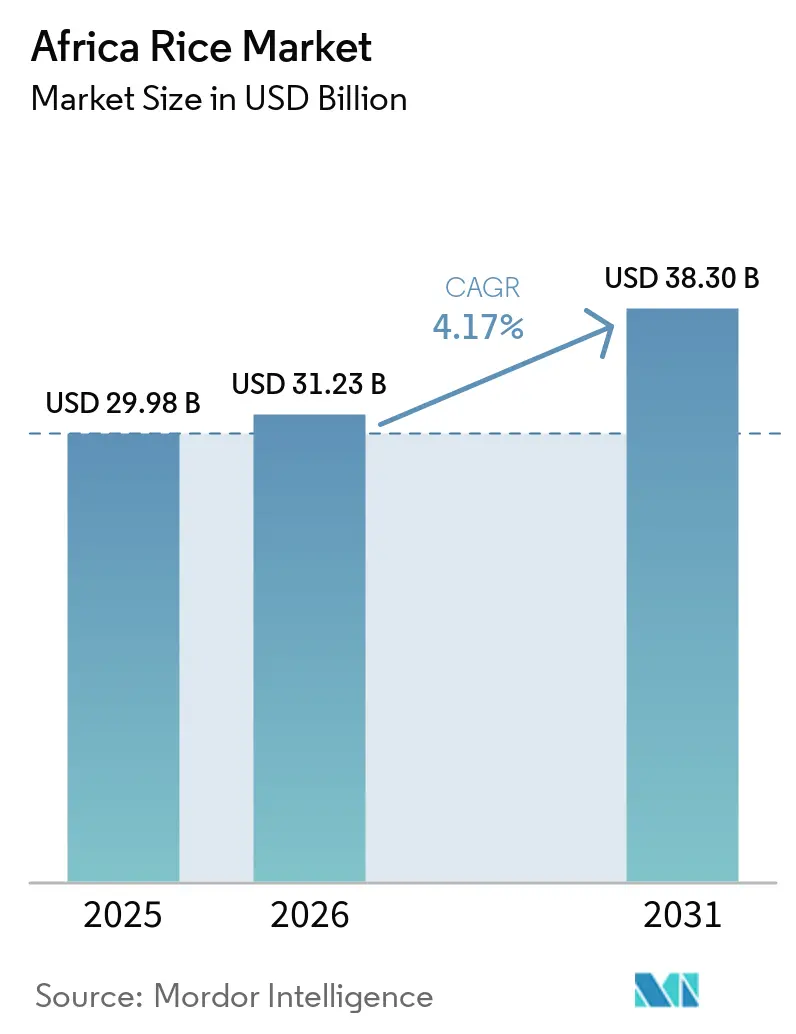
The Africa rice market size is projected to grow from USD 29.98 billion in 2025 to USD 31.23 billion in 2026 and is forecast to reach USD 38.30 billion by 2031 at a 4.17% CAGR over 2026-2031. Urbanization, tariff liberalization under the African Continental Free Trade Area, and stepped-up irrigation investments together reinforce a structural demand uptrend that favors locally milled parboiled formats across coastal and inland urban centers. Integrated millers that combine paddy aggregation with branded retail packaging are gaining additional margins as informal trader networks lose market share to organized distribution channels. Meanwhile, government e-voucher programs that subsidize fertilizer and certified seed continue to narrow the yield gap with Asian benchmarks, although farm-gate production costs still stand 12% to 18% above import parity in most markets. Sub-regional specialization is unfolding, surplus zones in Mali and Senegal now ship duty-free paddy into the Sahel, while Tanzania scales solar-powered irrigation to unlock dry-season double-cropping.
Key Report Takeaways
- By geography, Nigeria led with 20.5% of Africa rice market share in 2025, while Tanzania is forecast to expand at a 5.5% CAGR through 2031.
Note: Market size and forecast figures in this report are generated using Mordor Intelligence’s proprietary estimation framework, updated with the latest available data and insights as of 2026.
Africa Rice Market Trends and Insights
Drivers Impact Analysis*
| Driver | (~) % Impact on CAGR Forecast | Geographic Relevance | Impact Timeline |
|---|---|---|---|
| Exploding Urban Demand for Calorie-dense Staples | +1.20% | Nigeria, Tanzania, Côte d'Ivoire, Ghana, and Senegal | Medium term (2-4 years) |
| Expansion of Small-scale Gravity and Solar Irrigation Schemes | +0.90% | Tanzania, Mali, Madagascar, and Nigeria | Long term (≥ 4 years) |
| African Continental Free Trade Area (AfCFTA) Tariff Cuts Accelerating Intra-Africa Paddy Trade | +0.70% | West Africa (Mali, Senegal, Côte d'Ivoire), and Sahel corridors | Short term (≤ 2 years) |
| Public Fertilizer and Seed Subsidy Programs Reviving Yields | +0.80% | Nigeria, Tanzania, Ghana, and Cameroon | Medium term (2-4 years) |
| Adoption of Flood-tolerant, Early-maturing Rice Genetics | +0.60% | Madagascar, Nigeria, Tanzania, Guinea, and Sierra Leone | Long term (≥ 4 years) |
| Monetising Paddy-methane Abatement via Voluntary Carbon Credits | +0.30% | Tanzania, Madagascar, Mali, and Senegal | Long term (≥ 4 years) |
| Source: Mordor Intelligence | |||


Exploding Urban Demand for Calorie-dense Staples
Disposable incomes in Africa’s megacities climbed steadily between 2020 and 2025, and higher-income households in Lagos increased the share of their food budgets allocated to rice over the period[1]Source: World Bank, “Africa Pulse 2025,” worldbank.org. Parboiled formats dominate because they tolerate humid storage conditions and cook quickly on limited electricity, making them the default grain in convenience-driven diets. Milling capacity located within 50 kilometers of Abidjan, Dar es Salaam, and Accra expanded significantly between 2024 and 2025, trimming inbound logistics costs by up to 14%. Integrated operators that control aggregation, processing, and branded distribution, therefore secure both supply stability and higher margins. Retail demand spikes during festive seasons have prompted processors to build silo storage for de-seasonalizing throughput. Financiers increasingly favor such vertically integrated models because consistent cash flow reduces credit risk.
Expansion of Small-scale Gravity and Solar Irrigation Schemes
Off-grid solar pumps costing about USD 800 to USD 1,200 per kit enable Tanzanian smallholders to cultivate a second rice crop during the dry season, lifting annual farm output per holding. Pay-as-you-go financing distributes capital costs over time, enabling the kits to irrigate small plot sizes and transform previously rain-fed fields into commercial farmland. In Mali’s Office du Niger, additional gravity-fed canals came online, eliminating diesel expenses and lowering per-ton production costs, placing the region among the continent’s most competitive benchmarks. These infrastructure upgrades sharply reduce yield variability linked to erratic rainfall, boosting farmer confidence to invest in higher-value seed and mechanization. Irrigated acreage thus serves as a platform for input retailers, mechanization service providers, and micro-lenders to expand their addressable market. The combined effect enhances the medium-term growth trajectory of the Africa rice market by improving both volumes and cost competitiveness.
African Continental Free Trade Area (AfCFTA) Tariff Cuts Accelerating Intra-Africa Paddy Trade
The phased implementation of African Continental Free Trade Area (AfCFTA) tariff liberalization, encompassing up to 90% of tariff lines, has significantly lowered intra-African trade barriers for staple commodities such as rice[2]Source: African Union, “African Continental Free Trade Area,” au.int. In many participating countries, applied tariffs on intra-continental rice trade have started to decrease from historically high double-digit levels to low- or zero-duty bands. Tanzania exported more than 380.8 thousand metric tons of rice to Rwanda, Kenya, and the Republic of the Congo in 2024, 80.6% than in 2023[3]Source: World Bank, “Africa Pulse 2025,” worldbank.org. Cooperative mills in the Senegal River Valley invested in mechanical threshers once assured of regional demand, while buyers in landlocked Sahel states secured a stable supply at lower landed costs. The zero-duty regime also pressures high-cost domestic processors to streamline operations or exit, fostering consolidation that could eventually lift average plant efficiency. Short-term price convergence across borders is already visible in weekly wholesale quotes tracked by regional commodity exchanges. Over time, deeper cross-border value chains should cultivate comparative advantage and nudge the Africa rice market toward a more integrated continental trading system.
Public Fertilizer and Seed Subsidy Programs Reviving Yields
Nigeria’s e-wallet platform disbursed fertilizer vouchers to farmers in 2025, raising nutrient application rates per hectare. Tanzania allocated funding for a similar scheme that bundled certified New Rice for Africa (NERICA) seed with fertilizer coupons. Digital distribution cut leakage significantly, channeling inputs directly to targeted growers and lifting average yields per hectare. Higher yield translates into lower per-unit production cost and improved resilience against import competition. Real-time voucher redemption data helps ministries redirect resources to lagging districts mid-season, optimizing public spend. As subsidy efficiency improves, donor agencies and concessional lenders remain willing to co-finance, ensuring program continuity. Yield gains thus steadily narrow the competitiveness gap versus Asia-Pacific exporters, supporting volume expansion for the Africa rice market.
Restraints Impact Analysis*
| Restraint | (~) % Impact on CAGR Forecast | Geographic Relevance | Impact Timeline |
|---|---|---|---|
| Post-harvest Losses from Rudimentary Drying and Storage Systems | -0.90% | Nigeria, Tanzania, Côte d'Ivoire, Guinea, and Sierra Leone | Short term (≤ 2 years) |
| Domestic Cost of Production Still above Asian Import Parity | -1.10% | Ghana, Senegal, Cameroon, South Africa, and Niger | Medium term (2-4 years) |
| Currency and Diesel-Price Volatility Squeezing Milling Margins | -0.70% | Nigeria, Tanzania, Ghana, and Cameroon | Short term (≤ 2 years) |
| Land-tenure Insecurity Limiting Long-term On-farm Investment | -0.50% | Guinea, Sierra Leone, Niger, northern Nigeria, and Mali | Long term (≥ 4 years) |
| Source: Mordor Intelligence | |||
Post-harvest Losses from Rudimentary Drying and Storage Systems
Across sub-Saharan Africa, 15% to 18% of harvested paddy spoils before reaching mills. Sun-drying on tarpaulins prolongs exposure to humidity, moisture content often remains above 14% during rainy months, enabling mold and aflatoxin. Millers accordingly discount such paddy by up to 20%, eroding farm income and discouraging investment in yield-enhancing inputs. Woven polypropylene bags permit insect and rodent damage, a 2025 survey in northern Nigeria found 23% of stored paddy downgraded in less than six weeks. Hermetic bags and mechanical dryers could cut losses to single digits but remain unaffordable for most smallholders who face interest rates on asset-finance loans. Cooperative ownership models lower per-farmer cost, yet require strong governance that many fragmented producer groups lack. Until affordable post-harvest technology scales, the Africa rice market forfeits a significant share of potential supply, dampening growth.
Domestic Cost of Production still above Asian Import Parity
African growers incur higher per-metric-ton paddy production costs compared with Thailand and Vietnamese counterparts, reflecting structural cost disadvantages in inputs, productivity, and supply chain efficiency. Ghana imported significant volumes of milled rice in 2025 at a landed cost of USD 457 per metric ton[4]Source: International Trade Centre, Trade Map, “List of importing markets for a product exported by Tanzania,” https://www.trademap.org. Senegal achieves high yields in irrigated schemes, yet elevated diesel prices keep production costs high. Mechanization could narrow the cost gap, but tractor density remains significantly lower than in major Asia-Pacific rice-producing countries. Without sustained productivity gains or cost reductions, domestic processors continue to rely on tariff protection, constraining price competitiveness in the African rice market and limiting export prospects.
*Our forecasts treat driver/restraint impacts as directional, not additive. The impact forecasts reflect baseline growth, mix effects, and variable interactions.
Geography Analysis
In 2025, Nigeria accounted for 20.5% of Africa rice market, with an output of 9.2 million metric tons concentrated in the states of Kebbi, Niger, and Ebonyi. This significant contribution underscores Nigeria's role as a key player in Africa's rice production landscape. Madagascar is also among the leading producers, followed by Tanzania, Côte d'Ivoire, and Mali, which collectively contribute to the continent's rice supply. Ghana, despite its limited domestic harvest, relies heavily on imports to meet its demand, importing more than its domestic output. Senegal, on the other hand, has achieved high yields through efficient irrigated schemes on smaller land areas. Cameroon produced modest volumes, while Guinea and Sierra Leone recorded relatively higher production levels. Niger remained a smaller producer, and South Africa produced minimal quantities, relying predominantly on imports to satisfy domestic consumption needs.
Tanzania is projected to lead growth in Africa's rice market with a projected CAGR of 5.5% from 2026 to 2031. This growth is primarily driven by the adoption of solar irrigation technologies, which enhance water efficiency and support sustainable farming practices. Mali is anticipated to follow closely, with strong growth supported by the implementation of gravity canal infrastructure, which significantly reduces energy costs and improves irrigation efficiency. Madagascar is projected to expand steadily, benefiting from the introduction of improved flood-tolerant rice varieties that enhance resilience to climate variability. Nigeria, with its already mature production base, is projected to experience a more moderate growth outlook during this period.
Ghana's efforts to reduce its dependency on rice imports are anticipated to support moderate production expansion, as the country invests in initiatives to boost domestic output. Senegal, Côte d'Ivoire, Guinea, and Cameroon are projected to experience comparable mid-range growth trends, driven by a combination of improved farming practices and infrastructure development. In contrast, South Africa's rice production growth is projected to remain constrained due to limited water availability, which poses a significant challenge to expanding cultivation. Despite these constraints, South Africa continues to rely heavily on imports to meet its domestic demand, highlighting the importance of addressing water resource management to support future growth in the sector.
Competitive Landscape
Africa's rice market remains fragmented, with leading companies controlling only a small share of farm-gate volumes. Olam Agri operates a large-scale milling operation and manages an extensive outgrower network, ensuring supply stability and value capture across the supply chain. This approach allows Olam Agri to streamline operations and reduce inefficiencies, contributing to a more stable supply of rice in the region. Dangote Rice is establishing an integrated milling and storage facility, supported by captive power generation to address grid reliability challenges. By integrating power generation into its operations, Dangote Rice aims to ensure uninterrupted production and storage, which is critical for maintaining quality and meeting demand. Stallion Group’s Popular Farms and Mills runs a large-scale milling facility in Kano, supported by a network of paddy collection centers across northern Nigeria. This network enables the company to source paddy efficiently from local farmers, strengthening its supply chain and supporting regional agricultural development. In Eastern Africa, smaller players are introducing solar-powered mobile mills that process paddy at the farm gate, bypassing traditional trader mark-ups. These mobile mills provide a cost-effective solution for farmers, allowing them to retain a larger share of the value generated from their produce.
Export Trading Group (ETG) is utilizing sustainability-linked financing to expand aggregation and milling infrastructure in Tanzania, Mozambique, and Zambia. This financing approach not only supports the development of critical infrastructure but also aligns with global sustainability goals, enhancing ETG's market positioning. Additionally, carbon-credit monetization through alternate wetting and drying practices provides a unique advantage for cooperatives in the region. These practices enable cooperatives in Tanzania and Madagascar to earn an additional USD 4.50 per metric ton, which offsets sensor and training expenses. This initiative not only reduces production costs but also promotes environmentally sustainable farming practices, contributing to long-term benefits for both farmers and the environment. By leveraging these innovative approaches, ETG is strengthening its competitive edge while supporting the broader goals of sustainability and economic development in the region.
Overall, strategic initiatives across the region focus on capacity expansion, vertical integration, and climate-aligned revenue streams, shaping the competitive dynamics of Africa rice market. Capacity expansion efforts, such as the establishment of new milling facilities and the deployment of mobile mills, are aimed at increasing production efficiency and meeting growing demand. Vertical integration strategies, including the development of outgrower networks and integrated facilities, help companies streamline operations and reduce dependency on external suppliers. Climate-aligned revenue streams, such as carbon-credit monetization, provide an additional source of income while promoting sustainable practices. Together, these initiatives are transforming the competitive landscape of Africa rice market, fostering growth and innovation while addressing key challenges such as supply chain inefficiencies and environmental sustainability.
Recent Industry Developments
- June 2025: Ghana planned to establish a new rice mill in Jadima, Northeast Ghana, with the World Food Program Ecofin Agency. The facility will enhance local rice processing capabilities and minimize post-harvest losses in the country.
- June 2024: Capwell Industries introduces fortified rice in Kenya ahead of the Africa Food Manufacturing and Safety Summit (AFMASS) Food Expo, with potential expansion across the African continent.
- March 2024: The International Rice Research Institute (IRRI) and AfricaRice have initiated the second phase of the Accelerating Genetic Gain in Rice (AGGRi2) Alliance in Tanzania. This phase aims to provide smallholder farmers in Sub-Saharan Africa with climate-resilient and high-yielding rice varieties.


Africa Rice Market Report Scope
Africa Rice Market Report is Segmented by Geography (Nigeria, Tanzania, Côte D’Ivoire, and More). The Report Includes Production Analysis (Volume), Consumption Analysis (Value and Volume), Import Analysis (Value and Volume), Export Analysis (Value and Volume), Wholesale Price Trend Analysis and Forecast, Regulatory Framework, List of Key Players, Logistics and Infrastructure, and Seasonality Analysis. The Market Forecasts are Provided in Terms of Value (USD) and Volume (Metric Tons).
Geography
| Nigeria | Production Analysis (Area Harvested, Yield, and Production Volume) |
| Consumption Analysis (Consumption Value and Volume) | |
| Import Market Analysis (Import Value, Volume, and Key Supplying Markets) | |
| Export Market Analysis (Export Value, Volume, and Key Destination Markets) | |
| Wholesale Price Trend Analysis and Forecast | |
| Regulatory Framework | |
| List of Key Players | |
| Logistics and Infrastructure | |
| Seasonality Analysis | |
| Tanzania | Production Analysis (Area Harvested, Yield, and Production Volume) |
| Consumption Analysis (Consumption Value and Volume) | |
| Import Market Analysis (Import Value, Volume, and Key Supplying Markets) | |
| Export Market Analysis (Export Value, Volume, and Key Destination Markets) | |
| Wholesale Price Trend Analysis and Forecast | |
| Regulatory Framework | |
| List of Key Players | |
| Logistics and Infrastructure | |
| Seasonality Analysis | |
| Cote d'Ivoire | Production Analysis (Area Harvested, Yield, and Production Volume) |
| Consumption Analysis (Consumption Value and Volume) | |
| Import Market Analysis (Import Value, Volume, and Key Supplying Markets) | |
| Export Market Analysis (Export Value, Volume, and Key Destination Markets) | |
| Wholesale Price Trend Analysis and Forecast | |
| Regulatory Framework | |
| List of Key Players | |
| Logistics and Infrastructure | |
| Seasonality Analysis | |
| Madagascar | Production Analysis (Area Harvested, Yield, and Production Volume) |
| Consumption Analysis (Consumption Value and Volume) | |
| Import Market Analysis (Import Value, Volume, and Key Supplying Markets) | |
| Export Market Analysis (Export Value, Volume, and Key Destination Markets) | |
| Wholesale Price Trend Analysis and Forecast | |
| Regulatory Framework | |
| List of Key Players | |
| Logistics and Infrastructure | |
| Seasonality Analysis | |
| Mali | Production Analysis (Area Harvested, Yield, and Production Volume) |
| Consumption Analysis (Consumption Value and Volume) | |
| Import Market Analysis (Import Value, Volume, and Key Supplying Markets) | |
| Export Market Analysis (Export Value, Volume, and Key Destination Markets) | |
| Wholesale Price Trend Analysis and Forecast | |
| Regulatory Framework | |
| List of Key Players | |
| Logistics and Infrastructure | |
| Seasonality Analysis | |
| Ghana | Production Analysis (Area Harvested, Yield, and Production Volume) |
| Consumption Analysis (Consumption Value and Volume) | |
| Import Market Analysis (Import Value, Volume, and Key Supplying Markets) | |
| Export Market Analysis (Export Value, Volume, and Key Destination Markets) | |
| Wholesale Price Trend Analysis and Forecast | |
| Regulatory Framework | |
| List of Key Players | |
| Logistics and Infrastructure | |
| Seasonality Analysis | |
| Senegal | Production Analysis (Area Harvested, Yield, and Production Volume) |
| Consumption Analysis (Consumption Value and Volume) | |
| Import Market Analysis (Import Value, Volume, and Key Supplying Markets) | |
| Export Market Analysis (Export Value, Volume, and Key Destination Markets) | |
| Wholesale Price Trend Analysis and Forecast | |
| Regulatory Framework | |
| List of Key Players | |
| Logistics and Infrastructure | |
| Seasonality Analysis | |
| Cameroon | Production Analysis (Area Harvested, Yield, and Production Volume) |
| Consumption Analysis (Consumption Value and Volume) | |
| Import Market Analysis (Import Value, Volume, and Key Supplying Markets) | |
| Export Market Analysis (Export Value, Volume, and Key Destination Markets) | |
| Wholesale Price Trend Analysis and Forecast | |
| Regulatory Framework | |
| List of Key Players | |
| Logistics and Infrastructure | |
| Seasonality Analysis | |
| Guinea | Production Analysis (Area Harvested, Yield, and Production Volume) |
| Consumption Analysis (Consumption Value and Volume) | |
| Import Market Analysis (Import Value, Volume, and Key Supplying Markets) | |
| Export Market Analysis (Export Value, Volume, and Key Destination Markets) | |
| Wholesale Price Trend Analysis and Forecast | |
| Regulatory Framework | |
| List of Key Players | |
| Logistics and Infrastructure | |
| Seasonality Analysis | |
| Sierra Leone | Production Analysis (Area Harvested, Yield, and Production Volume) |
| Consumption Analysis (Consumption Value and Volume) | |
| Import Market Analysis (Import Value, Volume, and Key Supplying Markets) | |
| Export Market Analysis (Export Value, Volume, and Key Destination Markets) | |
| Wholesale Price Trend Analysis and Forecast | |
| Regulatory Framework | |
| List of Key Players | |
| Logistics and Infrastructure | |
| Seasonality Analysis | |
| Niger | Production Analysis (Area Harvested, Yield, and Production Volume) |
| Consumption Analysis (Consumption Value and Volume) | |
| Import Market Analysis (Import Value, Volume, and Key Supplying Markets) | |
| Export Market Analysis (Export Value, Volume, and Key Destination Markets) | |
| Wholesale Price Trend Analysis and Forecast | |
| Regulatory Framework | |
| List of Key Players | |
| Logistics and Infrastructure | |
| Seasonality Analysis | |
| South Africa | Production Analysis (Area Harvested, Yield, and Production Volume) |
| Consumption Analysis (Consumption Value and Volume) | |
| Import Market Analysis (Import Value, Volume, and Key Supplying Markets) | |
| Export Market Analysis (Export Value, Volume, and Key Destination Markets) | |
| Wholesale Price Trend Analysis and Forecast | |
| Regulatory Framework | |
| List of Key Players | |
| Logistics and Infrastructure | |
| Seasonality Analysis |
| Geography | Nigeria | Production Analysis (Area Harvested, Yield, and Production Volume) |
| Consumption Analysis (Consumption Value and Volume) | ||
| Import Market Analysis (Import Value, Volume, and Key Supplying Markets) | ||
| Export Market Analysis (Export Value, Volume, and Key Destination Markets) | ||
| Wholesale Price Trend Analysis and Forecast | ||
| Regulatory Framework | ||
| List of Key Players | ||
| Logistics and Infrastructure | ||
| Seasonality Analysis | ||
| Tanzania | Production Analysis (Area Harvested, Yield, and Production Volume) | |
| Consumption Analysis (Consumption Value and Volume) | ||
| Import Market Analysis (Import Value, Volume, and Key Supplying Markets) | ||
| Export Market Analysis (Export Value, Volume, and Key Destination Markets) | ||
| Wholesale Price Trend Analysis and Forecast | ||
| Regulatory Framework | ||
| List of Key Players | ||
| Logistics and Infrastructure | ||
| Seasonality Analysis | ||
| Cote d'Ivoire | Production Analysis (Area Harvested, Yield, and Production Volume) | |
| Consumption Analysis (Consumption Value and Volume) | ||
| Import Market Analysis (Import Value, Volume, and Key Supplying Markets) | ||
| Export Market Analysis (Export Value, Volume, and Key Destination Markets) | ||
| Wholesale Price Trend Analysis and Forecast | ||
| Regulatory Framework | ||
| List of Key Players | ||
| Logistics and Infrastructure | ||
| Seasonality Analysis | ||
| Madagascar | Production Analysis (Area Harvested, Yield, and Production Volume) | |
| Consumption Analysis (Consumption Value and Volume) | ||
| Import Market Analysis (Import Value, Volume, and Key Supplying Markets) | ||
| Export Market Analysis (Export Value, Volume, and Key Destination Markets) | ||
| Wholesale Price Trend Analysis and Forecast | ||
| Regulatory Framework | ||
| List of Key Players | ||
| Logistics and Infrastructure | ||
| Seasonality Analysis | ||
| Mali | Production Analysis (Area Harvested, Yield, and Production Volume) | |
| Consumption Analysis (Consumption Value and Volume) | ||
| Import Market Analysis (Import Value, Volume, and Key Supplying Markets) | ||
| Export Market Analysis (Export Value, Volume, and Key Destination Markets) | ||
| Wholesale Price Trend Analysis and Forecast | ||
| Regulatory Framework | ||
| List of Key Players | ||
| Logistics and Infrastructure | ||
| Seasonality Analysis | ||
| Ghana | Production Analysis (Area Harvested, Yield, and Production Volume) | |
| Consumption Analysis (Consumption Value and Volume) | ||
| Import Market Analysis (Import Value, Volume, and Key Supplying Markets) | ||
| Export Market Analysis (Export Value, Volume, and Key Destination Markets) | ||
| Wholesale Price Trend Analysis and Forecast | ||
| Regulatory Framework | ||
| List of Key Players | ||
| Logistics and Infrastructure | ||
| Seasonality Analysis | ||
| Senegal | Production Analysis (Area Harvested, Yield, and Production Volume) | |
| Consumption Analysis (Consumption Value and Volume) | ||
| Import Market Analysis (Import Value, Volume, and Key Supplying Markets) | ||
| Export Market Analysis (Export Value, Volume, and Key Destination Markets) | ||
| Wholesale Price Trend Analysis and Forecast | ||
| Regulatory Framework | ||
| List of Key Players | ||
| Logistics and Infrastructure | ||
| Seasonality Analysis | ||
| Cameroon | Production Analysis (Area Harvested, Yield, and Production Volume) | |
| Consumption Analysis (Consumption Value and Volume) | ||
| Import Market Analysis (Import Value, Volume, and Key Supplying Markets) | ||
| Export Market Analysis (Export Value, Volume, and Key Destination Markets) | ||
| Wholesale Price Trend Analysis and Forecast | ||
| Regulatory Framework | ||
| List of Key Players | ||
| Logistics and Infrastructure | ||
| Seasonality Analysis | ||
| Guinea | Production Analysis (Area Harvested, Yield, and Production Volume) | |
| Consumption Analysis (Consumption Value and Volume) | ||
| Import Market Analysis (Import Value, Volume, and Key Supplying Markets) | ||
| Export Market Analysis (Export Value, Volume, and Key Destination Markets) | ||
| Wholesale Price Trend Analysis and Forecast | ||
| Regulatory Framework | ||
| List of Key Players | ||
| Logistics and Infrastructure | ||
| Seasonality Analysis | ||
| Sierra Leone | Production Analysis (Area Harvested, Yield, and Production Volume) | |
| Consumption Analysis (Consumption Value and Volume) | ||
| Import Market Analysis (Import Value, Volume, and Key Supplying Markets) | ||
| Export Market Analysis (Export Value, Volume, and Key Destination Markets) | ||
| Wholesale Price Trend Analysis and Forecast | ||
| Regulatory Framework | ||
| List of Key Players | ||
| Logistics and Infrastructure | ||
| Seasonality Analysis | ||
| Niger | Production Analysis (Area Harvested, Yield, and Production Volume) | |
| Consumption Analysis (Consumption Value and Volume) | ||
| Import Market Analysis (Import Value, Volume, and Key Supplying Markets) | ||
| Export Market Analysis (Export Value, Volume, and Key Destination Markets) | ||
| Wholesale Price Trend Analysis and Forecast | ||
| Regulatory Framework | ||
| List of Key Players | ||
| Logistics and Infrastructure | ||
| Seasonality Analysis | ||
| South Africa | Production Analysis (Area Harvested, Yield, and Production Volume) | |
| Consumption Analysis (Consumption Value and Volume) | ||
| Import Market Analysis (Import Value, Volume, and Key Supplying Markets) | ||
| Export Market Analysis (Export Value, Volume, and Key Destination Markets) | ||
| Wholesale Price Trend Analysis and Forecast | ||
| Regulatory Framework | ||
| List of Key Players | ||
| Logistics and Infrastructure | ||
| Seasonality Analysis | ||


Key Questions Answered in the Report
What is the projected value of the Africa rice market in 2031?
The Africa rice market is forecast to reach USD 38.30 billion by 2031.
Which country currently holds the largest share of Africa’s rice output?
Nigeria leads with 20.5% of Africa rice market share in 2025.
Which geography is expected to record the fastest growth through 2031?
Tanzania is projected to expand at a 5.5% CAGR between 2026 and 2031.
How are carbon credits influencing rice farming economics?
Alternate wetting and drying pilots in Tanzania and Madagascar generate up to USD 4.50 per metric ton of paddy, offsetting irrigation and monitoring costs.
Why is post-harvest loss a critical issue for African rice growers?
Rudimentary sun-drying and porous storage destroy 15% to 18% of harvested paddy, cutting farmer income and reducing available supply for mills.
Page last updated on:


