Market Overview
| Study Period | 2020 - 2030 |
|---|---|
| Forecast Data Period | 2025 - 2030 |
| Historical Data Period | 2020 - 2023 |
| Market Size (2025) | USD 6.28 Million |
| Market Size (2030) | USD 9.03 Million |
| Growth Rate (2025 - 2030) | 7.53% CAGR |
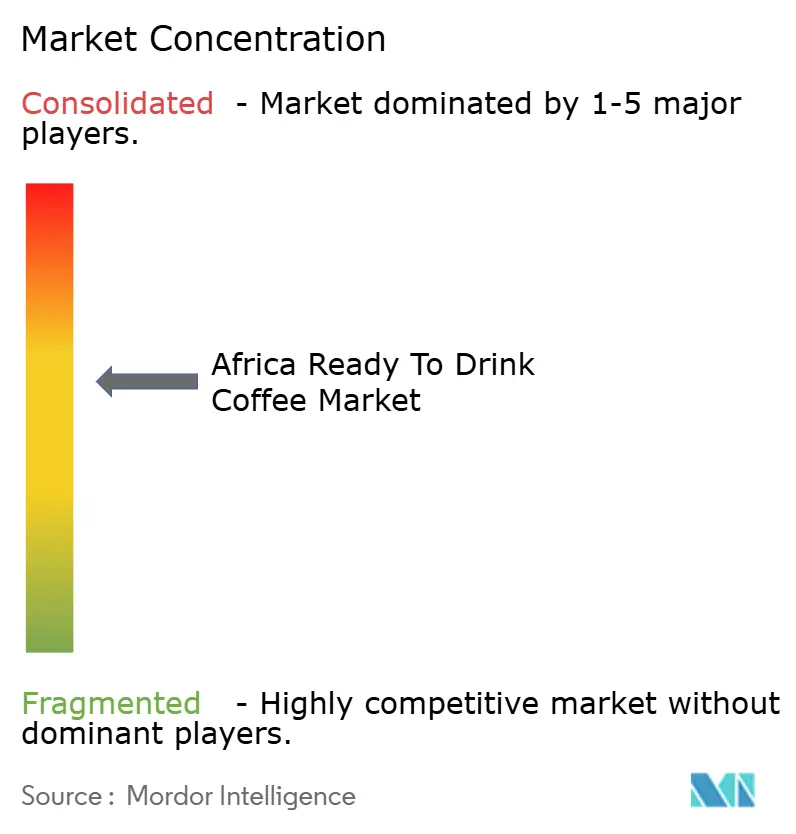
| Market Concentration | Medium |
Major Players *Disclaimer: Major Players sorted in no particular order Image © Mordor Intelligence. Reuse requires attribution under CC BY 4.0. | |

Africa Ready To Drink Coffee Market Analysis by Mordor Intelligence
The Africa ready-to-drink coffee market is projected to be valued at USD 6.28 million in 2025 and is expected to reach USD 9.03 million by 2030, growing at a compound annual growth rate (CAGR) of 7.53% during the forecast period. This growth highlights a significant shift in beverage consumption patterns, driven by factors such as urbanization, the recovery of the tourism sector, and increased investments in cold-chain infrastructure, which are collectively stimulating demand across the continent. Urbanization is playing a pivotal role in reshaping consumer preferences, as a growing number of people in Africa's urban centers are adopting convenient and ready-to-consume beverage options. The increasing pace of urban development has led to a rise in disposable incomes and changing lifestyles, further boosting the demand for ready-to-drink coffee products. Additionally, the recovery of the tourism sector has been a key driver of market growth. With the easing of travel restrictions and a resurgence in international tourism, the hospitality industry has witnessed increased consumption of premium and ready-to-drink coffee offerings, particularly in hotels, cafes, and airports. According to the Egyptian Tourism Federation, the tourism industry recorded its strongest performance in years, with over 15.7 million visitors arriving in Egypt in 2024 [1]Source: State Information Service, Egypt, “Egypt Welcomes 16 Million Tourists in 2024,” sis.gov.eg. This surge in tourism has significantly contributed to the growth of the ready-to-drink coffee market, as tourists increasingly seek convenient beverage options during their travels. The robust performance of Egypt's tourism sector underscores its critical role in driving market demand and highlights the country's dominance in the region's ready-to-drink coffee market.
Key Report Takeaways
- By coffee type, Other RTD Coffee captured 43.42% of the Africa ready-to-drink coffee market share in 2024, while cold brew coffee is projected to expand at a 9.04% CAGR through 2030.
- By functionality, standard variants accounted for 74.13% of the Africa ready-to-drink coffee market size in 2024, whereas protein-enriched products are advancing at a 9.56% CAGR over 2025-2030.
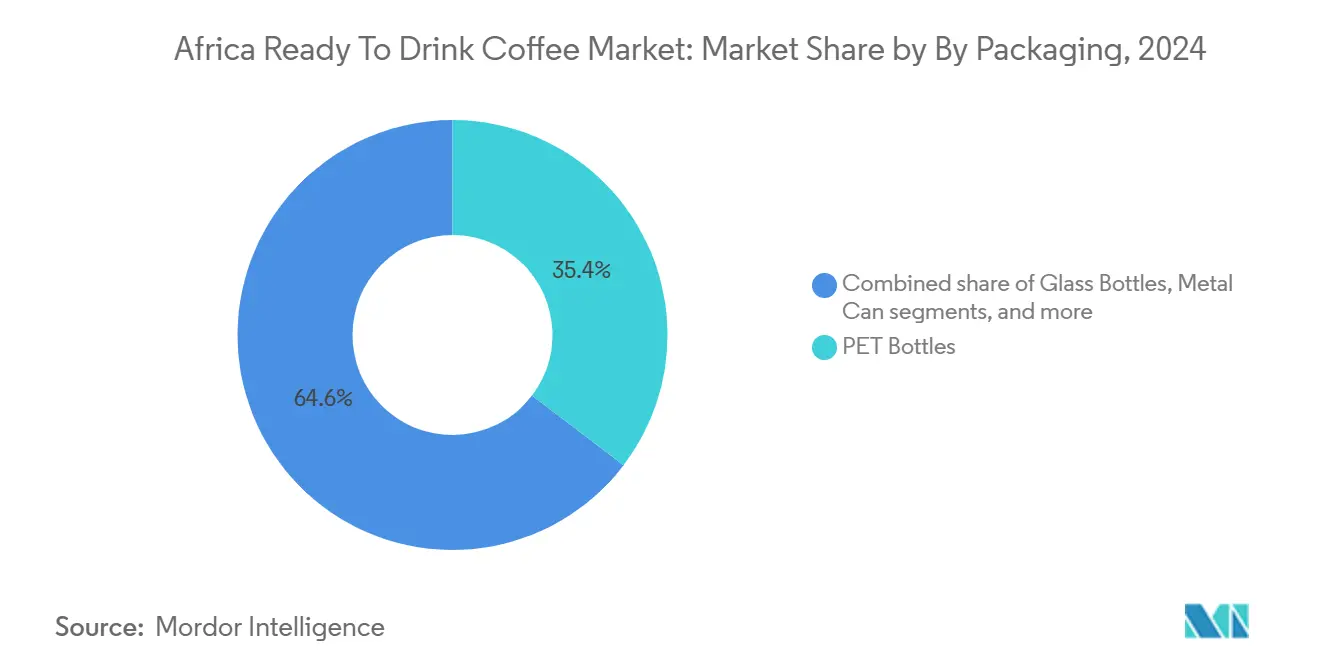
- By packaging, PET bottles held 35.36% of revenue in 2024, yet aseptic formats are growing fastest at 10.05% CAGR thanks to ambient stability.
- By distribution, off-trade channels led with 38.48% share in 2024, while on-trade venues are forecast to post a 10.11% CAGR to 2030 as café culture accelerates.
- By geography, Egypt dominated with 85.21% of 2024 value, whereas Nigeria is set to register the highest 9.78% CAGR during 2025-2030 on the back of its 230 million population.
Market Trends and Insights
Drivers Impact Analysis of Africa Ready To Drink Coffee Market*
| Driver | (~) % Impact on CAGR Forecast | Geographic Relevance | Impact Timeline |
|---|---|---|---|
| Convenience appeal for busy urban lifestyles and travelers | +1.8% | Egypt, South Africa, Nigeria (urban centers: Cairo, Johannesburg, Lagos, Abuja) | Short term (≤ 2 years) |
| Rising coffee culture influenced by global trends | +1.5% | Egypt, South Africa, Kenya; spillover to Nigeria, Ghana | Medium term (2-4 years) |
| Popularity of cold brew and nitro innovations among youth | +1.2% | South Africa, Kenya; emerging in Egypt, Nigeria | Medium term (2-4 years) |
| Product diversification into specialty iced varieties | +1.0% | Egypt, South Africa, Kenya; early adoption in Nigeria | Medium term (2-4 years) |
| Shift toward functional beverages for daily energy | +1.1% | South Africa, Nigeria, Egypt; expanding to East Africa | Short term (≤ 2 years) |
| Health-focused formulations with added vitamins and low sugar | +0.9% | South Africa, Egypt, Kenya; growing in Nigeria | Long term (≥ 4 years) |
| Source: Mordor Intelligence | |||


Convenience appeal for busy urban lifestyles and travelers
Urban density and tourism recovery are reshaping consumption occasions, making grab-and-go formats essential for time-constrained consumers. Egypt's 15.7 million tourist arrivals in 2024 created a captive audience for chilled RTD coffee at airports, hotels, and transit hubs, while Nigeria's 232.68 million population and rising urbanization in Lagos and Abuja are driving demand for portable energy solutions [2]Source: The World Bank Group, “Population, total - Nigeria,” data.worldbank.org. A key driver for the RTD coffee market in Nigeria, South Africa, Kenya, and Ethiopia is the impact of affordability pressures, which are steering consumers toward value-focused purchases. Despite this, convenience formats maintain customer loyalty when priced competitively. Additionally, the expansion of intra-African travel and business corridors is increasing the importance of ambient-stable RTD coffee for long-distance transport and informal retail. This trend is particularly significant in the short term, as advancements in cold-chain infrastructure and retail distribution enable immediate entry into urban markets.
Rising coffee culture influenced by global trends
Specialty coffee appreciation is diffusing from expatriate and affluent segments into mainstream urban markets, driven by café proliferation and social media exposure to global coffee rituals. South Africa’s coffee market is experiencing strong growth, with Pret A Manger set to enter the market and established brands like Vida e Caffé, Seattle Coffee, and Starbucks expanding their presence. Java House's 100 outlets across Kenya, Uganda, and Rwanda serve as cultural anchors, normalizing premium coffee consumption and creating brand equity that can be leveraged for RTD extensions. The International Trade Centre's work with African coffee entrepreneurs to promote specialty varieties such as Liberica and Arabusta is enhancing the continent's positioning as both a producer and consumer of differentiated coffee.
Popularity of cold brew and nitro innovations among youth
Cold brew's smooth, less acidic profile and nitro coffee's creamy texture without the use of dairy appeal to younger demographics seeking visually appealing and functional beverages. These attributes make cold brew and nitro coffee particularly attractive to health-conscious consumers who prefer beverages with lower acidity and minimal additives. In South Africa, the ready-to-drink coffee market is experiencing significant growth, with cold brew identified by local retailers as a key driver of this momentum. Retailers are increasingly dedicating shelf space to cold brew products, reflecting its rising popularity among consumers. In Nairobi, platforms such as Greenspoon are showcasing cold brew options, indicating niche experimentation within East Africa. This experimentation highlights the growing interest in premium coffee products across the region, driven by urbanization and a shift in consumer preferences toward convenience and quality. Moreover, targeted marketing efforts aimed at younger consumers, combined with premium positioning, allow cold brew to command higher margins, offsetting the additional costs associated with extended steeping times and specialized equipment. Furthermore, the premium pricing strategy aligns with the perception of cold brew as a high-quality, artisanal product, which resonates with consumers willing to pay a premium for unique and innovative beverage experiences.
Health-focused formulations with added vitamins and low sugar
Functional nutrition is expanding beyond sports supplements into everyday beverages, with protein-enriched and vitamin-fortified ready-to-drink (RTD) coffee forming a hybrid category. This trend is driven by increasing consumer demand for convenient, health-focused products that align with active lifestyles. For instance, Herbalife introduced High Protein Iced Coffee in South Africa, which contains 15 grams of whey protein, 80 milligrams of caffeine, and no added sugar. This product targets fitness-conscious consumers looking for post-workout recovery and sustained energy, highlighting the growing preference for beverages that combine functionality with convenience. Additionally, the rise in awareness about the benefits of protein and vitamins, coupled with the busy schedules of modern consumers, is propelling the adoption of such hybrid beverages. Regulatory frameworks, such as Nigeria's NAFDAC labeling requirements, mandate clear disclosure of added ingredients, promoting transparency and enabling informed purchasing decisions [3]Source: National Agency for Food and Drug Administration and Control (Nigeria), “GUIDE TO FOOD LABELLING,” nafdac.gov.ng. These factors collectively contribute to the growth of the RTD coffee market by addressing consumer needs for health, convenience, and trust in product labeling.
Restraints Impact Analysis of Africa Ready To Drink Coffee Market*
| Restraint | (~) % Impact on CAGR Forecast | Geographic Relevance | Impact Timeline |
|---|---|---|---|
| Strong competition from traditional brewed coffee habits | -0.8% | Nigeria, Ethiopia, Kenya (high home-brewing prevalence) | Long term (≥ 4 years) |
| Competition from other RTD beverages | -0.6% | South Africa, Egypt, Nigeria (soft drinks, energy drinks, juices) | Short term (≤ 2 years) |
| High raw material costs impacting pricing | -1.2% | Global, acute in import-dependent markets (Egypt, South Africa, Nigeria) | Short term (≤ 2 years) |
| Inadequate cold chain infrastructure | -1.5% | Nigeria, Rest of Africa (rural and peri-urban areas) | Medium term (2-4 years) |
| Source: Mordor Intelligence | |||
Inadequate cold chain infrastructure
The distribution of chilled RTD coffee relies on consistent refrigeration from production to retail. However, significant portions of Africa face challenges due to unreliable electricity and underdeveloped logistics networks, which hinder the maintenance of required temperatures. The World Bank's Cool Move initiative has identified East and Southern Africa as regions needing significant cold-chain investments, highlighting that current infrastructure limitations restrict the distribution of temperature-sensitive products outside major urban areas. The United Nations Economic Commission for Africa has emphasized that energy access is essential for processing and cold storage, with many rural regions still lacking grid connectivity. BeatRoute's analysis of FMCG distribution in Africa noted that informal trade and high logistics costs compel manufacturers to focus on ambient-stable formats instead of chilled products. This infrastructure gap is particularly pronounced in the medium term. While investments in solar-powered cold storage and mobile refrigeration units are gradually improving coverage, a complete resolution will require several years of capital investment and grid enhancements.
High raw material costs impacting pricing
Coffee bean prices surged to multi-decade highs in 2024, compressing margins for RTD producers and forcing difficult trade-offs between quality, volume, and retail price. The World Bank reported in January 2025 that the beverage price index rose 18% in December 2024, up 91% year-on-year and 58% for the full year, with Arabica surging 13% month-on-month in December and more than 60% year-on-year, while Robusta increased 5% month-on-month and doubled year-on-year [4]Source: International Coffee Organization, “Coffee Market Report 2025,” ico.org. The International Coffee Organization's composite indicator averaged 310.12 US cents per pound in January 2025, up 3.5% from December 2024, with Africa exporting 1.21 million bags in December 2024, an 8% increase year-on-year [5]Source: The World Bank Group, “Cocoa and coffee prices rebound on renewed supply concerns,” worldbank.org. Packaging materials add further cost pressure; ALPLA's sub-Saharan Africa operations produce more than 50,000 tons of PET annually, but resin prices are tied to crude oil volatility. Producers in price-sensitive markets face a short-term squeeze, as passing cost increases to consumers risks volume loss, yet absorbing them erodes profitability.
*Our forecasts treat driver/restraint impacts as directional, not additive. The impact forecasts reflect baseline growth, mix effects, and variable interactions.
Africa Ready To Drink Coffee Market Segment Analysis
By Coffee Type:
Cold Brew Gains as Specialty DifferentiatesOther RTD Coffee variants held 43.42% of the market in 2024, encompassing traditional iced coffee, flavored coffee drinks, and coffee-milk blends that appeal to mass-market tastes and price points. Cold brew coffee is expanding at a 9.04% CAGR for 2025-2030, the fastest rate within the coffee type segmentation, as consumers in South Africa and Kenya seek smoother, less acidic profiles that justify premium pricing. Iced coffee remains a volume driver, particularly in Egypt, where tourism and urban density support year-round demand for chilled beverages.
Iced coffee remains a popular entry point for first-time ready-to-drink (RTD) coffee consumers due to its accessibility and affordability. In contrast, cold brew's unique characteristics enable brands to diversify their portfolios and target higher-margin segments, including affluent and experimental buyers. Nitro coffee, while still a niche product, is gaining popularity in on-trade channels, where its draft-style presentation enhances the consumer experience and supports premium pricing. This market segmentation highlights a divide between mass-market convenience and specialty premiumization, with brands increasingly adopting tiered product lines to cater to both segments. Regulatory developments, such as the standards for non-alcoholic beverages introduced by the Tanzania Bureau of Standards and Kenya Bureau of Standards in April 2023, provide a framework for ensuring consistent product quality and labeling. As cold brew's compound annual growth rate (CAGR) surpasses the category average, investment is expected to shift toward specialty formats, while traditional iced coffee will likely focus on competing through price and distribution reach.


By Functionality:
Protein-Enriched Formats Redefine Energy DeliveryOther functionality variants commanded 74.13% of the market in 2024, representing standard RTD coffee products without added functional ingredients; however, protein-enriched formulations are growing at 9.56% CAGR for 2025-2030, the fastest rate in the functionality segmentation. Herbalife's High Protein Iced Coffee in South Africa, delivering 15 grams of whey protein and 80 milligrams of caffeine with zero added sugar, exemplifies the convergence of post-workout recovery and daily energy needs. Energy-infused variants, which layer caffeine with B-vitamins and taurine, occupy a middle ground, appealing to consumers seeking a boost without the full energy-drink intensity. The InnoFoodAfrica project's development of plant-based protein isolates from Bambara groundnut and cowpea concentrates offers locally sourced alternatives to imported whey, potentially lowering costs and enhancing clean-label positioning.
Protein-enriched coffee's rapid growth reflects a strategic repositioning of RTD coffee from a discretionary treat to a functional staple, competing directly with protein shakes and meal replacements. Energy-infused coffee appeals to shift workers, students, and urban professionals who require sustained alertness, while standard formulations retain the largest share by serving habitual coffee drinkers who prioritize taste and convenience over added benefits. With the CAGR of protein-enriched coffee increasing, brands are expected to expand SKU counts within this segment, experimenting with flavor profiles and protein sources to enhance consumer acceptance and encourage repeat purchases.
By Packaging Type:
Aseptic Formats Solve Cold-Chain ConstraintsPET bottles accounted for 35.36% of the market in 2024, driven by their lightweight, shatter-resistant properties and widespread consumer familiarity. However, aseptic packaging is projected to grow at a compound annual growth rate (CAGR) of 10.05% from 2025 to 2030, marking the fastest growth rate within the packaging segment. Aseptic technology enables ready-to-drink (RTD) coffee to be stored at ambient temperatures for extended periods without refrigeration, a significant advantage in regions with limited cold-chain infrastructure. For instance, Tetra Pak's participation at Propak West Africa 2024 showcased aseptic carton solutions and high-shear mixers for RTD beverages, underlining the technology's importance for African producers aiming to expand their distribution networks. ALPLA's operations in sub-Saharan Africa produce over 50,000 tons of PET annually, supplying multilayer barrier preforms that improve the shelf life of sensitive beverages. While metal cans hold a smaller market share, they offer premium positioning and recyclability.
Glass bottles, on the other hand, are preferred in on-premise and specialty channels due to their visual appeal and perceived quality, which justify their higher costs. Disposable cups remain relevant for on-trade and vending applications, although their environmental impact is increasingly scrutinized. The rapid growth of aseptic packaging is attributed to its ability to penetrate rural and peri-urban markets where refrigeration is inconsistent, thereby expanding the addressable market beyond urban areas. PET bottles are expected to maintain the largest market share due to their versatility and strong consumer acceptance. However, aseptic cartons are anticipated to capture additional volume in distribution channels that prioritize ambient stability over chilled storage. Regulatory developments, such as Tanzania's new standards for liquid coffee and coffee premix, effective December 2024, will also influence packaging choices by defining permissible materials and labeling requirements.
By Distribution Channel:
On-Trade Surge Reflects PremiumizationOff-trade channels accounted for 38.48% of the market in 2024, including supermarkets, hypermarkets, convenience stores, specialty stores, and online retail. However, on-trade channels are projected to grow at a compound annual growth rate (CAGR) of 10.11% from 2025 to 2030, marking the fastest growth within the distribution segment. According to W Hospitality's pipeline data, 524 planned hotels with 92,193 rooms are under development across Africa, with resorts increasing their share to 30% and Zanzibar's hotel inventory doubling. This growth is expected to drive on-trade demand for premium ready-to-drink (RTD) coffee. Simbisa Brands operates 604 company-owned counters across Africa, further expanding quick-service restaurant networks that offer RTD coffee.
In the off-trade segment, supermarkets and hypermarkets hold a dominant position in South Africa and Egypt, where organized retail markets are well-established. In contrast, convenience stores are gaining market share in Nigeria and Kenya, driven by urbanization and the increasing demand for grab-and-go formats. The eCommerce channel for coffee products is expanding, indicating that digital platforms are becoming more significant as logistics and payment systems improve. Specialty stores focus on premium and organic segments, offering curated product assortments that attract discerning consumers. The rapid growth of the on-trade segment highlights a trend toward premiumization, with cafés, restaurants, and hotels charging higher prices for chilled RTD coffee compared to retail outlets, appealing to consumers who value ambiance and service.
Geography Analysis
Egypt Ready To Drink Coffee Market
Egypt's 85.21% market share in 2024 reflects its unique combination of population density, tourism infrastructure, and retail maturity, positioning it as the continent's RTD coffee epicenter. Tourism delivered 15.7 million visitors in 2024, creating high-velocity consumption occasions at airports, hotels, and transit hubs where chilled RTD coffee is a natural fit. Young urban consumers in Cairo and Alexandria are driving coffee shop culture, with international chains and local roasters proliferating, a trend that primes the market for branded RTD extensions. Nestlé's historical investments in Egypt, including the 2017 acquisition of Caravan Marketing, underscore the market's strategic importance for multinational FMCG players.
Nigeria Ready To Drink Coffee Market
Nigeria is projected to grow at a CAGR of 9.78% from 2025 to 2030, marking the fastest growth rate among geographies, driven by its population of 232.68 million. Despite high inflation and foreign exchange volatility creating affordability challenges, the large consumer base presents significant volume potential for brands that can adopt competitive pricing strategies. Grassroots initiatives, such as Zuma Coffee, are educating consumers on coffee quality and brewing techniques, fostering the foundation for premiumization. Digital channels are expected to gain importance as smartphone penetration and payment infrastructure continue to improve. Nigeria's NAFDAC enforces stringent labeling requirements for pre-packaged beverages, including ingredient disclosure, net content, manufacturer details, production and expiration dates, barcodes, and batch numbers. While these regulations increase compliance costs, they enhance consumer protection.
South Africa and East Africa Ready To Drink Coffee Market
South Africa and the broader African region represent a smaller share of the market, with South Africa serving as a testing ground for premium and functional product innovations. The country's coffee market is experiencing significant growth, highlighted by Pret A Manger's plans to enter the market and the expansion of established brands like Vida e Caffé and Seattle Coffee. Additionally, Java House, with 100 outlets across Kenya, Uganda, and Rwanda, and its January 2025 acquisition by Dangote-backed Alterra Capital, reflects efforts by regional players to consolidate assets and enhance distribution capabilities.
Competitive Landscape
The Africa ready-to-drink coffee market exhibits moderate concentration, as global multinationals leverage manufacturing scale and distribution networks while regional bottlers and café chains exploit local market knowledge and route-to-market advantages. African conglomerates are moving to consolidate on-trade assets, potentially accelerating the rollout of branded RTD lines through captive retail networks. Strategy patterns emphasize portfolio breadth, with players offering tiered product lines spanning mass-market iced coffee, premium cold brew, and functional variants to address diverse price points and consumption occasions.
White-space opportunities exist in protein-enriched formulations, aseptic packaging for rural distribution, and localized flavor profiles that incorporate African ingredients such as cascara and indigenous spices. ofi (Olam Food Ingredients) developed a process to rescue coffee pulp from estates in Tanzania, Zambia, and the Democratic Republic of Congo, producing a soluble cascara powder certified by the Upcycled Food Association and suitable for iced teas and energy drinks, a technology that could be adapted for RTD coffee to enhance sustainability credentials.
Emerging disruptors include specialty roasters which can leverage premium positioning and direct farmer relationships to differentiate in a market dominated by mass-market brands. Technology adoption is accelerating, with Tetra Pak's high-shear mixers enabling consistent emulsification for milk-based RTD coffee and ALPLA's multilayer PET preforms extending shelf life without refrigeration. Regulatory compliance is becoming a competitive factor; Tanzania's December 2024 standards for liquid coffee, instant coffee, and coffee premix establish quality benchmarks that favor established players with in-house testing capabilities over smaller entrants
Africa Ready To Drink Coffee Industry Leaders
Keurig Dr Pepper, Inc.
Nestle S.A.
The Coca-Cola Company
Woolworths Holdings Limited
Java House Group
- *Disclaimer: Major Players sorted in no particular order
Africa Ready To Drink Coffee Market Companies Covered in this Report
- Nestlé S.A.
- The Coca-Cola Company
- Keurig Dr Pepper Inc.
- Woolworths Holdings Ltd.
- Java House Group
- Arla Foods amba
- King Car Group
- Starbucks Corp.
- Suntory Holdings Ltd.
- JAB Holding (Co-via Peet’s/Caribou)
- Monster Beverage Corp.
- Caffè Concerto Africa
- Del Monte Kenya
- House of Coffees (AVI Ltd.)
- Mukuru Coffee (Egypt)
- Costa Coffee
- Stok
- Las Vegas Coffee
- Coffee Shot

Recent Industry Developments in Africa Ready To Drink Coffee Market
- September 2025: Kenyan coffee and casual dining chain Java House has expanded to 100 outlets across East Africa, marked by the opening of a new location in Kampala, Uganda.
- May 2025: Starbucks has reintroduced four Ready-to-Drink chilled coffee beverages to the South African market, inspired by its popular coffeehouse offerings. The Starbucks Frappuccino Ready-to-Drink range is available at major retailers such as Pick n Pay, Spar, and Checkers, as well as at forecourts, selected airports, universities, and beach bars across South Africa.
- March 2025: Dangote-backed Alterra Capital and Phatisa Group acquired Java House from Actis, consolidating ownership of 100 outlets across Kenya, Uganda, and Rwanda and positioning the new owners to scale on-trade presence and potentially launch branded RTD coffee lines through captive retail networks.


Africa Ready To Drink Coffee Market Report Scope
Cold Brew Coffee, Iced coffee are covered as segments by Soft Drink Type. Aseptic packages, Glass Bottles, Metal Can, PET Bottles are covered as segments by Packaging Type. Off-trade, On-trade are covered as segments by Distribution Channel. Egypt, Nigeria, South Africa are covered as segments by Country.Segmentation Overview
By Coffee Type
| Iced coffee |
| Cold brew coffee |
| Other RTD Coffee |
By Functionality
| Protein-Enriched |
| Energy-Infused |
| Other |
By Packaging Type
| PET Bottles |
| Glass Bottles |
| Metal Can |
| Aseptic Packages |
| Disposable Cups |
By Distribution Channel
| On-Trade | |
| Off-Trade | Supermarket/Hypermarket |
| Convenience Stores | |
| Specialty Stores | |
| Online Retail | |
| Other Distribution Channels |
By Country
| South Africa |
| Egypt |
| Nigeria |
| Rest of Africa |
| By Coffee Type | Iced coffee | |
| Cold brew coffee | ||
| Other RTD Coffee | ||
| By Functionality | Protein-Enriched | |
| Energy-Infused | ||
| Other | ||
| By Packaging Type | PET Bottles | |
| Glass Bottles | ||
| Metal Can | ||
| Aseptic Packages | ||
| Disposable Cups | ||
| By Distribution Channel | On-Trade | |
| Off-Trade | Supermarket/Hypermarket | |
| Convenience Stores | ||
| Specialty Stores | ||
| Online Retail | ||
| Other Distribution Channels | ||
| By Country | South Africa | |
| Egypt | ||
| Nigeria | ||
| Rest of Africa | ||


Market Definition
- Carbonated Soft Drinks (CSDs) - Carbonated soft drinks (CSDs) refer to non-alcoholic beverages that are carbonated and typically flavored, containing dissolved carbon dioxide to create effervescence. These beverages commonly include cola, lemon-lime, orange, and various fruit-flavored sodas. Marketed in cans, bottles, or fountain dispense.
- Juices - We have considered packaged juices which encompass non-alcoholic beverages derived from fruits, vegetables, or a combination thereof, processed and sealed in various packaging formats such as bottles, cartons, or pouches. Excluding fresh juices, this market segment involves commercially prepared and preserved juices, often with added preservatives and flavors.
- Ready-to-Drink (RTD) Tea and RTD Coffee - Ready-to-Drink (RTD) tea and RTD coffee are pre-packaged, non-alcoholic beverages that are brewed and prepared for consumption without further dilution. RTD tea typically includes various tea varieties, infused with flavors and sweeteners, and comes in bottles, cans, or cartons. Similarly, RTD coffee involves pre-brewed coffee formulations, often mixed with milk, sugar, or flavorings, and is conveniently packaged for on-the-go consumption.
- Energy Drinks - Energy drinks are non-alcoholic beverages formulated to provide a quick boost of energy and alertness. Whereas, sports drinks are beverages designed to hydrate and replenish electrolytes, particularly after physical exertion, exercise, or intense activity
| Keyword | Definition |
|---|---|
| Carbonated Soft Drinks | Carbonated soft drinks (CSDs) are a combination of carbonated water and flavouring, sweetened by sugar or a non-sugar sweeteners. |
| Standard Cola | Standard Cola is defined as the original flavor of cola soda. |
| Diet Cola | A cola-based soft drink containing no or low amounts of sugar |
| Fruit Flavored Carbonates | A carbonated beverage prepared from fruit juice/fruit flavor with carbonated water and containing sugar, dextrose, invert sugar or liquid glucose either singly or in combination. It may contain peel oil and fruit essences. |
| Juice | Juice is a drink made from the extraction or pressing of the natural liquid contained in fruit and vegetables. |
| 100% Juice | Fruit/vegetable juice made from fruit in the form of its juice with no water added to make up the volume. It is not permitted to add sugars, sweeteners, preservatives, flavourings or colourings to fruit juice. |
| Juice Drinks (up to 24% Juice) | Fruit/vegetable juice drinks with up to 24% fruits/vegetable extract. |
| Nectars (25-99% Juice) | Juices that can have between 25 and 99% of fruit, with the minimum legal limits defined depending on the type of fruit |
| Juice concentrates | Juice Concentrates are those form of juices when most of this liquid is removed resulting in a thick, syrupy product known as juice concentrate. |
| RTD Coffee | Packaged coffee beverages that are sold in a prepared form and are ready for consumption at the time of purchase. |
| Iced Coffee | An iced coffee is a cold version of coffee, usually a combination of hot espresso and milk with ice added to it. |
| Cold Brew Coffee | Cold brew also called cold water extraction or cold pressing is made by steeping ground coffee in room-temperature water for several hours. |
| RTD Tea | Ready-to-drink (RTD) tea is a packaged tea product ready for immediate consumption without brewing or preparation |
| Iced Tea | Ice tea or iced tea is a drink made from tea without milk but with sugar and sometimes fruit flavourings, drunk cold. |
| Green Tea | Green tea is a tea beverage which promotes mental alertness, relieving digestive symptoms and promoting weight loss. |
| Herbal Tea | Herbal tea beverages are made from the infusion or decoction of herbs, spices, or other plant material in hot water. |
| Energy Drink | A type of drink containing stimulant compounds, usually caffeine, which is marketed as providing mental and physical stimulation. They may or may not be carbonated and may also contain sugar, other sweeteners, or herbal extracts, among numerous possible ingredients. |
| Sugar-free or Low-calories Energy Drinks | Sugar-free or Low-calories Energy Drinks are sugar-free, artificially sweetened energy drinks with few or no calories. |
| Traditional Energy Drink | Traditional Energy Drinks are functional soft drinks containing ingredients designed to boost the consumer's energy. |
| Natural/Oraganic Energy Drinks | Natural/Organic energy drinks are energy drinks free of artificial sweeteners and synthetic colorings. Instead, they contain naturally derived ingredients such as green tea, yerba mate, and botanical extracts. |
| Energy Shots | A small but highly concentrated energy drink that contains large amounts of caffeine and/or other stimulants. The quantity is comparatively smaller compared to energy drinks. |
| Sports Drink | Sports drinks are beverages designed specifically for the rapid supply of fluid, carbohydrates, and electrolytes before, during or after exercise. |
| Isotonic | Isotonic drinks contain similar concentrations of salt and sugar as in the human body, and are designed to quickly replace fluids lost during exercise but with an increase of carbohydrate. |
| Hypertonic | Hypertonic drinks have a higher concentration of salt and sugar than the human body. They are best drunk after exercise as it is important to replace glycogen levels quickly after exercise. |
| Hypotonic | Hypotonic drinks are designed to quickly replace fluids lost during exercise. They have very low carbohydrate content and a lower concentration of salt and sugar than the human body. |
| Electrolyte-Enhanced Water | Electrolyte water is water infused with electrically-charged minerals, such as sodium, potassium, calcium, and magnesium. |
| Protein-based Sport Drinks | Protein-based sports drinks are those sports drinks which has added protein in it that will improve performance and reduce muscle protein breakdown. |
| On-Trade | The on-trade refers to places that sell beverages for immediate consumption on the premises like bars, restaurants, and pubs |
| Off-Trade | Off-trade usually means places like liquor stores, supermarkets and other places where you don't consume the beverage right away. |
| Convenience Store | A retail business that provides the public with a convenient location to quickly purchase a wide variety of consumable products and services, generally food and gasoline. |
| Specialty store | A specialty store is a shop/store that carries a deep assortment of brands, styles, or models within a relatively narrow category of goods |
| Online Retail | Online retail is a type of eCommerce whereby a business sells goods or services directly to consumers from a website. |
| Aseptic Packaging | Aseptic packaging refers to the filling of a cold, commercially sterile product under sterile conditions into a presterilized container and closure under sterile conditions to form a seal that effectively excludes microorganisms. These includes tetra packs, cartons, pouches etc. |
| PET Bottle | PET bottle means a bottle made of polyethylene terephthalate. |
| Metal Cans | Metal containers made of aluminum or tin- plated or zinc-plated steel, which are commonly used for packaging food, beverages or other products. |
| Disposable Cups | Disposable Cup means a cup or other container designed for single use to serve beverages, such as water, cold drinks, hot drinks and alcoholic beverages. |
| Gen Z | A way of referring to the group of people who were born in the late 1990s and early 2000s. |
| Millenial | Anyone born between 1981 and 1996 (ages 23 to 38 in 2019) is considered a Millennial |
| Taurine | Taurine is an amino acid that supports immune health and nervous system function. |
| Bars & Pubs | It is a drinking establishment licensed to serve alcoholic drinks for consumption on the premises. |
| Café | It is a foodservice establishment serving refreshments (mainly coffee) and light meals. |
| On the go | It means doing / dealing with while busily engaged with something and not diverting plans in order to accommodate. |
| Internet Penetration | The Internet Penetration Rate corresponds to the percentage of the total population of a given country or region that uses the Internet. |
| Vending Machine | A machine that dispenses small articles such as food, drinks, or cigarettes when a coin or token is inserted |
| Discount store | A discount store or discounter offers a retail format in which products are sold at prices that are in principle lower than an actual or supposed "full retail price". Discounters rely on bulk purchasing and efficient distribution to keep down costs. |
| Clean Label | Clean label on the beverage market are drinks that are made from few ingredients of natural origin and are not or only slightly processed. |
| Caffeine | An alkaloid compound which is a stimulant of the central nervous system. It is mainly used recreationally, as a mild cognitive enhancer to increase alertness and attentional performance. |
| Extreme sport | Action sports, adventure sports or extreme sports are activities perceived as involving a high degree of risk. |
| High-intensity interval training | It incorporates several rounds that alternate between several minutes of high intensity movements to significantly increase the heart rate to at least 80% of one's maximum heart rate, followed by short periods of lower intensity movements. |
| Shelf life | The length of time for which an item remains usable, fit for consumption, or saleable. |
| Cream Soda | Cream soda is a sweet soft drink. Generally flavored with vanilla and based on the taste of an ice cream float |
| Root Beer | Root beer is a sweet North American soft drink traditionally made using the root bark of the sassafras tree Sassafras albidum or the vine of Smilax ornata as the primary flavor. Root beer is typically, but not exclusively, non-alcoholic, caffeine-free, sweet, and carbonated. |
| Vanilla Soda | A carbonated soft drink flavoured with vanilla. |
| Dairy-Free | A product that does not contain any milk or milk products from cows, sheep or goats. |
| Caffeine-Free Energy Drinks | Caffeine-free energy drinks rely on other ingredients to boost the energy. Popular choices include amino acids, B vitamins, and electrolytes. |


Research Methodology
Mordor Intelligence follows a four-step methodology in all our reports.
- Step-1: IDENTIFY KEY VARIABLES: In order to build a robust forecasting methodology, the variables and factors identified in Step 1 are tested against available historical market numbers. Through an iterative process, the variables required for market forecast are set, and the model is built on the basis of these variables.
- Step-2: Build a Market Model: Market-size estimations for the forecast years are in nominal terms. Inflation is not a part of the pricing, and the average selling price (ASP) is kept constant throughout the forecast period for each country.
- Step-3: Validate and Finalize: In this important step, all market numbers, variables, and analyst calls are validated through an extensive network of primary research experts from the market studied. The respondents are selected across levels and functions to generate a holistic picture of the market studied.
- Step-4: Research Outputs: Syndicated reports, custom consulting assignments, databases & subscription platforms


