
Africa Electric Vehicle Market Analysis by Mordor Intelligence
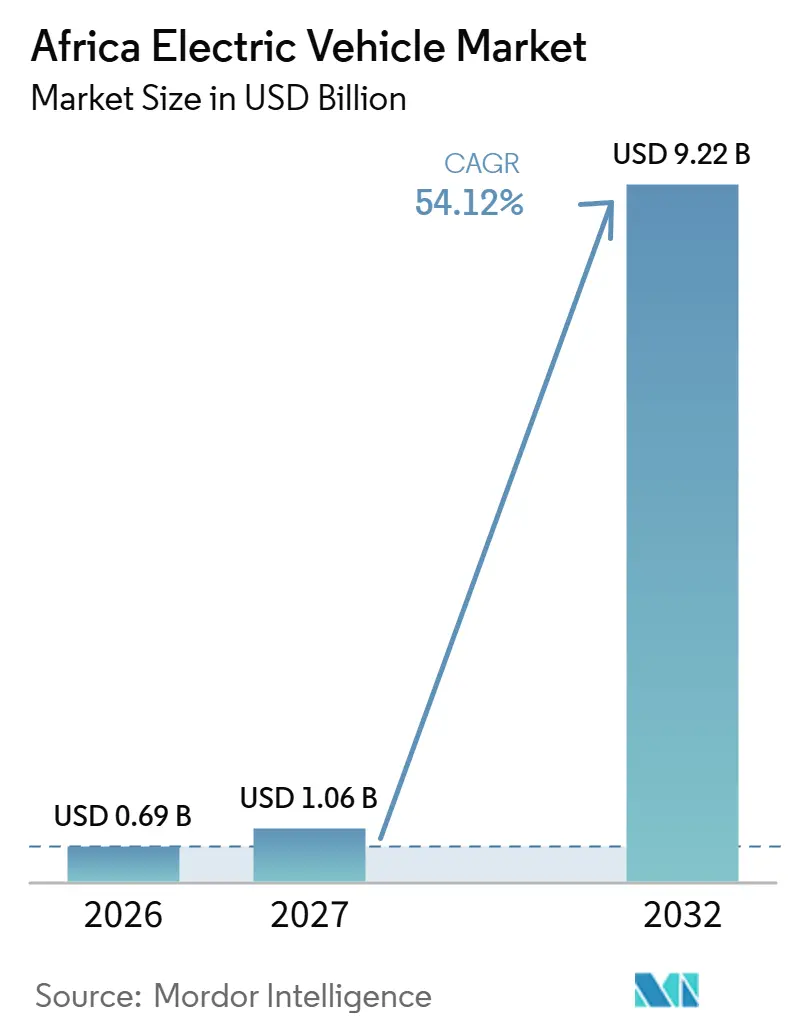
The Africa electric vehicle market size is expected to grow from USD 0.69 billion in 2026 to USD 1.06 billion in 2027 and is forecast to reach USD 9.22 billion by 2032 at 54.12% CAGR over 2027-2032.
Lower battery-pack prices and import-tax relief can widen affordability when suppliers pass cost savings into vehicle prices. Urban motorcycle fleets in Ethiopia concentrate demand around delivery operations with identifiable customers and service territories. Supplier-linked financing provides another route from transport needs to prospective vehicle purchases. Charging capital requirements and unreliable power can nevertheless limit the operating territories in which purchased vehicles can be used. These forces favor concentrated urban fleets with identifiable demand over expansion that relies on dispersed charging access.
Key Report Takeaways
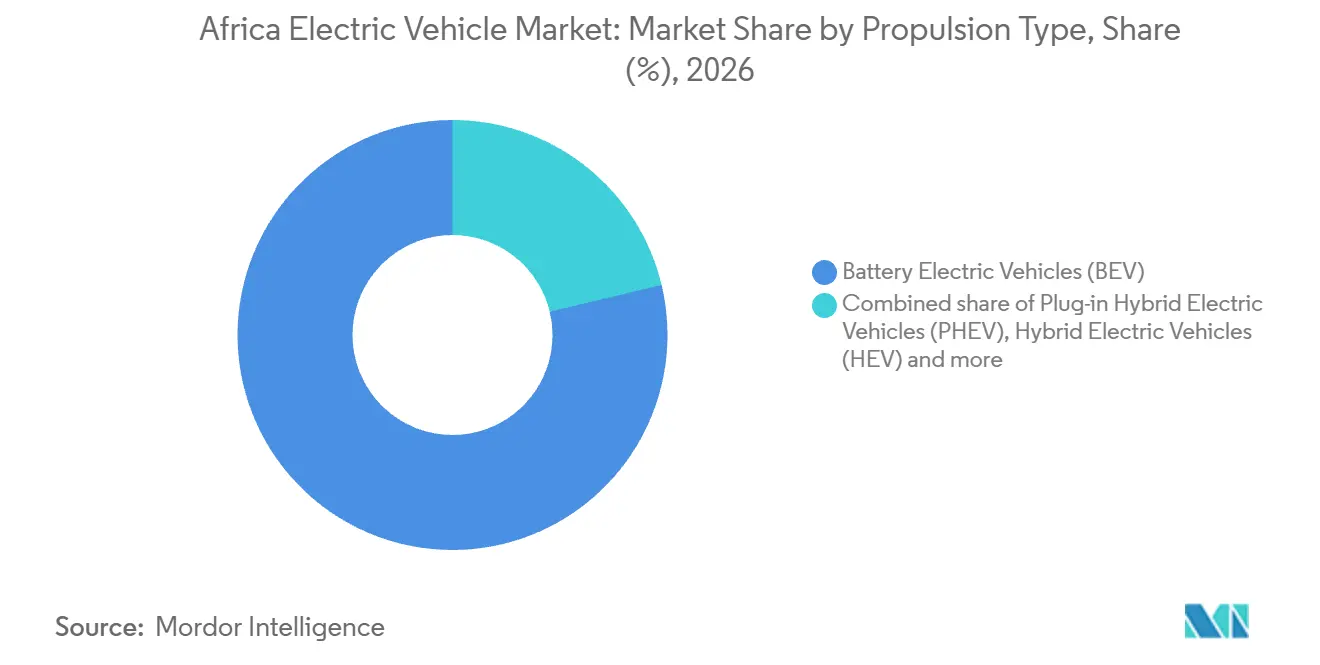
- By propulsion type, battery electric vehicles led with a 78.74% Africa electric vehicle market share in 2026, while fuel-cell electric vehicles are forecast to grow fastest at a 56.62% CAGR over 2027-2032.
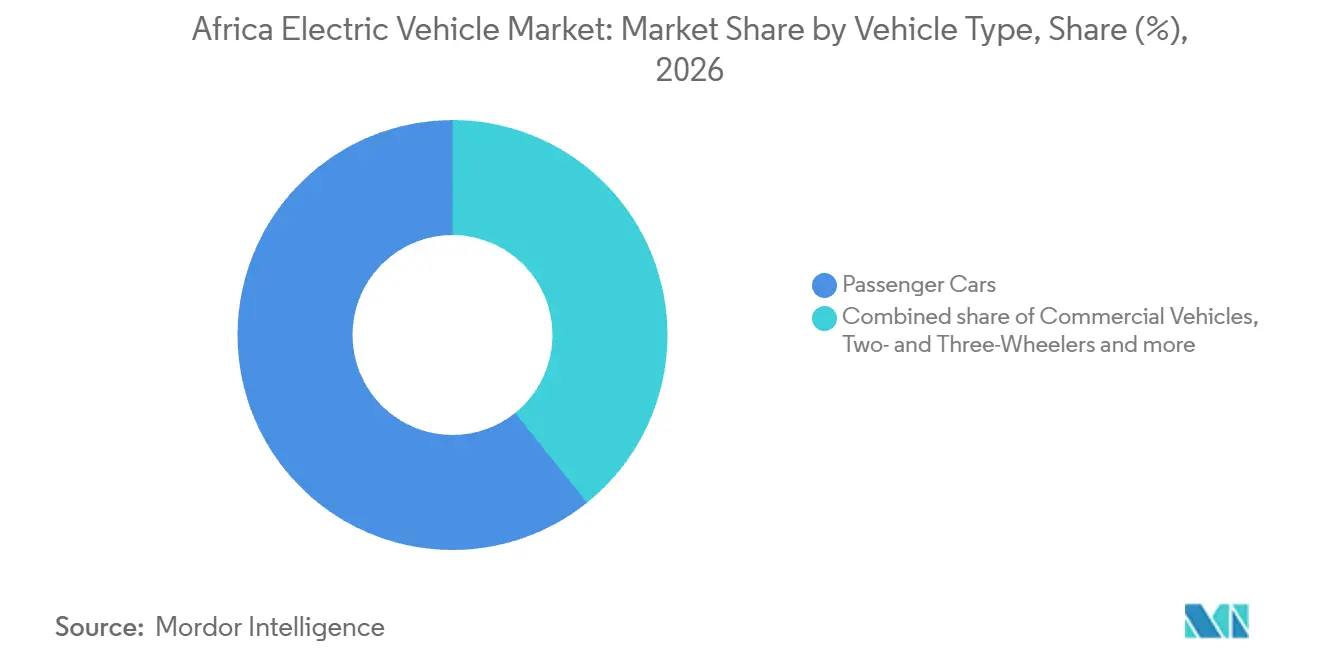
- Passenger cars led the vehicle-type breakdown with a 60.76% share of the Africa electric vehicle market size in 2026, and two- and three-wheelers are forecast to grow fastest at a 58.15% CAGR over 2027-2032.
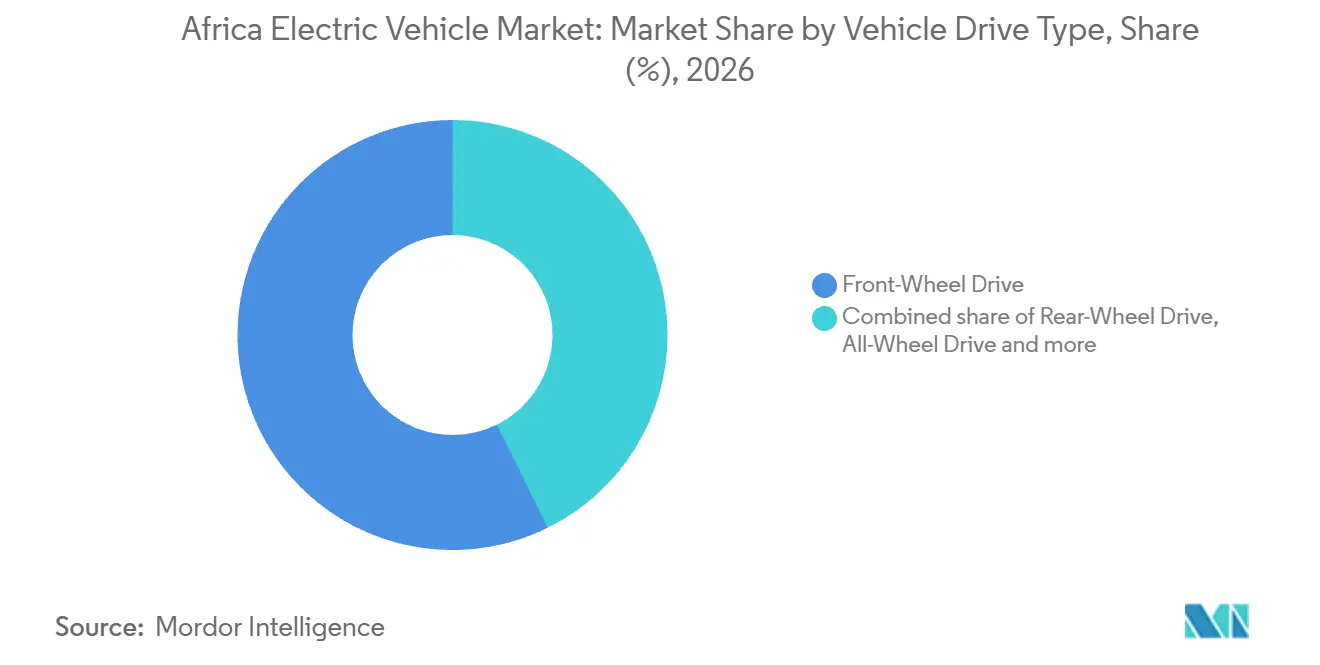
- Across vehicle drive types, front-wheel drive held the largest share at 57.32% in 2026, with all-wheel drive forecast to grow fastest at a 56.15% CAGR over 2027-2032.
- Within battery chemistry, nickel-manganese-cobalt led with 50.65% of vehicle-sales value in 2026, while solid-state batteries are forecast to grow fastest at a 56.05% CAGR over 2027-2032.
- By charging method, vehicles supporting AC slow charging below 22 kW led with 67.63% of vehicle-sales value in 2026, and those supporting DC fast charging above 50 kW are forecast to grow fastest at a 55.65% CAGR over 2027-2032.
- Geographically, Ghana held the largest share at 29.07% in 2026, while Ethiopia is forecast to grow fastest at a 57.15% CAGR over 2027-2032.
Note: Market numbers in this report are based on Mordor Intelligence's proprietary estimation framework, which combines nine months of actuals with Q4 projections for base year 2026.
Market Trends and Insights
Drivers Impact Analysis of Africa Electric Vehicle Market*
| Driver | (~) % Impact on CAGR Forecast | Geographic Relevance | Impact Timeline |
|---|---|---|---|
| Government Incentives and Zero-Duty Imports Surge EV Affordability. | +20% | Rwanda, East Africa | Short term (≤ 2 years) |
| Plummeting Battery-Pack Prices Unlock Mass-Market Models | +21% | South Africa, Morocco, Egypt and Kenya | Short term (≤ 2 years) |
| Pan-African Mineral Value-Chain Push Fuels Local EV/Battery Investment | +8% | Morocco, Democratic Republic of the Congo and Zambia | Long term (≥ 4 years) |
| Leap-Frogging To E-Motorcycles and Tuk-Tuks for Last-Mile Logistics | +14% | Ethiopia and Benin | Short term (≤ 2 years) |
| Battery-Swap and Pay-Per-Use Models Mitigate Upfront-Cost Barrier | +7% | Rwanda and Kenya | Medium term (2-4 years) |
| OEM Fin-Tech Micro-Leasing Widens Access for Informal-Sector Drivers | +6% | Kenya, East Africa | Medium term (2-4 years) |
| Source: Mordor Intelligence | |||
Government Incentives and Zero-Duty Imports Surge EV Affordability.
In July 2024, the U.S. Department of Commerce described Ethiopia's exemptions from VAT, surtax and excise taxes on EV imports, with 5% customs duty applying to partially assembled vehicles. Removing these tax layers creates room for lower vehicle prices when importers pass the savings through. Rwanda's July 1, 2025 changes retained a 25% import-duty exemption for hybrids while introducing 18% VAT, 5% withholding tax and age-based excise duty. Those hybrid taxes were lower than those on fuel-powered vehicles, qualifying the tightening with a retained affordability advantage. Importers can direct that advantage toward eligible hybrid offers and age profiles whose final prices reach additional buyers.
Plummeting Battery-Pack Prices Unlock Mass-Market Models
Lower battery-pack prices give vehicle manufacturers more room to address entry costs without relying solely on consumer subsidies. The IEA reported an 8% decline in global average battery-pack prices per kWh in 2025 compared with 2024, covering electric-vehicle and stationary-storage applications across chemistries.[1] For African vehicle suppliers, the commercial choice is how to allocate the component-cost reduction between lower transaction prices and a higher vehicle specification. Passing the saving into price widens the set of buyer budgets a model can reach, while spending it on specification mainly serves buyers who already qualify. A split between entry-price and better-equipped variants could let one component-cost improvement serve different customer budgets.
Pan-African Mineral Value-Chain Push Fuels Local EV/Battery Investment
Local mineral processing can support vehicle affordability only when it connects to usable battery components and downstream manufacturing. COBCO announced that its first NMC cathode-precursor production lines entered service at Jorf Lasfar, Morocco, in June 2025, serving electric-vehicle and stationary-storage markets. This creates a manufacturing foothold between mineral extraction and finished batteries, giving component suppliers a clearer industrial base around which to develop capabilities. For vehicle assemblers, the commercial opportunity lies in qualifying that intermediate output for a complete battery supply chain rather than treating mineral availability as sufficient. Material sales can capture value at the processing stage even before these investments translate into additional vehicle purchases.
Leap-Frogging To E-Motorcycles and Tuk-Tuks for Last-Mile Logistics
Last-mile electrification can aggregate vehicle demand around delivery operations with an identified fleet buyer and a defined service territory. In June 2026, Ethiopia's postal service EthioPost took delivery of 100 Dodai TS-1 electric motorbikes for its urban last-mile distribution network across Addis Ababa. In September 2026, Dodai also described Go SuperApp's electric fleet as serving hyperlocal logistics and quick-commerce operations across the capital. For vehicle suppliers, these different operating models create a reason to organize deployment and support around a fleet customer rather than each rider separately. Because Dodai supplied the postal fleet and supports the quick-commerce operation in Addis Ababa, one battery-swap and service network can support two different fleet customers.
Restraints Impact Analysis of Africa Electric Vehicle Market*
| Restraint | (~) % Impact on CAGR Forecast | Geographic Relevance | Impact Timeline |
|---|---|---|---|
| High Capex for Charging and Grid Upgrades | -9% | Kenya, East Africa | Medium term (2-4 years) |
| Weak Grid Reliability and Low Electrification Outside Metros | -8% | Ethiopia outside Addis Ababa | Long term (≥ 4 years) |
| Flood Of Cheap Used ICE Imports Undercuts New-EV Demand | -3% | Kenya, Nigeria, Ghana, Tanzania and Uganda | Medium term (2-4 years) |
| Nascent Second-Hand EV Market Hurts Residual-Value Confidence | -2% | Kenya, East Africa | Medium term (2-4 years) |
| Source: Mordor Intelligence | |||
High Capex for Charging and Grid Upgrades
Charging investment can limit vehicle adoption even when the vehicle itself becomes more affordable, because operators must fund the supporting infrastructure. A 2026 Kenya charging-infrastructure study identified high upfront capital expenditure as a barrier for private charge-point operators. It also warned that unclear sharing of grid-upgrade costs between utilities and private developers could create bottlenecks that curb new stations. These are distinct financing problems, with the first affecting a site's investment case and the second leaving responsibility for enabling works unresolved. For fleet buyers dependent on those sites, unresolved grid-upgrade liability can add an infrastructure cost to vehicle acquisition or delay the start of paid service.
Weak Grid Reliability and Low Electrification Outside Metros
An electric vehicle becomes harder to deploy commercially when dependable charging stops at the edge of its operating territory. May 2026 reporting described Ethiopian blackouts and high-capacity charging connection delays that slowed infrastructure construction, with unreliable power outside Addis Ababa restricting e-mobility to selected areas. For operators considering wider routes, that combination makes usable service coverage more consequential than a vehicle's nominal driving range. It also weakens the case for adding vehicles before their charging locations can support dependable operation. On April 4, 2026, Ethio Telecom inaugurated its first super-fast charging station outside Addis Ababa in Adama, able to charge up to 12 vehicles simultaneously. Expansion beyond supported corridors nevertheless carries exposure to charging delays and interrupted vehicle utilization.
*Our forecasts treat driver/restraint impacts as directional, not additive. The impact forecasts reflect baseline growth, mix effects, and variable interactions.
Africa Electric Vehicle Market Segment Analysis
By Propulsion Type:
BEV Leadership and Fuel-Cell Fueling Logistics Follow Different PathsBattery electric vehicles (BEVs) accounted for a 78.74% share of the Africa electric vehicle market size in 2026. In South Africa, BEV sales, including heavy commercial vehicles, fell to 1,088 in 2025 from 1,257 in 2024. The South African setback shows why a leading regional position should be distinguished from annual unit-sales momentum in an individual country.
Fuel-cell electric vehicles (FCEVs) are the fastest-growing propulsion segment, with a forecast 56.62% CAGR over 2027-2032. For a prospective depot-based bus fleet in South Africa, growth would involve adding hydrogen-powered vehicles around a shared fueling location. A fueling arrangement able to serve multiple buses could accommodate subsequent vehicle orders without a separate fuel-supply arrangement for every buyer. This concentrated purchasing model offers a route from a small application base to repeat orders, provided hydrogen availability expands with fleet size.


By Vehicle Type:
Passenger Models and Motorcycle Fleets Create Different Sales ChannelsPassenger cars represented a 60.76% Africa electric vehicle market share in 2026, making them the largest vehicle-type segment. South African buyers purchased 66 BYD Atto 3 electric vehicles from January through July 2026, according to naamsa data reported by Recharged. The model-level reading gives suppliers a concrete product and national customer group around which to assess a passenger-car offer. An entrant can sequence its range country by country, directing support toward models with demonstrated purchases before extending coverage to additional products.
Two- and three-wheelers are the fastest-growing vehicle-type segment, with a forecast 58.15% CAGR over 2027-2032. By September 2026, Spiro had deployed more than 28,000 electric motorcycles in Rwanda since starting operations there in April 2023. A cumulative deployed fleet creates a different commercial responsibility from the next batch of new vehicles, because existing motorcycles need support while additional deployments generate further vehicle transactions. After-sales capacity has to scale with the fleet already deployed, while new vehicle orders depend on additional operator deployments.

By Vehicle Drive Type:
Model Demand Anchors Drive Configuration ChoicesFront-wheel drive held 57.32% of vehicle-sales value in 2026, making it the largest drive-type segment. In its first month reporting sales to naamsa, BYD recorded 239 South African Dolphin Surf sales in March 2026, for a model using front-wheel drive. A complete vehicle with demonstrated sales gives this configuration a commercial route through the customer's model choice, connecting an engineering attribute with an actual vehicle transaction. Because the front-wheel-drive Dolphin Surf supplied 239 of that month's 389 national battery-electric sales, South Africa's BEV volume in March 2026 rested largely on a single model.
All-wheel drive (AWD) is the fastest-growing drive-type segment, with a forecast 56.15% CAGR over 2027-2032. In May 2026, iCAUR South Africa launched its fully electric 03T SUV in rear-wheel-drive and AWD derivatives, with showroom availability stated from May 28. Uptake of the AWD derivative would turn on buyers valuing its added traction enough to select it over the alternative configuration.
By Battery Chemistry:
Export Allocation and Commercialization Shape SupplyNickel-manganese-cobalt (NMC) was the largest battery-chemistry segment, accounting for 50.65% of regional vehicle-sales value in 2026. In June 2025, COBCO described annual target capacity of 120,000 metric tons for NMC precursors at its Moroccan complex, with materials intended for EV and stationary-energy markets mainly in Europe and North America. That export orientation makes the location of processing distinct from the destination of its output, so African vehicle makers cannot equate regional capacity with locally allocated supply. Vehicle manufacturers pursuing regional NMC supply need commercial arrangements connecting precursor output with the battery suppliers serving their own models.
Solid-state batteries are the fastest-growing chemistry segment, with a forecast 56.05% CAGR over 2027-2032. In October 2025, Toyota and Sumitomo Metal Mining entered a joint development agreement for mass-production cathode materials intended for all-solid-state BEV batteries. Commercial expansion depends on converting that materials-development pathway into supplies suitable for a vehicle program. Lithium-iron-phosphate (LFP) has a different application base, with a 2025 Kenya battery ecosystem assessment describing its popularity among Kenyan electric-motorcycle assemblers and its use in most Kenyan electric buses because of affordability and comparative safety. Manufacturers can separate near-term fleet chemistry choices from future solid-state platform development, giving these investments different commercialization horizons.
By Charging Method:
Vehicle Duty Determines Charging ValueVehicles supporting AC slow charging below 22 kW represented 67.63% of vehicle-sales value in 2026, making this the largest charging-method segment. A passenger-car owner with overnight parking offers a concrete setting for this capability. Charging during that parked interval shifts the purchase test toward the energy replenished before morning departure. The sale rests on whether overnight replenishment covers the owner's next day of driving, giving this method a specific use case without requiring a rapid-charging stop.
Vehicles supporting DC fast charging (above 50 kW) form the fastest-growing charging-method segment, with a forecast 55.65% CAGR over 2027-2032. On July 24, 2026, GridCars announced a phased South African network program with 120 kW dual-connector DC chargers planned for selected existing and additional sites. Equipment replacement and new-site additions address different commercial needs, linking faster charging capability with both established locations and wider route coverage as the program is implemented. For longer intercity journeys, the planned links between economic centers can extend the usefulness of fast-charging capability beyond an individual urban stop.
Geography Analysis
Ghana Electric Vehicle Market
Ghana accounted for 29.07% of the Africa electric vehicle market size in 2026, making it the largest national market. By October 2025, its Driver and Vehicle Licensing Authority had registered more than 1,200 electric vehicles, compared with fewer than 200 in 2022.[2] Charge Express operates a 24/7 DC fast-charging station with 4 outlets and charging power up to 160 kW at AnC Mall in East Legon, Accra. Ghana's more than 1,200 registrations and East Legon's charger rated up to 160 kW give Accra distributors a national installed base and a local charging point to cite to private buyers.
Ethiopia Electric Vehicle Market
Ethiopia is the fastest-growing national market, with a forecast 57.15% CAGR over 2027-2032. Addis Ababa launched 100 electric buses into public transport operation on April 1, 2025, establishing a municipal fleet-purchasing channel. A fast-charging station built by the Ethiopian Electric Utility with the Industrial Parks Development Corporation was inaugurated in Kilinto Special Economic Zone on June 17, 2026. Municipal procurement concentrates vehicle demand within an institutional buyer, while the industrial-zone facility adds a separate location for supporting vehicle use. The growth mechanism combines public-fleet orders with power-sector infrastructure, creating focused deployment opportunities around city transport and industrial locations.
South Africa's Golden Arrow Bus Service received the first 20 electric buses under a 120-bus deal in April 2025, while Morocco's 2025 buyers included business fleets, rentals, premium taxis and affluent Casablanca and Rabat residents. Nigeria's corporate channel included SAGLEV's February 2026 delivery of a locally assembled, Dongfeng-manufactured 18-passenger electric van to Stanbic IBTC Bank for Lagos staff transport. Egypt's Ministry of Transport received 20 electric buses in October 2026 for integration into Greater Cairo's Ring Road Bus Rapid Transit network, with bus manufacturer MCV collaborating on delivery. In Kenya, and in Rwanda within Rest of Africa, Ampersand opened its swap network in December 2025 to first partner Wylex Mobility, which supplies motorcycles while Ampersand provides batteries and station access. These channels require different entry routes for institutional fleets, private buyers and motorcycle manufacturers.
Regulatory Framework and Outlook
The comparison covers selected jurisdictions from the perspective of EV suppliers serving public-transport operators and arranging associated charging. Ghana's Act 1151, effective January 1, 2026, exempts imported electric vehicles for public transportation from VAT, with the Commissioner-General responsible for arranging import-VAT collection. Ethiopia's Electric Vehicle Charging System (EVCS) Directive No. 1034/2024 requires separate, site-specific licenses for public and captive charging services, with classes of up to 100 kW and above 100 kW.
Regulatory Table of Africa Electric Vehicle Market
| Decision factor | Ghana | Ethiopia |
|---|---|---|
| Primary authority | Ghana Revenue Authority | Petroleum and Energy Authority |
| Key instruments or direction | VAT Act, 2025 (Act 1151), effective January 2026; charging and battery-swap rules under parliamentary approval in October 2026 | Registered EVCS Directive No. 1034/2024; site- and activity-specific charging licenses |
| Commercial effect | VAT exemption for imported public-transport EVs; proposed battery-collection and recycling duties for charging operators | Per-site authorization; market-based public-charging prices; general grid-tariff category unless a new category is approved |
| Current policy attractiveness | High | Medium |
| Future direction of policy attractiveness | Hardening | No change |
| Source: Mordor Intelligence | ||
Ghana's High rating reflects the targeted public-transport import-VAT exemption, which supports the vehicle-acquisition side of the supplier's offer. Its Hardening direction follows the October 2026 parliamentary process for proposed charging and battery-swap rules that would add battery-collection and recycling duties for charging-sector operators. Ethiopia's Medium rating balances required per-site authorization against the ability to price public charging on a market basis. Its No change direction rests on the registered licensing framework and defined grid-tariff baseline, which give fleet-linked charging projects an established authorization and pricing structure.
Value Chain Stages
Value capture compares battery-material processing, integrated vehicle assembly and delivery, and after-sales support. Ampersand Energy operates in Rwanda and Kenya and assembles its electric motorcycles and batteries on-site, connecting several activities within one business. Such integration can concentrate responsibility for the vehicle and its supporting systems, reducing the number of separate supplier relationships an operator must coordinate.
Value Chain Analysis Table of Africa Electric Vehicle Market
| Primary activity | Key participants | Value capture | Bottleneck | Resilience response |
|---|---|---|---|---|
| Battery-material processing | Battery-material producers such as COBCO, supplying EV and stationary-storage applications | Precursor-material sales | Qualification of intermediate materials for downstream battery production | Coordinate material specifications with downstream qualification |
| Vehicle assembly and delivery | Integrated vehicle assemblers such as Ampersand Energy and Roam; local assemblers and delivery providers such as SAGLEV | Finished-vehicle sales | Fragmented standards and limited charging for Kenyan applications beyond electric two-wheelers | Align vehicle qualification and fleet delivery with usable charging provision |
| After-sales support | After-sales providers such as Roam | Maintenance and service fees | Skills gaps affecting Kenyan uptake beyond electric two-wheelers | Develop technician capabilities alongside the installed fleet |
| Source: Mordor Intelligence | ||||
Kenya's 2026 charging-infrastructure study identified fragmented standards and skills gaps among constraints on uptake beyond electric two-wheelers. That makes assembly depth an incomplete measure of local value capture, because sustained support requires capabilities extending beyond the initial handover. Future localization can therefore create service income alongside vehicle sales when suppliers connect production skills with the ability to keep vehicles usable.
Competitive Landscape
Market Concentration
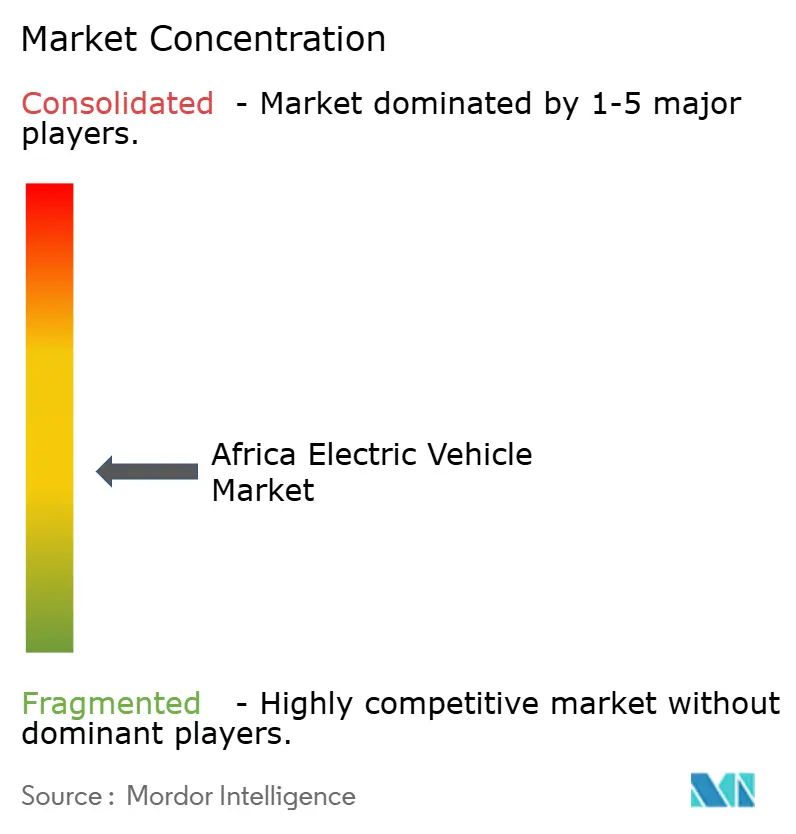
The mixed competitive field combines international vehicle groups such as Nissan Motor Co. Ltd., Volkswagen AG, Tesla Inc., BYD Co. Ltd. and Hyundai Motor Co. (incl. Kia) with specialist African fleet and energy-service businesses. Volkswagen Group delivered 983,120 all-electric vehicles worldwide in 2025, including heavy commercial vehicles and equity-accounted Chinese joint ventures. Eskom signed a memorandum of cooperation with BYD Auto South Africa on September 16, 2025, signaling intent for future collaboration and supporting the Dolphin Surf launch. The Eskom memorandum ties BYD's Dolphin Surf launch to a South African utility relationship, an intent that gives its local launch a partner beyond the vehicle itself.
Institutional procurement offers a different competitive route from passenger-model expansion, because a defined fleet requirement gives suppliers a specific customer and delivery obligation. In July 2025, Geyushi Automotive announced that it had won a tender to supply 100 electric buses to the Cairo Public Transport Authority in Egypt.[3] An award of this kind turns vehicle capability into an identified supply program, allowing the winner to organize execution around a stated fleet quantity and an institutional buyer. Winning and fulfilling a similar program requires a credible route from tender commitment to vehicle handover, placing contract execution at the center of a specialist's competitive proposition.
Financing for integrated vehicle and energy platforms can intensify competition through network reach and the capabilities needed to expand industrial supply. In June 2026, Spiro secured USD 215 million in equity financing to support African battery-swap network expansion and strengthen its industrial and assembly footprint. Rwanda Utilities Regulatory Authority rules effective June 29, 2026 require electric-motorcycle producers, importers and sellers to ensure compatibility with approved battery-swap systems. Existing covered entities, including battery-swap operators, have 2 years from that date to establish research and development capacity, operating procedures and interoperability compliance. The compliance transition makes compatibility engineering a competitive requirement alongside raising expansion capital.
Africa Electric Vehicle Industry Leaders
-
Nissan Motor Co. Ltd.
-
Volkswagen AG
-
Tesla Inc.
-
BYD Co. Ltd.
-
Hyundai Motor Co. (incl. Kia)
- *Disclaimer: Major Players sorted in no particular order
Africa Electric Vehicle Market Companies Covered in this Report
- Tesla Inc.
- BYD Co. Ltd.
- Nissan Motor Co. Ltd.
- Volkswagen AG
- Hyundai Motor Co. (incl. Kia)
- BMW AG
- Toyota Motor Corporation
- Mercedes-Benz Group AG
- Volvo Car AB
- Renault Group
- Rivian Automotive Inc.
- Ampersand Rwanda
- Roam (Kenya)
- Phoenix Mobility (Egypt)
- Kantanka Automobile (Ghana)
- Jet Motor Company (Nigeria)
- Oryx Motors (Morocco)
Key Opportunities for Market Participants
The opportunities compare production investment with financed van purchases for transport operators and institutions. From March 1, 2026, through March 1, 2036, South Africa's allowance provides a 150% first-year deduction on qualifying EV and hydrogen-vehicle production buildings, plant and machinery. On August 26, 2026, NCBA Group and BasiGo agreed to finance 1,000 electric vans for prospective Kenyan customers including transport operators, schools, hospitals and other businesses.
Market Opportunities Table of Africa Electric Vehicle Market
| Opportunity | Why now | Buyer / lead segment | Recommended play | Main barrier | Likely beneficiaries |
|---|---|---|---|---|---|
| Qualifying EV production investment in South Africa | Production-investment allowance effective from March 2026 | Producers investing in eligible EV production facilities | Phase industrial investment around identifiable vehicle demand | Capital commitment needed before sustained vehicle sales | Qualifying vehicle producers and production-equipment suppliers |
| Financed electric vans for Kenyan passenger-service operators | Agreed vehicle-specific financing channel | Established transport operators | Align financed van deployment with the operator's repayment capacity | Maintaining repayment capacity during fleet transition | BasiGo and NCBA as vehicle and financing partners, respectively |
| Electric vans for Kenyan institutional transport | Schools and hospitals included in the financing channel | Schools, hospitals and other institutional buyers | Structure financing packages around the institution's transport requirements | Committing operating funds to long-term vehicle repayment | Institutional vehicle buyers, BasiGo and NCBA |
| Source: Mordor Intelligence | |||||
The nearer-term opening is NCBA and BasiGo's Kenyan van-financing channel, which addresses the buyer's entry cost rather than requiring new production investment. Its prospective customers include passenger-service operators and institutions such as schools and hospitals, allowing one channel to serve different transport requirements. Conversion into vehicle purchases turns on repayment suitability for each buyer, while South Africa's production allowance strengthens supply economics when demand justifies the capital commitment.
Recent Industry Developments in Africa Electric Vehicle Market
- Oct 2026: GWM South Africa introduced the P300 2.0T Hi4-T plug-in hybrid pickup, the first electrified derivative in its P300 pickup range.
- Jun 2026: EthioPost took delivery of 100 Dodai TS-1 electric motorbikes for its urban last-mile distribution network across Addis Ababa, Ethiopia.
- Jun 2026: Spiro announced USD 215 million in equity financing to support expansion of its African battery-swapping network and strengthen its industrial and assembly footprint.
Africa Electric Vehicle Market Report Scope and Research Methodology
Market Definition and Coverage
The Africa electric vehicle market measures the annual sales value of road vehicles with electric powertrains in Africa. Vehicle sales across the region are valued as finished-vehicle transactions.
Scope exclusions: Charging-network services, electricity retailing, grid upgrades, separately sold batteries, propulsion components, parts, vehicle maintenance and repair, and internal-combustion-only road vehicles are excluded.
Segments Covered in This Report
- By Propulsion Type
- Battery Electric Vehicles (BEV)
- Plug-in Hybrid Electric Vehicles (PHEV)
- Hybrid Electric Vehicles (HEV)
- Fuel-Cell Electric Vehicles (FCEV)
- By Vehicle Type
- Passenger Cars
- Commercial Vehicles
- Two- and Three-Wheelers
- Buses and Coaches
- By Vehicle Drive Type
- Front-Wheel Drive
- Rear-Wheel Drive
- All-Wheel Drive
- By Battery Chemistry
- Lithium-Iron-Phosphate (LFP)
- Nickel-Manganese-Cobalt (NMC)
- Sodium-ion
- Solid-State
- Other Emerging Chemistries (Li-S, Li-Air)
- By Charging Method
- AC Slow (Below 22 kW)
- DC Fast (Above 50 kW)
- By Geography
- South Africa
- Morocco
- Nigeria
- Egypt
- Ethiopia
- Ghana
- Kenya
- Rest of Africa
Data Sources, Market Sizing, and Validation
Desk Research
Public sources such as the Africa E-Mobility Alliance's 2025 report and its H1 2026 Pulse provide regional vehicle, fleet, policy and implementation indicators, while World Bank electric-mobility analysis helps assess African sales trends and demand conditions. The United Nations Economic Commission for Africa's model road map supplies a policy framework, and country transport authorities, vehicle registries and customs agencies can clarify sales, registrations and import patterns.
Company annual reports, regulatory filings, investor materials, association releases and reputable business and trade press can supplement these sources with model launches, prices, fleet orders and assembly plans. Analysts can check reported sales against registrations and import patterns where available, and use multiple independent reports to clarify definitions and dates. These examples are not exhaustive, and further sources inform collection, validation and clarification.
Primary Interviews and Surveys
Interviews and structured surveys can include vehicle manufacturers and importers, dealers, fleet and public-transport operators, charging providers, financiers and relevant transport officials across Africa. Their input helps check secondary evidence on vehicle availability, transaction prices, fleet purchasing, propulsion and vehicle mix, and country-level policy effects. Where a series is incomplete, analysts compare responses with registrations, imports, company disclosures and other independent indicators, record unresolved differences, and seek clarification from relevant respondents before using an assumption in the estimate.
Distribution of primary research fieldwork respondents
| Company type | Respondent position | Region |
|---|---|---|
| Top tier: 30% | CXOs: 15% | |
| Mid tier: 45% | Functional/Unit leaders: 35% | |
| Smaller Players: 25% | Managers: 50% |
Market-Sizing & Forecasting
The estimate starts with a top-down view of annual finished-vehicle sales value across Africa, then uses selective country and channel checks to test the aggregate. Core indicators include new vehicle registrations and imports, observed transaction prices by vehicle and powertrain, fleet and public-transport orders, and changes in policy or charging access that affect purchasing. Together they inform the total and relative value shares by propulsion, vehicle type, drive type, battery chemistry, charging capability and country. Analysts can forecast the historical value series with multivariate regression where sales, price and adoption indicators are sufficiently consistent, and use scenario analysis for markets where policy, supply or charging changes make a single trend unreliable. Selective checks such as supplier roll-ups and sampled vehicle prices multiplied by observed sales volumes test the top-down result, while segment shares are built from registrations, import mix, model availability and fleet evidence and reconciled to the total. Gaps in country or channel records are estimated from comparable African markets and disclosed indicators, then checked against primary respondents and independent sources before inclusion. Experts can challenge the direction and local plausibility of variable-level forecasts without substituting opinion for measured evidence.
Data Validation & Update Cycle
Analysts triangulate vehicle-sales estimates against registrations, customs data, company disclosures, fleet orders and price evidence, then investigate material gaps between independent signals. Anomalies and variances are checked for changes in definitions, reporting periods, currency or country coverage, resolved against source records and reviewed at multiple analyst stages before sign-off. Respondents are re-contacted when a material conflict, unclear definition or changed assumption could alter the result. The dataset is refreshed annually, updated between cycles when a material policy, supply or market event changes the evidence, and given a fresh pre-delivery review for source dates, calculations and consistency.
Mordor Intelligence's Africa Electric Vehicle Market Size Versus Other Published Estimates
Published estimates can differ in the transactions and products they count and the inputs used to model demand. The Africa electric vehicle market measures the annual sales value of road vehicles with electric powertrains in Africa.
Key Gap Drivers include the study's defined coverage and market-specific modeling choices. Analysts can forecast the historical value series with multivariate regression where sales, price and adoption indicators are sufficiently consistent, and use scenario analysis for markets where policy, supply or charging changes make a single trend unreliable.
Benchmark comparison
| Source | Market Size | Gaps in Research Methodology |
|---|---|---|
| Mordor Intelligence | USD 1.06 B (2027) | |
| Global Consultancy A | USD 460 M (2025) | At its 2025 base, this estimate is 56.6% below this report's 2027 value of USD 1.06 B, 2 years later. Its listed coverage is passenger and commercial vehicles, leaving two- and three-wheelers outside the reported vehicle-type segments. |
| Specialist Research Publisher B | USD 108.5 M (2025) | At its 2025 base, this estimate is 89.8% below this report's 2027 value of USD 1.06 B, 2 years later. Its estimate covers electric motorcycles and mopeds only and excludes electric three-wheelers, so it captures a narrow part of the region's vehicle-sales pool. |
Mordor Intelligence's analysts triangulate vehicle-sales estimates against registrations, customs data, company disclosures, fleet orders and price evidence, then investigate material gaps between independent signals.
Key Questions Answered in the Report
What is the Africa electric vehicle market size and growth outlook?
The market is expected to reach USD 1.06 billion in 2027 and USD 9.22 billion by 2032, with a 54.12% CAGR over 2027-2032.
What is driving electric-vehicle adoption in Africa?
Lower global battery-pack prices, import-tax relief for eligible vehicles and fleet demand support adoption. EthioPost received 100 Dodai TS-1 electric motorbikes for urban last-mile deliveries in Addis Ababa, Ethiopia, in June 2026.
Which vehicle type leads electric-vehicle sales value in Africa?
Passenger cars held 60.76% of regional vehicle-sales value in 2026.
Which companies are major participants in Africa's electric-vehicle industry?
Major participants include Nissan Motor Co. Ltd., Volkswagen AG, Tesla Inc., BYD Co. Ltd. and Hyundai Motor Co. (incl. Kia).
What could slow electric-vehicle deployment in Africa?
Charging investment costs and unreliable power can limit deployment. Kenya's 2026 charging-infrastructure study identified high upfront capital expenditure for private charge-point operators.
Which country leads EV sales value in Africa, and which is forecast to grow fastest?
Ghana led with 29.07% of regional vehicle-sales value in 2026. Ethiopia is forecast to grow fastest at a 57.15% CAGR over 2027-2032.