Aerospace Testing Market Size and Share
Market Overview
| Study Period | 2020 - 2031 |
|---|---|
| Market Size (2026) | USD 5.91 Billion |
| Market Size (2031) | USD 7.64 Billion |
| Growth Rate (2026 - 2031) | 5.29% CAGR |
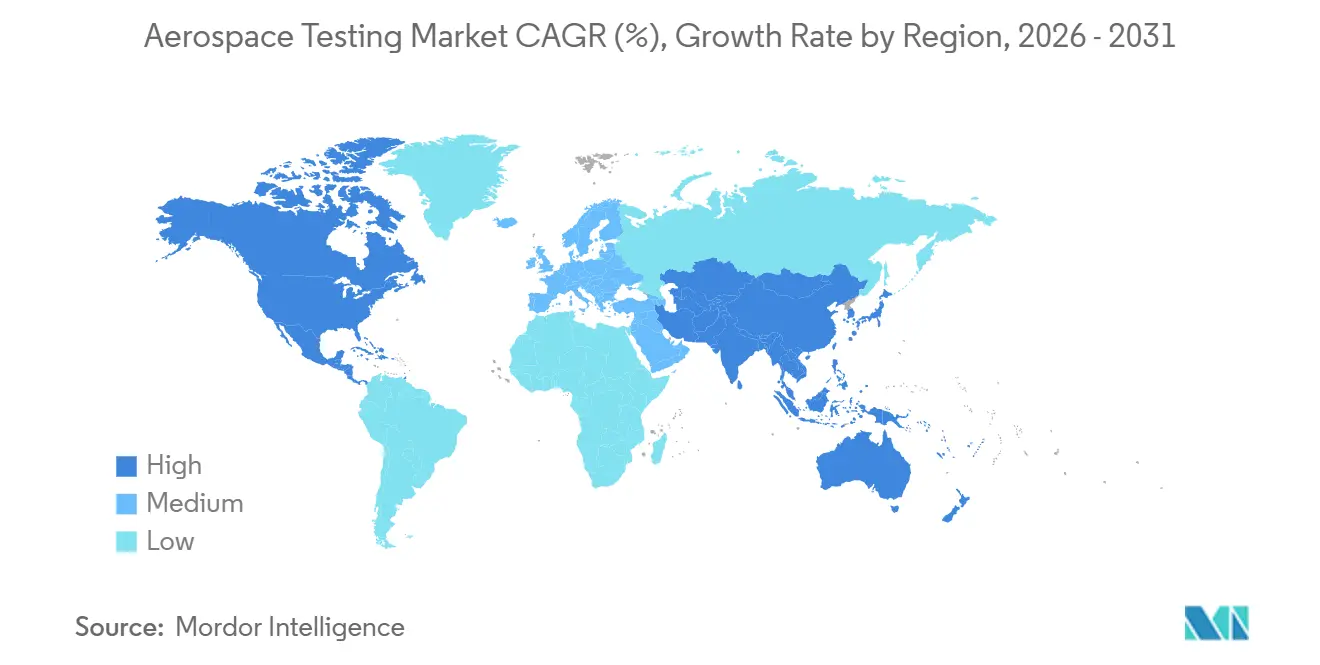
| Fastest Growing Market | Asia Pacific |
| Largest Market | North America |
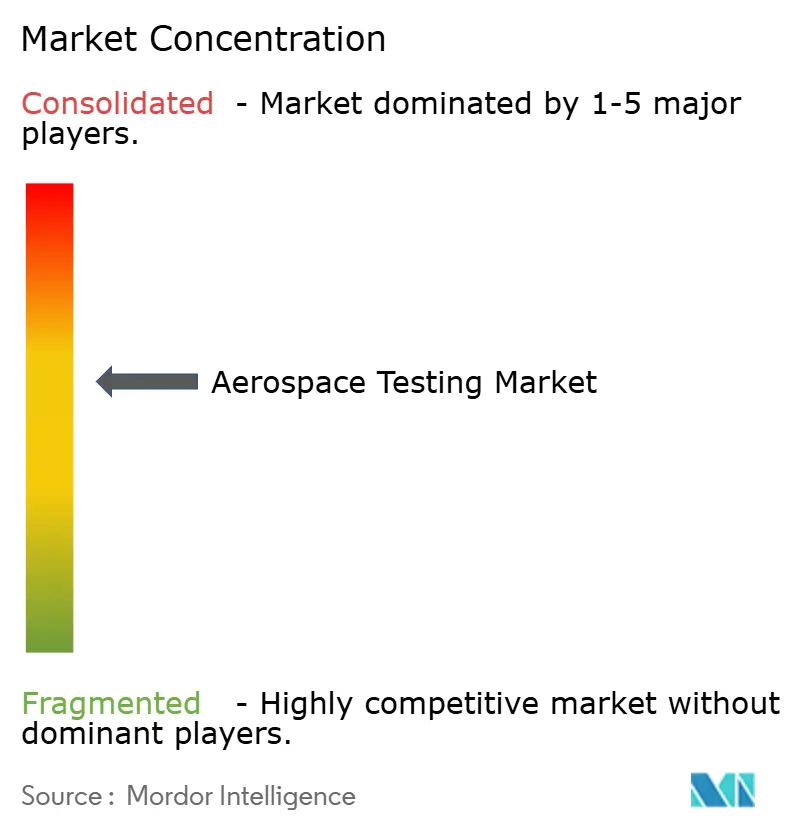
| Market Concentration | Medium |
Major Players *Disclaimer: Major Players sorted in no particular order Image © Mordor Intelligence. Reuse requires attribution under CC BY 4.0. | |
Aerospace Testing Market Analysis by Mordor Intelligence
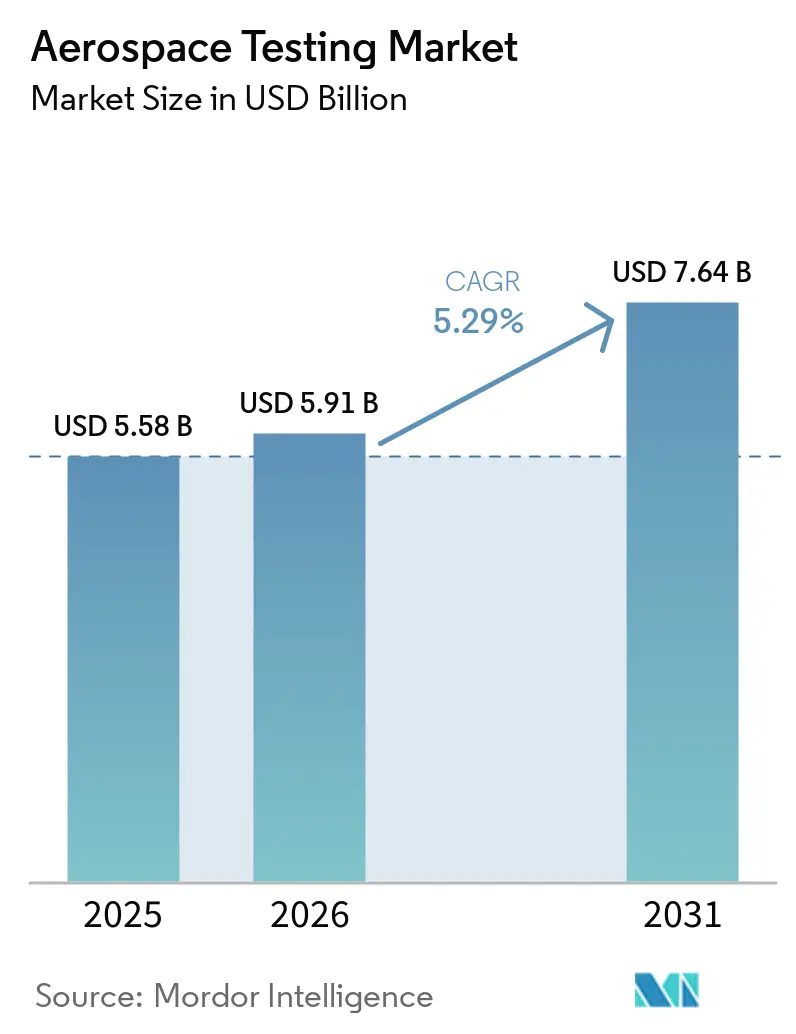
The aerospace testing market size is expected to grow from USD 5.58 billion in 2025 to USD 5.91 billion in 2026 and is forecast to reach USD 7.64 billion by 2031 at a 5.29% CAGR over 2026-2031. Robust demand stems from stricter emissions mandates, the rapid rollout of satellite megaconstellations, and broader adoption of digital-twin validation, all of which are steering spending toward laboratories that can blend physical and virtual workflows. North America retained leadership in 2025, yet Asia-Pacific is the fastest-expanding region thanks to indigenous aircraft programs and swelling MRO capacity. As regulatory scrutiny intensifies, programs that address hydrogen safety, hypersonic environments, and AI-driven conformity analytics are gaining budget priority. Labs that offer hybrid services, Nadcap accreditation, and advanced data analytics pipelines are well-positioned to capture the next wave of growth in the aerospace testing market.
Key Report Takeaways
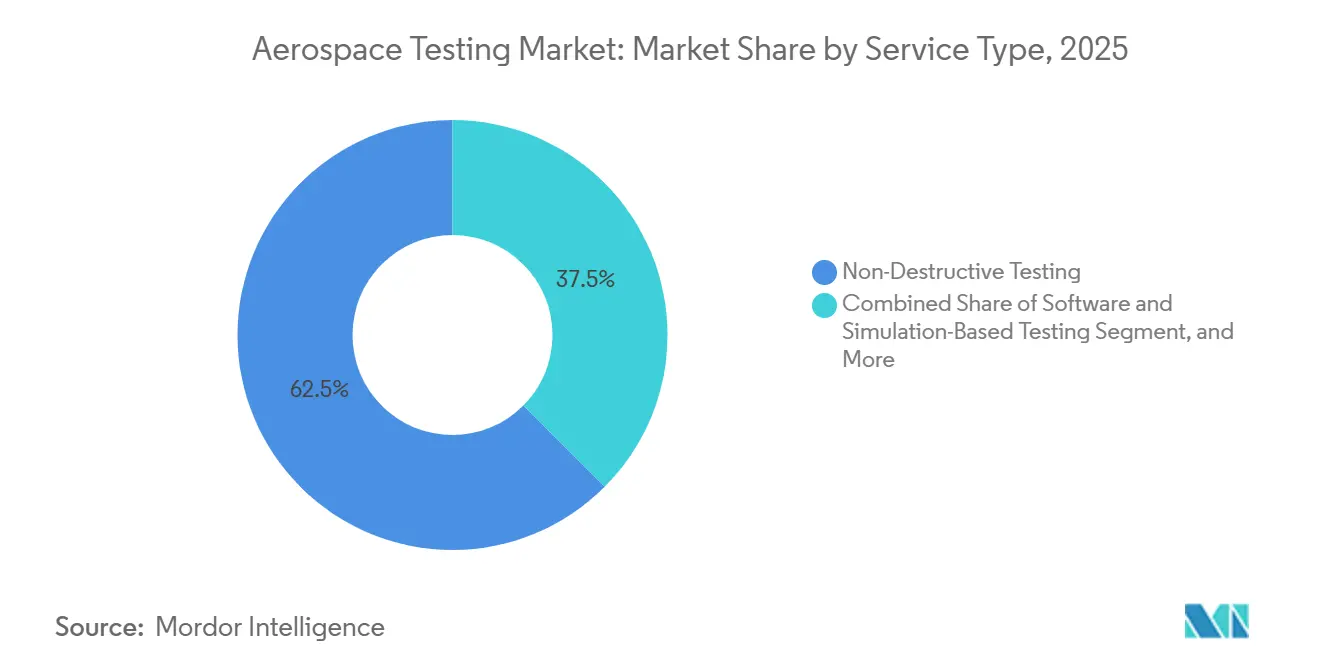
- By service type, non-destructive testing accounted for 62.52% of revenue in the aerospace testing market in 2025, while software and simulation-based testing are projected to expand at a 5.93% CAGR through 2031.
- By component tested, airframe testing accounted for 37.19% of the aerospace testing market share in 2025; propulsion systems testing is expected to grow at a 5.78% CAGR between 2026 and 2031.
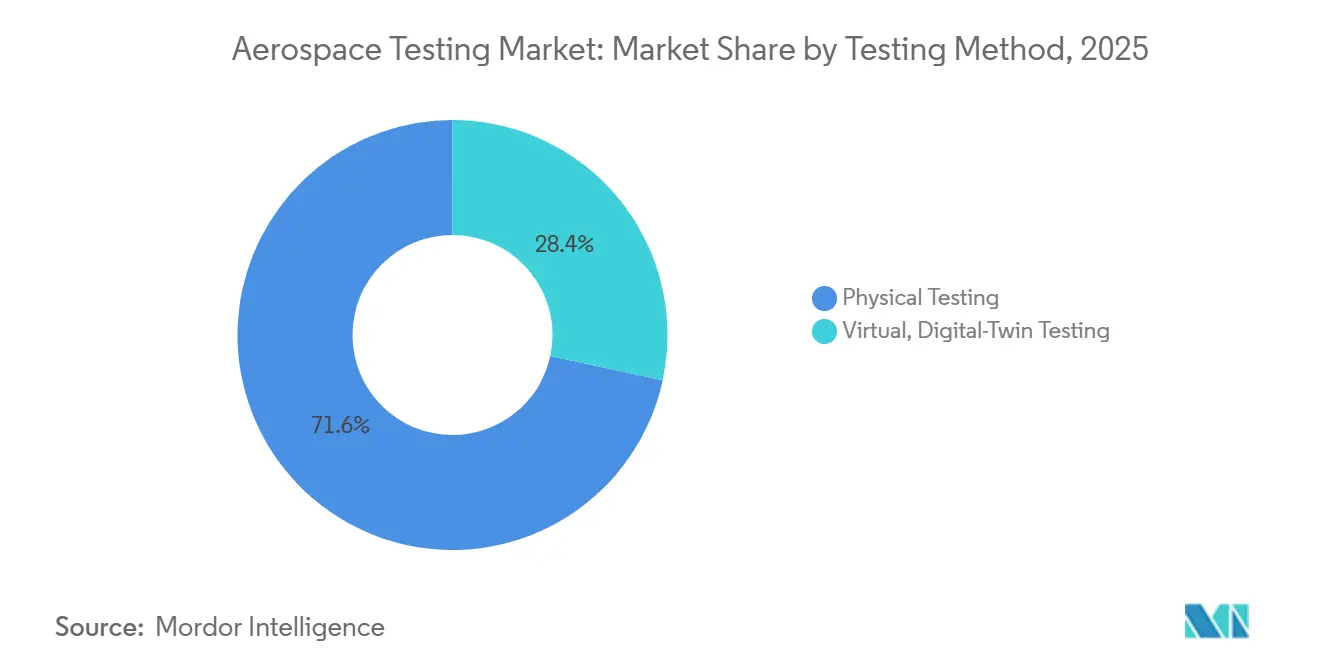
- By testing method, physical testing accounted for 71.62% of revenue in 2025, whereas virtual digital-twin testing is forecast to grow at a 5.71% CAGR, highlighting the migration toward simulation-first validation.
- By end user, OEMs accounted for 58.83% of the 2025 market demand, while government and space agency customers exhibited the fastest outlook, with a 5.88% CAGR through 2031.
- By geography, North America led the aerospace testing market with a 46.47% share n 2025, while Asia-Pacific is on track for a 5.84% CAGR during the forecast period.
Note: Market size and forecast figures in this report are generated using Mordor Intelligence’s proprietary estimation framework, updated with the latest available data and insights as of January 2026.
Global Aerospace Testing Market Trends and Insights
Driver Impact Analysis*
| Driver | % Impact on CAGR Forecast | Geographic Relevance | Impact Timeline |
|---|---|---|---|
| Accelerating Composites Adoption Elevates NDT Demand | +1.2% | North America, Europe | Medium term (2-4 years) |
| Rapid Ramp-Up of Satellite Megaconstellations | +1.0% | North America, Asia-Pacific | Short term (≤ 2 years) |
| Stricter ICAO and FAA Sustainability and NOx Rules | +0.9% | Global | Medium term (2-4 years) |
| Digital Twin Validation Cuts Physical Test Cycles | +0.8% | North America, Europe, Asia-Pacific | Long term (≥ 4 years) |
| Hypersonic Flight Programs Across Major Powers | +0.6% | North America, Asia-Pacific | Long term (≥ 4 years) |
| AI-Driven Conformity Analytics Reduces Retest Rates | +0.5% | North America, Europe | Medium term (2-4 years) |
| Source: Mordor Intelligence | |||
Accelerating Composites Adoption Elevates NDT Demand
Composite structures now exceed 50% of the empty weight on platforms such as the 787 and A350, and higher laminate content introduces failure modes that visual inspection cannot catch.[1]Boeing, “787 Composite Airframe Data,” boeing.comAutomated phased-array ultrasonics screen sandwich panels up to 27 times faster than single-element probes, while adaptive plane-wave imaging cuts amplitude variation from 23.18 dB to 1.86 dB, improving defect detection in curved spars.[2]IEEE, “Adaptive Plane-Wave Imaging for Composite Inspection,” ieeexplore.ieee.org Nadcap accreditation for composite NDT has therefore become mandatory for Tier-1 suppliers, but the pipeline for Level 3 inspectors remains tight, extending lead times and keeping prices firm. Rising composite penetration is expected to uphold premium rates for accredited labs even as OEMs automate lay-up and cure monitoring. These dynamics jointly sustain the aerospace testing market’s appetite for advanced NDT capacity through the medium term.
Rapid Ramp-Up of Satellite Megaconstellations
Starlink operated more than 7,000 satellites by 2025 and targets 12,000 before 2030, while Project Kuiper and OneWeb together plan another 4,000-plus spacecraft. Every satellite requires thermal-vacuum testing from -150 °C to +150 °C and EMI screening to comply with ITU and FCC Part 25 spectrum rules. Chamber queues are lengthening; consequently, prime contractors are building captive test bays, and independents such as Element have added a Texas composites center designed to handle 15,000 samples a year to relieve bottlenecks. Virtual twins are also gaining traction, allowing engineers to iterate on antenna patterns or thermal paths without tying up scarce hardware. This constellation boom is set to anchor double-digit growth for space-related environmental and vibration services.
Stricter ICAO and FAA Sustainability, NOx Rules
ICAO CAEP/13 tightened NOx and introduced particulate limits for engines entering service after 2028, and the FAA harmonized Part 34 accordingly. Engine makers now run extended combustor trials to validate low-NOx injectors and sustainable aviation fuel blends that respect aromatic and sulfur ceilings. Rolls-Royce’s UltraFan 30 ground test campaign, co-funded by the EU’s Clean Aviation, exemplifies the intensity of emissions-compliance testing.[3]Rolls-Royce, “UltraFan 30 Demonstrator Program,” rolls-royce.comDemand is rising for labs offering gas chromatography, particulate counters, and laser diagnostics that can verify compliance in real time. Stricter rules, therefore, act as a secular tailwind for the aerospace testing market.
Digital-Twin Validation Cuts Physical Test Cycles
Airbus trimmed A350 wing test iterations by 30% using twin-driven models, and Lockheed Martin’s Orion Integrated Test Lab exposed hardware-software issues on the ground instead of in flight. Ansys Cloud Burst evaluates 1,000 CFD variants in 10 minutes, saving weeks of tunnel time.[4]Ansys, “Cloud Burst Compute Release 2025 R1,” ansys.comThe result is not fewer physical tests but a more strategic application of them, as labs are tasked with correlating high-fidelity data that meets regulatory standards. This shift emphasizes the importance of combining simulation technologies with accredited bench work to enhance efficiency and reliability. Providers adopting this hybrid approach are gaining a competitive edge, driving innovation in the aerospace testing market. As a result, the market is moving toward a future where physical and virtual testing coexist to meet evolving industry demands.
Restraint Impact Analysis*
| Restraint | % Impact on CAGR Forecast | Geographic Relevance | Impact Timeline |
|---|---|---|---|
| High Capex for Environmental and Anechoic Chambers | -0.6% | Global | Short term (≤ 2 years) |
| Shortage of AS9100-Certified Testing Talent | -0.5% | North America, Europe, Asia-Pacific | Medium term (2-4 years) |
| Data-Ownership Conflicts in OEM-Lab Partnerships | -0.3% | North America, Europe | Medium term (2-4 years) |
| Cryogenic Hydrogen Safety Protocol Complexity | -0.2% | Global | Long term (≥ 4 years) |
| Source: Mordor Intelligence | |||
High Capex for Environmental and Anechoic Chambers
A 3-meter EMC chamber costs USD 150,000-400,000, while full-scale temperature-humidity-vibration rigs exceed USD 1 million, deterring new entrants and slowing capacity expansion. TÜV SÜD’s EUR 15 million (USD 17.5 million) Volpiano complex underscores the investment needed for Nadcap-ready sites. Lead times of 12-18 months to source chambers can create short-term supply squeezes, leading to higher pricing. Emerging-market labs struggle most due to limited access to low-cost capital and concentrated customer bases. High capex thus tempers growth even as demand climbs.
Shortage of AS9100-Certified Testing Talent
Auditor accreditation stretches beyond 24 months, and Level 3 NDT technicians require years of supervised practice across ultrasonic, radiographic, and thermographic methods. North America and Europe feel the pinch most acutely, but Asia-Pacific’s indigenous aircraft surge is spreading the gap. Vacancy durations exceed six months, and technician pay has risen 15-20% since 2024. Labs are adopting robotized phased-array scanners and AI defect classifiers to ease reliance on scarce experts, yet throughput remains talent-constrained in the near term.
*Our forecasts treat driver/restraint impacts as directional, not additive. The impact forecasts reflect baseline growth, mix effects, and variable interactions.
Segment Analysis
By Service Type: Simulation Services Gain Momentum
The aerospace testing market service type, non-destructive testing (NDT), accounted for 62.52%. However, software and simulation services are advancing 5.93% annually, reflecting OEM strategies to validate designs virtually before committing to prototypes. Physical NDT remains fundamental because Nadcap and regulators still demand proof loads, fracture mechanics coupons, and real-environment exposure. Yet digital twins now incorporate many early iterations, allowing labs to monetize high-value correlation projects rather than commodity coupon runs. Hybrid providers that host both GPU clusters and vibration shakers are capturing sticky, multi-year contracts.
Growth in simulation is also widening access for smaller suppliers by reducing barriers to entry. Cloud-native platforms enable Tier-2 metal formers to avoid capital-intensive solvers while providing primes with standardized data formats. Over 40% of major OEMs now use lifecycle twins to forecast maintenance requirements, driving increased demand for prognostics and health management test services. Consequently, the service-type mix is shifting structurally toward virtual validation, even as destructive testing remains essential for certification purposes. This hybrid approach is shaping the future of aerospace testing services.


By Component Tested: Propulsion Leads the Upswing
In 2025, airframe structures accounted for 37.19% of total revenue. However, as advancements in hydrogen, hybrid-electric, and hypersonic engines take center stage, propulsion testing is poised to lead with the fastest growth rate, projected at 5.78% CAGR. Propulsion programs, demanding precision, utilize cryogenic handling at a frigid -253 °C, high-altitude combustor rigs, and wind tunnels exceeding Mach 5, all commanding premium prices. These advanced testing requirements are critical for ensuring the reliability and performance of next-generation propulsion systems. Concurrently, materials labs are focused on ceramic matrix composites and additive titanium coupons, working to qualify higher-temperature cores and maintain a steady baseline. These efforts are essential to meet the increasing demand for materials capable of withstanding extreme conditions in modern aerospace applications.
Avionics testing is on the rise, driven by fly-by-wire retrofits and stringent cybersecurity mandates. The growing adoption of fly-by-wire systems enhances aircraft performance and safety, while cybersecurity measures address the increasing risks associated with digital avionics systems. At the same time, qualifying composite materials remains crucial; every new resin or fiber variant necessitates thorough evidence of thermal, flammability, and fatigue properties. This rigorous qualification process ensures compliance with safety standards and supports the development of lighter, more efficient aircraft. Collectively, the intricate nature of propulsion and its heightened regulatory scrutiny are steering capital investments towards engine test cells, propelling the aerospace testing market into its next growth phase. These investments are expected to drive innovation and support the evolving needs of the aerospace industry.
By Testing Method: Physical Validation Persists Despite Digital Gains
Physical campaigns accounted for 71.62% of the total spend in 2025, highlighting the regulatory emphasis on destructive proof points to ensure compliance and safety. These campaigns involve rigorous physical testing to validate designs, materials, and systems under real-world conditions. Despite this dominance, virtual digital-twin workflows are gaining traction, growing at a compound annual growth rate (CAGR) of 5.71%. Companies like Ansys and Siemens are driving this growth by offering GPU-accelerated multiphysics simulations that can evaluate 1,000 design variants in minutes, significantly reducing development time. Boeing exemplifies the integration of these technologies with its in-house network of over 200 testing chambers. This approach combines advanced simulation tools with targeted physical bench tests, enabling manufacturers to accelerate program timelines while maintaining strict compliance with regulatory standards.
Regulatory bodies such as the European Union Aviation Safety Agency (EASA) and the Federal Aviation Administration (FAA) are gradually adopting policies that grant simulation credit. This credit is awarded when virtual predictions closely align with physical testing baselines, encouraging laboratories to invest in advanced technologies. High-fidelity sensors and robust data pipelines are becoming essential for tightening correlation loops between virtual and physical testing. As a result, the long-term market outlook favors service providers that can seamlessly integrate digital and physical testing methodologies within a single project framework. This capability allows for greater flexibility, efficiency, and accuracy in meeting the evolving demands of the aerospace testing market.
By End-User: Agencies Accelerate Demand
OEMs accounted for 58.83% of 2025 revenue, highlighting their dominant role in the aerospace testing market. However, government and space-agency demand is projected to grow at the fastest rate of 5.88% CAGR, driven by initiatives such as NASA’s Artemis program, ESA’s Clean Aviation efforts, and India’s AMCA fighter development timelines. These programs are fueling investments in advanced testing infrastructure to meet stringent performance and safety requirements. Meanwhile, MRO organizations continue to generate steady recurring revenue as aging fleets require ongoing maintenance and testing, though their growth trajectory remains comparatively moderate.
Independent labs and certification bodies are playing a critical role in bridging capacity gaps for Tier-3 suppliers, particularly in regions like the Asia-Pacific. This is especially significant as new airframe programs in these regions demand rapid local testing and certification turnaround. Additionally, as space agencies expand their focus on moon missions and hypersonic weapons testing, the demand for specialized testing equipment, such as altitude chambers and aero-thermal benches, is expected to increase. This diversification of the customer mix is poised to further drive growth across the aerospace testing market, ensuring a robust, evolving landscape.
Geography Analysis
North America contributed 46.47% of 2025 revenue, driven by a robust network of OEM headquarters, NASA facilities, and over 200 Nadcap-accredited labs. Investments like Lockheed Martin’s USD 17.1 million Hypersonic System Integration Lab in Alabama aim to mitigate risks in classified schedules while opening up commercial slots for third-party testing. Despite its maturity, the region faces increasing demand as megaconstellation payloads and hydrogen engines compete for limited vacuum and cryogenic testing bays. This competition has led to longer chamber queues, highlighting the need for expanded capacity to meet growing requirements. North America remains a critical hub for advanced testing infrastructure and innovation.
Asia-Pacific is the fastest-growing region, with a projected CAGR of 5.84% through 2031, supported by initiatives such as China’s C919 certification flights and India’s development of five AMCA prototypes by 2031. Governments in the region are actively co-funding test hubs, including Singapore’s engine MRO expansions and South Korea’s Sacheon complex, to enhance supply chain efficiency and develop local expertise. Tier-2 suppliers are moving up the value chain, as seen with Bharat Forge’s ring-rolling plant, which will supply components for Rolls-Royce's Pearl 10X programs. These developments are solidifying the region’s position as a key player in the global testing market. Asia-Pacific’s growth is further fueled by its focus on reducing dependency on external markets.
Europe continues to hold significant influence through its established Airbus, Rolls-Royce, and Safran ecosystems, operating under EASA’s regulatory framework. The EUR 64 million (USD 74.51 million) UltraFan 30 grant demonstrates strong institutional support for green propulsion testbeds, while TÜV SÜD’s EUR 15 million (USD 17.46 million) Volpiano lab reflects independent players aligning with OEM investments. Emerging clusters in South America, the Middle East, and Africa are also gaining traction, focusing on free-zone MRO parks and localized NDT services. These regions benefit from lower regulatory barriers and cost advantages, attracting price-sensitive projects and fostering growth in their testing capabilities. Europe’s leadership in green technology and innovation remains a key differentiator in the global market.

Competitive Landscape
The top quartet SGS, Bureau Veritas, Intertek, and Element collectively hold about 55% of global revenue, positioning the aerospace testing market as moderately concentrated. Element leads with the most extensive Nadcap footprint, operating 29 labs with 41 accreditations, and its 2024 acquisition of ISS Inspection Services expanded its US NDT coverage. OEM-owned facilities, such as Boeing Test & Evaluation and Airbus’s Structural Test Center, prioritize critical path tasks to protect intellectual property. These OEMs often delegate non-core or overflow testing work to independent labs, ensuring efficiency and focus on proprietary projects. This dynamic underscores the balance between OEMs and independent players in the aerospace testing ecosystem.
Strategic initiatives in the market are addressing capability gaps to meet evolving demands. Bureau Veritas is collaborating with Airbus to develop hydrogen-testing protocols, while SGS has introduced AI-based defect analytics that accelerate airframe inspections by 40%. Intertek has expanded its capabilities with a 25,000 ft² fatigue-and-vibration testing facility in Germany. Mid-tier labs are carving out niches in areas like cybersecurity penetration testing for avionics, AI conformity scoring, and cryogenic hydrogen safety. These efforts help them avoid direct price competition with global leaders while addressing emerging industry needs. However, talent shortages continue to challenge the sector, driving investments in automation, such as robotized PAUT scanners and digital workflows, to reduce dependence on scarce Level 3 inspectors.
Incumbents are increasingly partnering with simulation technology providers to enhance their service offerings. For example, Ansys Twin Builder’s predictive-maintenance modules and Siemens Simcenter’s cloud-based multiphysics engines are being integrated with physical coupon testing programs. These collaborations aim to deliver comprehensive test-and-twin solutions that combine physical testing with advanced simulation capabilities. This trend is raising entry barriers for smaller, single-modality labs, making it harder for them to compete effectively. Additionally, the industry is moving toward integrated, data-rich ecosystems that align with the growing expectations of regulators and stakeholders, further solidifying the position of major players.
Aerospace Testing Industry Leaders
SGS SA
Element Materials Technology
Intertek Group plc
Bureau Veritas SA
Applus+ Laboratories
- *Disclaimer: Major Players sorted in no particular order

Recent Industry Developments
- March 2026: Lockheed Martin opened a Rapid Fielding Center in Dallas to compress concept-to-low-rate-production cycles for US defense programs.
- March 2026: Rolls-Royce secured EUR 64 million (USD 74.51 million) from the EU Clean Aviation Joint Undertaking to lead the UltraFan 30 demonstrator, with ground tests slated for 2028.
- March 2026: RTX demonstrated a 1 MW hybrid-electric propulsion system achieving 30% fuel-efficiency gains for narrowbodies.
- January 2026: NASA and GE Aerospace completed hybrid-electric engine tests on a modified Passport core targeting a 10% fuel-burn cut.


Global Aerospace Testing Market Report Scope
The Aerospace Testing Market encompasses services, equipment, and solutions used to evaluate the performance, safety, reliability, and compliance of aircraft, spacecraft, and their components. It includes testing across structural, environmental, mechanical, electrical, and materials domains to ensure compliance with stringent aviation and space regulatory standards. These tests are conducted during design, development, manufacturing, and maintenance phases of aerospace systems.
The Aerospace Testing Market Report is Segmented by Service Type (Non-Destructive Testing, Environmental and Climatic Testing, Structural and Load Testing, Vibration and Acoustic Testing, EMI/EMC Testing, and Software and Simulation-Based Testing), Component (Airframe, Avionics and Electrical Systems, Propulsion Systems, and Materials and Composites), Testing Method (Physical Testing, and Virtual, Digital-Twin Testing), End-User (OEMs, MROs, and Independent Test Labs and Certification Bodies), and Geography (North America, South America, Europe, Asia-Pacific, Middle East, and Africa). The Market Forecasts are Provided in Terms of Value (USD).
| Non-Destructive Testing |
| Environmental and Climatic Testing |
| Structural and Load Testing |
| Vibration and Acoustic Testing |
| EMI / EMC Testing |
| Software and Simulation-Based Testing |
| Airframe |
| Avionics and Electrical Systems |
| Propulsion Systems |
| Materials and Composites |
| Physical Testing |
| Virtual, Digital-Twin Testing |
| OEMs |
| MROs |
| Independent Test Labs and Certification Bodies |
| North America | United States |
| Canada | |
| Mexico | |
| South America | Brazil |
| Argentina | |
| Rest of South America | |
| Europe | Germany |
| France | |
| United Kingdom | |
| Rest of Europe | |
| Asia-Pacific | China |
| Japan | |
| India | |
| Rest of Asia-Pacific | |
| Middle East | Saudi Arabia |
| United Arab Emirates | |
| Turkey | |
| Rest of Middle East | |
| Africa | South Africa |
| Egypt | |
| Rest of Africa |
| By Service Type | Non-Destructive Testing | |
| Environmental and Climatic Testing | ||
| Structural and Load Testing | ||
| Vibration and Acoustic Testing | ||
| EMI / EMC Testing | ||
| Software and Simulation-Based Testing | ||
| By Component Tested | Airframe | |
| Avionics and Electrical Systems | ||
| Propulsion Systems | ||
| Materials and Composites | ||
| By Testing Method | Physical Testing | |
| Virtual, Digital-Twin Testing | ||
| By End-User | OEMs | |
| MROs | ||
| Independent Test Labs and Certification Bodies | ||
| By Geography | North America | United States |
| Canada | ||
| Mexico | ||
| South America | Brazil | |
| Argentina | ||
| Rest of South America | ||
| Europe | Germany | |
| France | ||
| United Kingdom | ||
| Rest of Europe | ||
| Asia-Pacific | China | |
| Japan | ||
| India | ||
| Rest of Asia-Pacific | ||
| Middle East | Saudi Arabia | |
| United Arab Emirates | ||
| Turkey | ||
| Rest of Middle East | ||
| Africa | South Africa | |
| Egypt | ||
| Rest of Africa | ||


Key Questions Answered in the Report
What is the current value of the aerospace testing market?
The aerospace testing market size reached USD 5.91 billion in 2026 and is projected at USD 7.64 billion by 2031, according to Mordor Intelligence.
Which region is expected to grow the fastest through 2031?
Asia-Pacific is forecast to post the highest 5.84% CAGR, driven by programs such as China’s C919 and India’s AMCA.
Which component category is expanding most rapidly?
Propulsion systems testing is advancing at a 5.78% CAGR thanks to hydrogen, hybrid-electric, and hypersonic engine initiatives.
How are digital twins changing aerospace testing?
Virtual twins now absorb up to 60-70% of pre-certification iterations, reducing prototype counts and shifting spending toward high-fidelity correlation work.
Who are the leading independent testing providers?
SGS, Bureau Veritas, Intertek, and Element together control about 55% of global revenue, with Element holding the widest Nadcap footprint.
What is the major barrier for new entrants?
High capital expenditure up to USD 1 million for full-scale environmental chambers, and a shortage of AS9100-certified talent constrain entry and expansion.
Page last updated on:


