Automotive Test Equipment Market Size and Share
Market Overview
| Study Period | 2020 - 2031 |
|---|---|
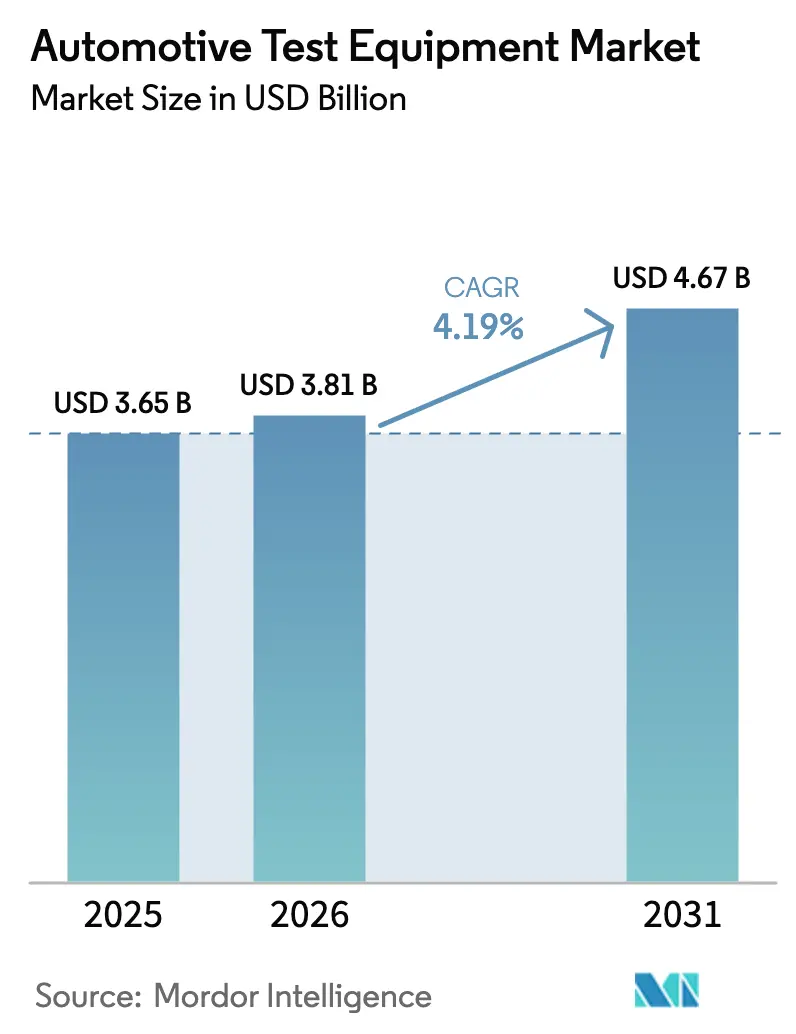
| Market Size (2026) | USD 3.81 Billion |
| Market Size (2031) | USD 4.67 Billion |
| Growth Rate (2026 - 2031) | 4.19% CAGR |
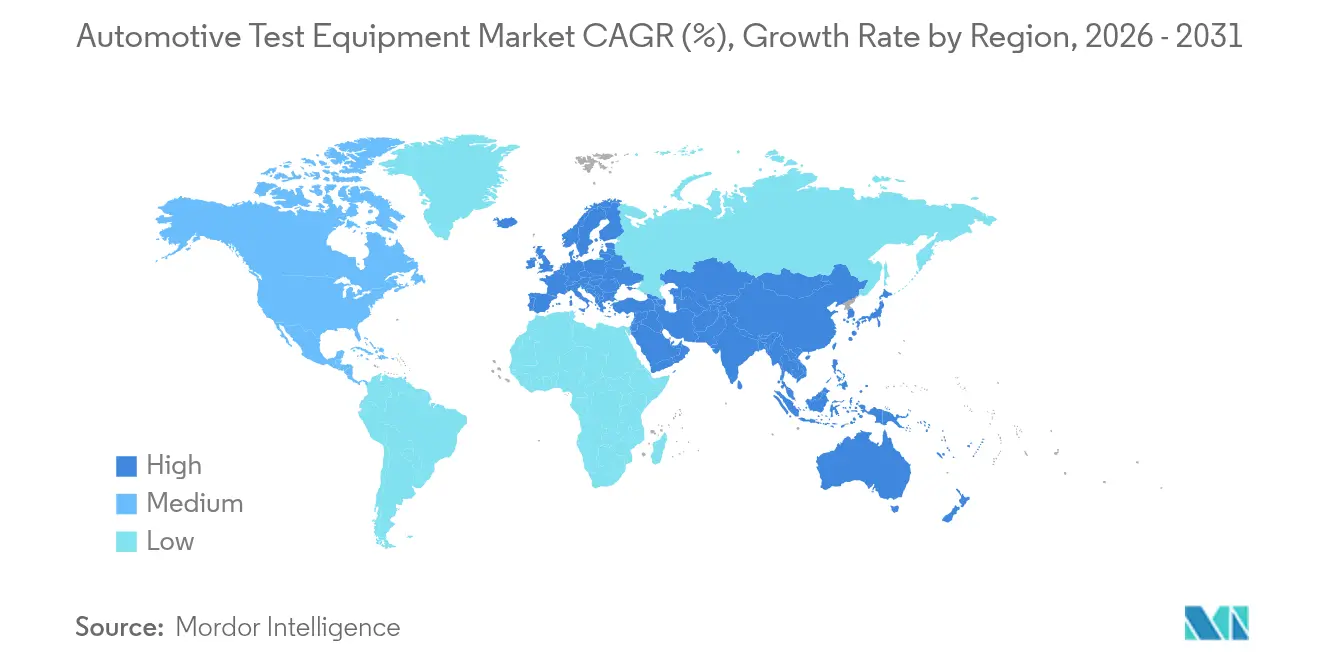
| Fastest Growing Market | Europe |
| Largest Market | Asia Pacific |
| Market Concentration | Medium |
Major Players *Disclaimer: Major Players sorted in no particular order Image © Mordor Intelligence. Reuse requires attribution under CC BY 4.0. | |
Automotive Test Equipment Market Analysis by Mordor Intelligence
The automotive test equipment market size was valued at USD 3.65 billion in 2025 and estimated to grow from USD 3.81 billion in 2026 to reach USD 4.67 billion by 2031, at a CAGR of 4.19% during the forecast period (2026-2031). Growth stemmed from the transition away from combustion-centric validation toward electrification, software-defined vehicle (SDV) updates, and multi-sensor ADAS testing. Mandatory UN R155 cybersecurity audits, rapid battery gigafactory expansions, and WLTP-driven real-world emission cycles continued to reshape capital-spending priorities across OEMs and independent laboratories. European regulations preserved the region’s leadership position, yet Asia-Pacific became the fastest-advancing geography as Chinese and Indian facilities ramped up high-voltage and end-of-line battery testing. Competitive dynamics stayed fragmented because low-cost Asian bench assemblers compressed margins while a global shortage of calibration engineers limited overall capacity.
Key Report Takeaways
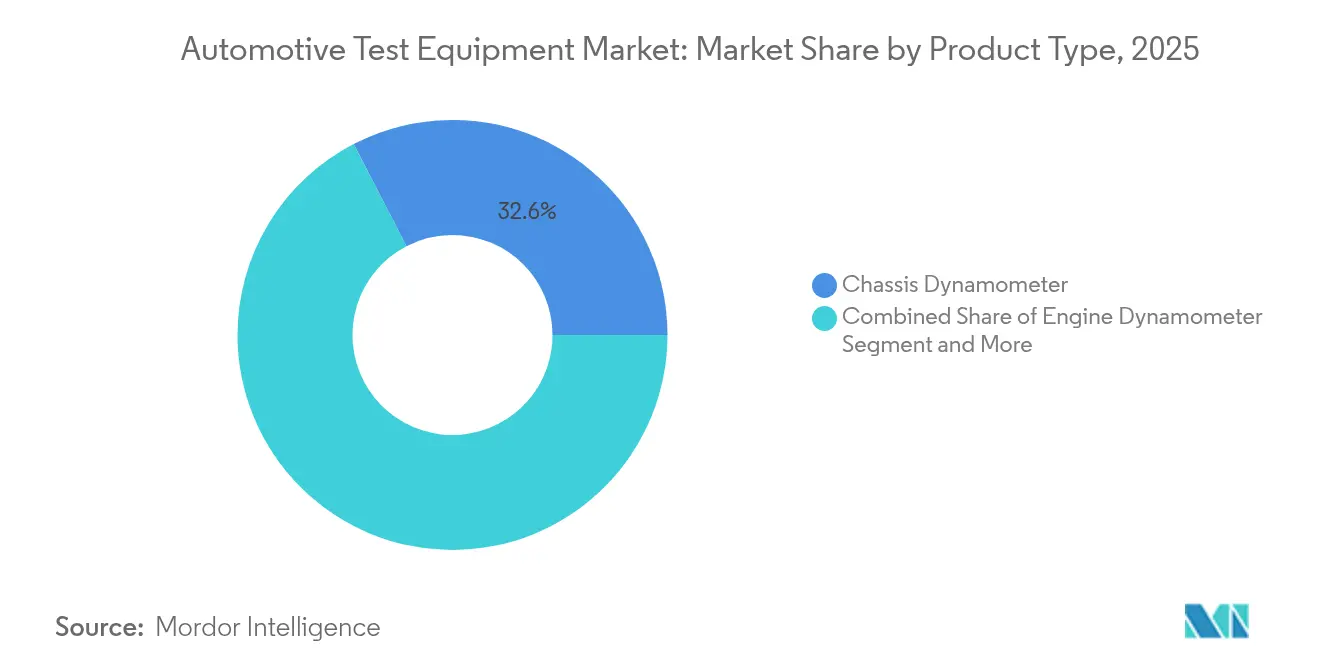
- By product type, chassis dynamometers led with 32.60% revenue share in 2025, while EV and battery test systems are projected to expand at a 19.2% CAGR to 2031.
- By advanced technology, EV battery and cycler rigs captured 29.10% of the automotive test equipment market share in 2025; cybersecurity hardware-in-the-loop benches exhibit the highest forecast CAGR at 13.1% through 2031.
- By vehicle type, passenger cars accounted for 61.50% of testing demand in 2025, yet commercial electric vehicles are advancing at a 14.8% CAGR between 2026-2031.
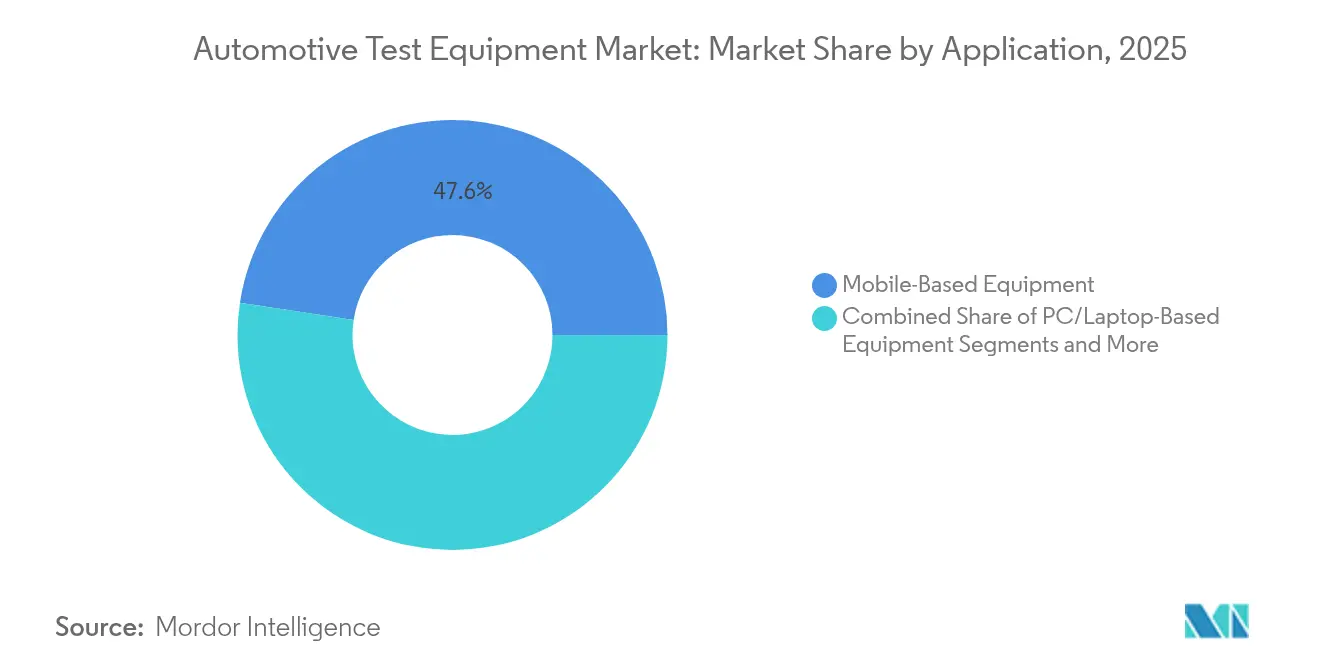
- By application, mobile workshop scanners held 47.60% of demand in 2025, whereas fixed laboratory multi-physics rigs are progressing at a 13.7% CAGR.
- By end user, OEM R&D centers represented 39.60% of expenditure in 2025, while independent test labs are set to grow at an 10.9% CAGR as outsourcing intensifies.
- Europe maintained 34.70% regional share in 2025; Asia-Pacific is poised for an 11.2% CAGR through 2031 as battery gigafactories multiply.
Note: Market size and forecast figures in this report are generated using Mordor Intelligence’s proprietary estimation framework, updated with the latest available data and insights as of 2026.
Global Automotive Test Equipment Market Trends and Insights
Drivers Impact Analysis*
| Driver | (~) % Impact on CAGR Forecast | Geographic Relevance | Impact Timeline |
|---|---|---|---|
| Growing EV and hybrid powertrain validation demand | +1.8% | Global, Asia-Pacific, and EU leading | Medium term (2-4 years) |
| Shift to software-defined vehicles requires over-the-air test capability | +1.2% | North America and the EU, expanding to Asia-Pacific | Long term (≥ 4 years) |
| ADAS/AV regulation mandating multi-sensor test benches | +0.9% | EU and North America core, spill-over to Asia-Pacific | Short term (≤ 2 years) |
| Tightening WLTP and EPA emission cycles driving real-world dyno upgrades | +0.7% | EU and North America primarily | Short term (≤ 2 years) |
| Rising vehicle cybersecurity compliance testing (UN R155) | +0.6% | EU mandatory, expanding globally | Medium term (2-4 years) |
| Rapid battery-cell gigafactory build-out needing end-of-line testers | +1.1% | Global, China and North America leading | Medium term (2-4 years) |
| Source: Mordor Intelligence | |||
Growing EV and Hybrid Powertrain Validation Demand
Battery-centric validation drove the largest structural change in the automotive test equipment market. More than 400 global gigafactories scheduled for operation by 2030 placed unprecedented emphasis on formation cyclers, thermal abuse rigs, and end-of-line testers. Honeywell’s Battery Manufacturing Excellence Platform reduced scrap rates by 60%, illustrating cost-saving opportunities that encourage rapid equipment upgrades[1]Honeywell, “Honeywell Revolutionizes Large-Scale Battery Manufacturing with Automation Software,” honeywell.com. Ultrasound-based inspection from Titan Advanced Energy Solutions processed 50,000 cells per day, cutting cycle time by 20% and improving yields by up to 5%. Equipment suppliers faced protocol fragmentation across lithium-iron-phosphate and emerging solid-state chemistries, compelling modular system designs that accommodate diverse form factors. Long-life modeling requirements expanded test durations to simulate 10-15 year duty cycles, elevating demand for high-throughput automation.
Shift to Software-Defined Vehicles Requires Over-the-Air Test Capability
SDV architectures moved validation from periodic certification to continuous software upkeep. Vehicles assembled in 2025 carried up to 1 billion lines of code, demanding hardware-in-the-loop assets that replicate real-world connectivity. ISO 24089 established secure update frameworks, forcing laboratories to verify update integrity, back-out strategies, and fail-safe reboot logic . The 2025 SDV Survey found that 67% of automakers already issued OTA patches, yet only 23% deployed them for functional upgrades, underscoring latent growth potential . Centralized compute domains replaced scattered ECUs, increasing network bandwidth and cybersecurity exposure. Test platforms now integrate penetration-testing scripts alongside functional diagnostics to certify compliance with UN R156 and R155.
ADAS/AV Regulation Mandating Multi-Sensor Test Benches
UN R157 required that automated lane-keeping systems prove sensor fusion reliability before type approval. Combined radar, lidar, camera, and ultrasonic simulation environments became indispensable, spurring adoption of integrated benches such as the Rohde and Schwarz-IPG Automotive radar HIL solution. Laboratories replicated edge-case weather, glare, and obstruction scenarios while tracking sensor degradation over time. Production lines added precision alignment stages to calibrate multi-modal arrays within millimeter tolerances. Demand surfaced not only in OEM facilities but also in aftermarket centers obligated to recalibrate sensors after windshield or bumper repairs. As regional rules converged, component suppliers raced to pre-validate modules, boosting bench utilization rates.
Tightening WLTP and EPA Emission Cycles Driving Real-World Dyno Upgrades
WLTP’s four-phase profile replaced NEDC, requiring dynamometers with faster transient response and extended speed ranges. EPA revisions layered ambient temperature and accessory loads onto drive schedules, necessitating hardware that simulates high-speed and thermal conditions simultaneously. Modern dynamometers integrated electric motor technology that enabled regenerative braking capture, cutting operational energy costs, and aligning with EV testing needs. Hybrid protocols demanded seamless switching between combustion and electric drive loops, prompting control-software upgrades. The retrofit cycle accelerated as ICE-hybrid certification windows shrank, encouraging fleet labs to phase out legacy equipment earlier than planned.
Restraints Impact Analysis*
| Restraint | (~) % Impact on CAGR Forecast | Geographic Relevance | Impact Timeline |
|---|---|---|---|
| High CAPEX of multi-physics test labs | -0.8% | Global, smaller OEMs are hardest hit | Short term (≤ 2 years) |
| Scarcity of skilled calibration engineers | -0.6% | North America and the EU | Medium term (2-4 years) |
| Price pressure from low-cost Asian bench assemblers | -0.4% | Global | Long term (≥ 4 years) |
| Lengthy certification lead-times slowing equipment turnover | -0.5% | EU and North America | Medium term (2-4 years) |
| Source: Mordor Intelligence | |||
High CAPEX of Multi-Physics Test Labs
Comprehensive facilities routinely exceeded USD 50 million outlays because electromagnetic compatibility, thermal cycling, cybersecurity, and mechanical rigs must coexist within one site. Hyundai’s digital-twin collaboration with Siemens illustrated the sophistication and expenditure needed to replicate suspension dynamics, transfer-path acoustics, and full-vehicle NVH in the same hall. Smaller suppliers struggled to justify such budgets, pushing them toward outsourcing. Even independent laboratories faced financing hurdles for anechoic chambers or isolated network cells required for UN R155 audits. Capital barriers threaten to concentrate testing capability among cash-rich OEMs and global lab chains.
Scarcity of Skilled Calibration Engineers
Only 58,800 TechSafe-qualified EV technicians operated across the United Kingdom in 2024, covering 24% of service demand and signalling a broader global shortfall. ADAS alignment, battery abuse tests, and cybersecurity penetration reviews each require niche expertise that takes years to master. Training curricula lag behind rapid technology shifts despite new SAE and ISO programs, leaving labs to compete for scarce talent at premium wages. The shortage inflated project timelines, raised labour rates, and limited the throughput of commercial facilities, particularly those serving multiple OEM accounts.
*Our forecasts treat driver/restraint impacts as directional, not additive. The impact forecasts reflect baseline growth, mix effects, and variable interactions.
Segment Analysis
By Product Type: EV Testing Drives Traditional Equipment Evolution
Chassis dynamometers retained 32.60% share in 2025, yet investment momentum clearly pivoted toward battery test systems that are growing at a 19.2% CAGR. The automotive test equipment market size for EV and battery rigs is projected to surpass USD 1.52 billion by 2031, reflecting gigafactory proliferation and stringent safety mandates. Legacy dynamometers underwent upgrades to handle regenerative braking loads and high-torque electric drivetrains. Engine and transmission benches saw reduced specification roadmaps as OEMs downsized combustion portfolios. Emission analysers are adapted to hybrid duty-cycles, while diagnostic scan tools are migrated to cloud-enabled platforms that accept OTA firmware packs and cybersecurity definitions.
HORIBA capitalized on decades of dynamometer engineering to retrofit existing cells with energy-recovery drives and battery conditioning modules . Chroma ATE expanded fully automated cycler lines that manage currents to 150 A for large-format prismatic cells, integrating thermal chambers for abuse testing. Wheel-alignment and fuel-injection testers experienced volume deceleration because electric drivetrains eliminated many mechanical subsystems. Despite slower growth, these segments persisted in regions where combustion vehicles still command aftermarket service demand.


By Advanced Technology Type: Cybersecurity Testing Emerges as Critical Domain
EV battery and cycler rigs commanded 29.10% of 2025 revenue and remained the principal recipient of green-field capex. The automotive test equipment market benefited from Thyssenkrupp Automation Engineering’s modular formation solutions that flex for cylindrical, pouch, or prismatic formats. Long-duration degradation programs obliged high-parallel channel counts, driving significant power-supply procurement.
Cybersecurity benches, while smaller in absolute value, recorded the fastest CAGR at 13.1% because every new platform entering Europe post-July 2024 required UN R155 sign-off. Suppliers embedded threat-simulation libraries that mirror the MITRE ATT&CK framework, enabling repeatable penetration routines. ADAS simulators added radar-object injectors and camera luminance engines to verify sensor fusion robustness. ECU testing evolved to validate high-performance compute boards with 10 Gbps ethernet backbones. Data loggers shifted from removable media toward cloud API streaming, enabling predictive maintenance analytics.
By Vehicle Type: Commercial EV Acceleration Outpaces Passenger Segment
Passenger cars underpinned 61.50% of 2025 spending because of global production volumes and diverse powertrain choices. The automotive test equipment market size for passenger-car validation is expected to reach USD 2.86 billion by 2031 after absorbing SDV and ADAS content. Testing remained complex: ICE-hybrid dual loops, battery thermal assessment, and software regression all coexisted.
Commercial electric buses and trucks, however, delivered the highest CAGR at 14.8%. Fleets mandated energy-efficiency proofs, battery-life projections, and high-voltage safety checks that differ from passenger norms. The University of California Riverside’s 80,000 lb heavy-duty dynamometer showcased the scale upgrades required for torque and inertia capture UCR. Two-wheeler and micromobility rigs emerged as an urban-mobility niche, validating compact battery packs, lightweight motors, and connected diagnostic apps.
By Application: Fixed Laboratory Investment Accelerates Despite Mobile Dominance
Mobile workshop scanners held 47.60% demand in 2025 thanks to affordability and ease of use across dispersed service networks. Hardware updates enabled secure OTA credential checks, letting technicians authorize software flashes in the field. Yet OEMs and tier-1 suppliers prioritized 13.7% CAGR spending on fixed laboratories capable of multi-physics validation under one roof.
Laboratories implemented climate-controlled chambers, electromagnetic shielding, and robotic positioning systems that portable devices cannot replicate. PC or laptop-based rigs bridged the gap, delivering more compute power than handheld units while preserving on-site flexibility. Asia-Pacific manufacturers accelerated fixed-lab builds to localize certification and avoid shipment of prototypes overseas, aligning with regional sovereignty goals.
By End User: Independent Labs Gain Share Through Specialization
OEM R&D centers still purchased 39.60% of equipment in 2025, preserving in-house control over IP-sensitive programs such as next-generation battery chemistries. Nevertheless, mounting regulatory complexity shifted select tasks to independent labs, propelling their 10.9% CAGR. TÜV SÜD Czech, for instance, provided rare end-to-end UN R155 assessment slots, with timelines often running 18 months due to backlog .
Tier-1 suppliers continued investing in production-line end-of-line rigs, whereas vehicle inspection centres retrofitted HV isolation testers to certify aging EV fleets. Aftermarket chains explored subscription-based diagnostic software but faced technician shortages that capped uptake.
Geography Analysis
Europe accounted for 34.70% of 2025 revenue because WLTP emissions, UN R155 cyber rules, and ADAS regulations collectively increased validation scope. Germany, France, and the United Kingdom hosted most of the continent’s multi-physics facilities, often linked directly to OEM engineering campuses. These premium requirements pushed average selling prices above global norms, supporting healthy local margins even as price-conscious Asian vendors penetrated entry-level tiers.
Asia-Pacific registered the strongest trajectory at an 11.2% CAGR to 2031. China’s leadership in battery gigafactories triggered surging demand for formation cyclers and abuse test rigs. W-Ibeda’s USD 104 million smart NEV lab investment typified corporate commitment to domestic validation. India’s ascent to the world’s third-largest vehicle producer spurred OEMs to install localized end-of-line lines to sidestep cross-border certification delays. Japan and South Korea focused on hybrid and semiconductor integration, sustaining high-precision test equipment imports.
North America represented a steady, regulation-driven market. EPA real-world dynamometer updates and NHTSA autonomous-pilot guidelines required iterative bench enhancements. Battery corridor projects across Michigan, Tennessee, and Ontario stimulated orders for high-current cyclers and salty-spray corrosion chambers. Mexico’s expanding assembly base drove demand for conveyor-mounted wheel-alignment stations targeting export-bound vehicles. The Middle East and Africa remained nascent; however, green hydrogen trucking pilots in the UAE and South-African EV incentives signalled future equipment needs.

Competitive Landscape
The automotive test equipment market displayed moderate fragmentation. HORIBA, AVL, and Bosch continued to dominate high-complexity dynamometers through engineering depth and installed-base leverage. AVL integrated AI-driven analytics into combustion and hybrid rigs, enabling automated anomaly detection and reducing test durations. Bosch upgraded ESI[tronic] Evolution software to include Tesla diagnostics, underscoring the shift toward SDV compatibility[3]Robert Bosch GmbH, “Seizing opportunities in challenging times – together with Bosch,” bosch-presse.de.
Software-centric entrants such as Applied Intuition advanced cloud simulation platforms that compress physical mileage requirements by virtualizing edge-case scenarios. Hardware stalwarts responded via partnerships and acquisitions: Rohde and Schwarz collaborated with IPG Automotive to combine radar object simulators and scenario software in one HIL stack. Keysight expanded 5G-V2X verification benches, aligning with emerging sidelink requirements.
Asian value players supplied chassis and engine benches at 20-30% lower price points, intensifying margin pressure in cost-sensitive segments. Simultaneously, premium buyers demanded fully integrated cyber-secure, cloud-connected solutions, fueling a barbell structure where both low-cost and high-value offerings grew. Strategic whitespace persists in solid-state battery formation equipment and dedicated UN R155 penetration test automation, where supplier capacity still trails demand.
Automotive Test Equipment Industry Leaders
Delphi Technologies
ABB Group
Honeywell International Inc.
Robert Bosch GmbH
Horiba Ltd.
- *Disclaimer: Major Players sorted in no particular order

Recent Industry Developments
- July 2025: Anritsu Corporation showcased its Power HIL system at Automotive Technology Exhibition 2025 Nagoya, combining precision supplies with HIL simulation for EV validation.
- June 2025: The 2025 SDV Survey confirmed that 67% of automotive professionals issue OTA updates, while only 23% employ them for feature upgrades, spotlighting future test-bench demand.
- May 2025: Siemens presented Simcenter advancements at Automotive Testing Expo 2025, emphasizing integrated physical-digital workflows.
- April 2025: HORIBA opened its Vehicle Test Cell facility, expanding emissions and energy-consumption assessment capacity.


Global Automotive Test Equipment Market Report Scope
Automotive test equipment encompasses a diverse array of tools and devices designed to assess, test, and diagnose vehicle components and systems. These instruments assist automotive technicians and engineers in verifying that vehicles and their parts operate efficiently, adhere to safety standards, and comply with environmental regulations. The research also examines underlying growth influencers and significant industry vendors, all of which help to support market estimates and growth rates throughout the anticipated period. The market estimates and projections are based on the base year factors and arrive at using top-down and bottom-up approaches.
The automotive test equipment market is segmented by product type (Chassis Dynamometer, Engine Dynamometer, Vehicle Emission Test System, Wheel Alignment Tester, Fuel Injection Pump Tester and Transmission Dynamometer), by advance technology type (ADAS Testing, ECU Testing, Data Logger System, and EV Testing), by vehicle type (Passenger Car and Commercial Vehicle), by application (Mobile-Based Equipment and PC/Laptop-Based Equipment) and by geography (North America, Europe, Asia Pacific, South America, and Middle East & Africa). The market size and forecasts are provided in terms of value (USD) for all the above segments.
| Chassis Dynamometer |
| Engine Dynamometer |
| Transmission Dynamometer |
| Vehicle Emission Test System |
| Wheel Alignment Tester |
| Fuel Injection Pump Tester |
| Diagnostic Scan Tools |
| ADAS Testing |
| ECU Testing |
| Data Logger System |
| EV and Battery Testing |
| Passenger Car |
| Commercial Vehicle |
| Two-Wheeler and Micromobility |
| Mobile-Based Equipment |
| PC/Laptop-Based Equipment |
| Fixed Laboratory Rigs |
| OEM R&D Centers |
| Tier-1 Suppliers |
| Independent Test Labs |
| Vehicle Inspection Centers |
| Aftermarket Service Shops |
| North America | United States | |
| Canada | ||
| Mexico | ||
| South America | Brazil | |
| Argentina | ||
| Rest of South America | ||
| Europe | United Kingdom | |
| Germany | ||
| France | ||
| Italy | ||
| Spain | ||
| Nordics | ||
| Rest of Europe | ||
| Middle East and Africa | Middle East | Saudi Arabia |
| United Arab Emirates | ||
| Turkey | ||
| Rest of Middle East | ||
| Africa | South Africa | |
| Egypt | ||
| Nigeria | ||
| Rest of Africa | ||
| Asia-Pacific | China | |
| India | ||
| Japan | ||
| South Korea | ||
| ASEAN | ||
| Australia | ||
| New Zealand | ||
| Rest of Asia-Pacific | ||
| By Product Type | Chassis Dynamometer | ||
| Engine Dynamometer | |||
| Transmission Dynamometer | |||
| Vehicle Emission Test System | |||
| Wheel Alignment Tester | |||
| Fuel Injection Pump Tester | |||
| Diagnostic Scan Tools | |||
| By Advanced Technology Type | ADAS Testing | ||
| ECU Testing | |||
| Data Logger System | |||
| EV and Battery Testing | |||
| By Vehicle Type | Passenger Car | ||
| Commercial Vehicle | |||
| Two-Wheeler and Micromobility | |||
| By Application | Mobile-Based Equipment | ||
| PC/Laptop-Based Equipment | |||
| Fixed Laboratory Rigs | |||
| By End User | OEM R&D Centers | ||
| Tier-1 Suppliers | |||
| Independent Test Labs | |||
| Vehicle Inspection Centers | |||
| Aftermarket Service Shops | |||
| By Geography | North America | United States | |
| Canada | |||
| Mexico | |||
| South America | Brazil | ||
| Argentina | |||
| Rest of South America | |||
| Europe | United Kingdom | ||
| Germany | |||
| France | |||
| Italy | |||
| Spain | |||
| Nordics | |||
| Rest of Europe | |||
| Middle East and Africa | Middle East | Saudi Arabia | |
| United Arab Emirates | |||
| Turkey | |||
| Rest of Middle East | |||
| Africa | South Africa | ||
| Egypt | |||
| Nigeria | |||
| Rest of Africa | |||
| Asia-Pacific | China | ||
| India | |||
| Japan | |||
| South Korea | |||
| ASEAN | |||
| Australia | |||
| New Zealand | |||
| Rest of Asia-Pacific | |||


Key Questions Answered in the Report
What is the current size of the automotive test equipment market?
The automotive test equipment market measured USD 3.81 billion in 2026 and is projected to reach USD 4.67 billion by 2031.
Which region leads the market and which grows fastest?
Europe retained 34.70% share in 2025, whereas Asia-Pacific is forecast to expand at an 11.2% CAGR through 2031.
Which product category is growing most rapidly?
EV and battery test systems are advancing at a 19.2% CAGR, far exceeding traditional chassis dynamometer growth.
Why are cybersecurity benches in high demand?
UN R155 mandates that every new vehicle platform undergo cyber-intrusion validation, accelerating adoption of hardware-in-the-loop benches that simulate attack vectors.
What is the biggest challenge facing equipment buyers?
High capital expenditure for multi-physics laboratories and a shortage of skilled calibration engineers limit the pace of capacity expansion.
How will commercial electric vehicles influence testing needs?
Heavy-duty EV fleets require high-torque dynamometers, large-format battery cyclers, and duty-cycle-specific durability protocols, driving a 14.8% CAGR in commercial segment equipment demand.
Page last updated on:


