AEC Software Market Size and Share
Market Overview
| Study Period | 2020 - 2031 |
|---|---|
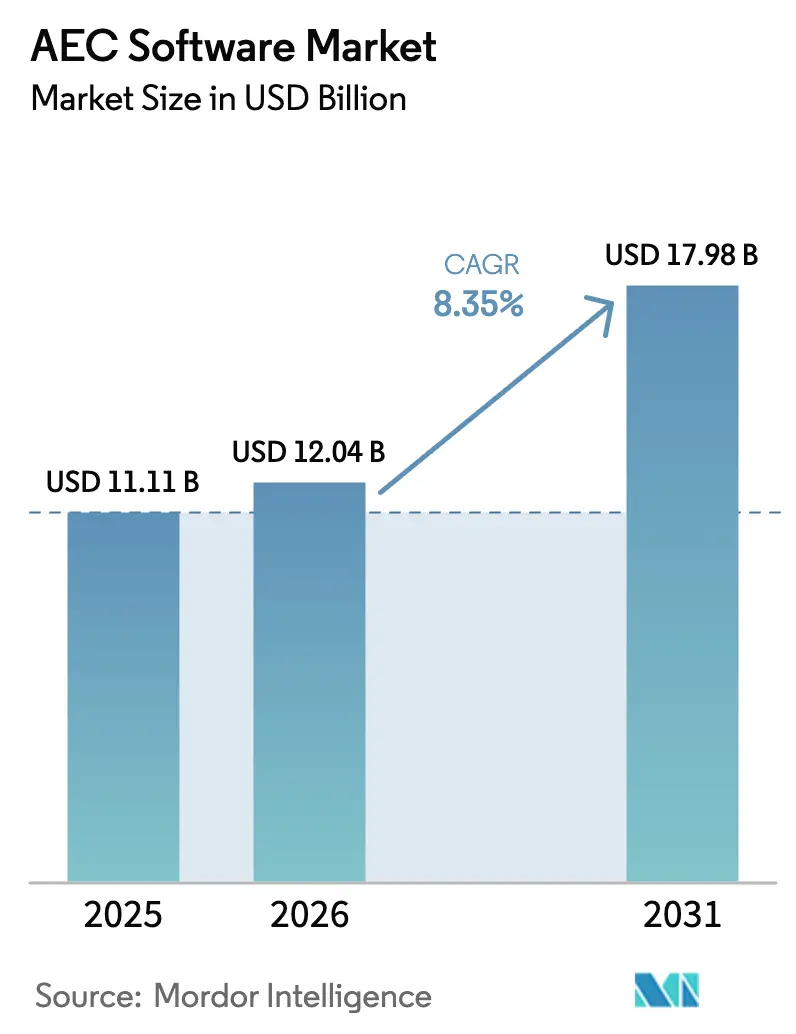
| Market Size (2026) | USD 12.04 Billion |
| Market Size (2031) | USD 17.98 Billion |
| Growth Rate (2026 - 2031) | 8.35% CAGR |
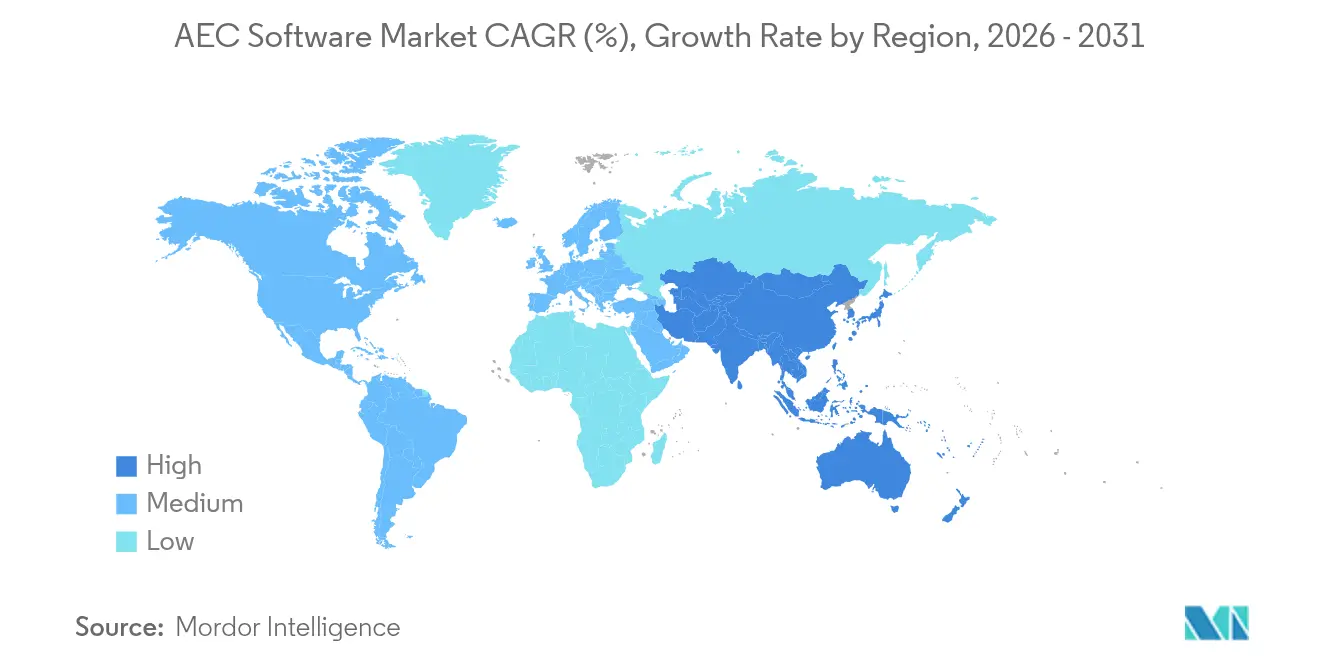
| Fastest Growing Market | Asia Pacific |
| Largest Market | North America |
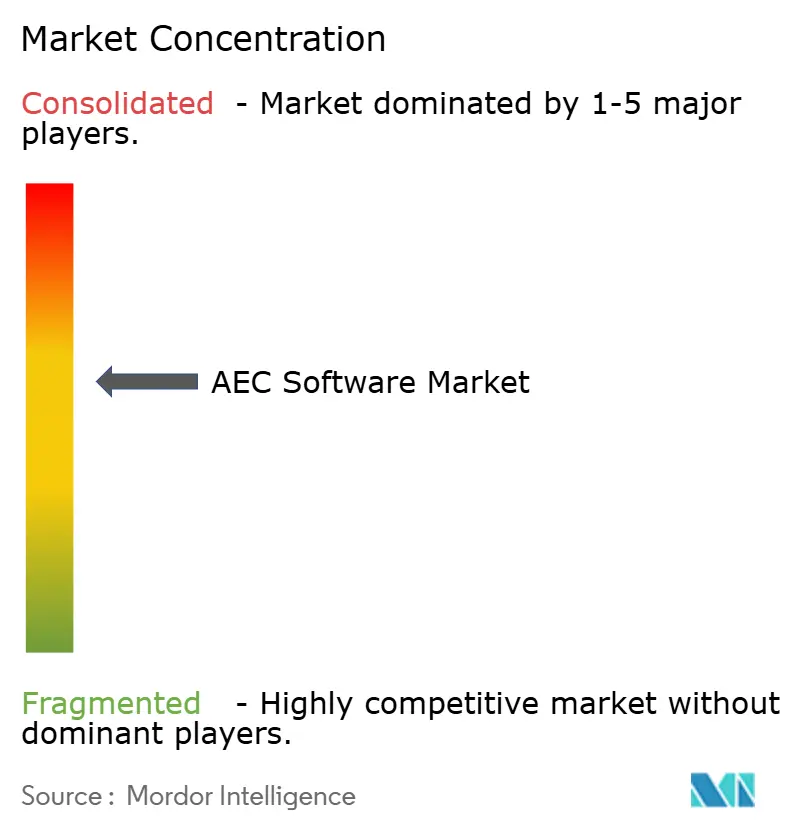
| Market Concentration | Medium |
Major Players *Disclaimer: Major Players sorted in no particular order Image © Mordor Intelligence. Reuse requires attribution under CC BY 4.0. | |
AEC Software Market Analysis by Mordor Intelligence
The AEC software market size is expected to grow from USD 11.11 billion in 2025 to USD 12.04 billion in 2026 and is forecast to reach USD 17.98 billion by 2031 at 8.35% CAGR over 2026-2031. This expansion reflects an acceleration in the construction sector’s digital transformation as infrastructure programs in new megacities converge with government rules that make Building Information Modeling compulsory on public contracts. Falling cloud‐hosting costs allow small and medium enterprises to adopt sophisticated design, modeling, and project-management systems, while generative-AI tools shorten iteration cycles and inspire platform vendors to consolidate feature sets. In parallel, owners’ preference for single-source data environments is pushing vendors to weave together formerly separate design, construction, and operations modules, opening fresh routes to recurring revenue through subscription bundles that expand the addressable client base of the AEC software market.
Key Report Takeaways
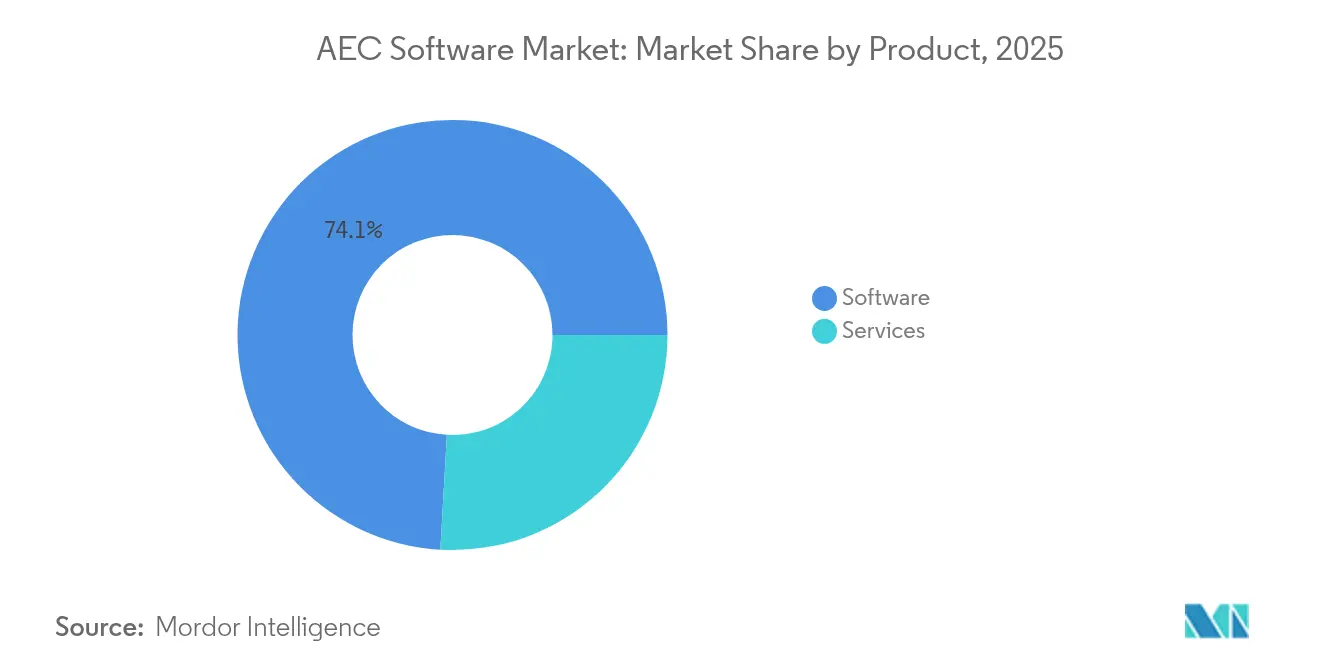
- By product category, software commanded 74.10% of 2025 revenue, while services are projected to expand at a 10.85% CAGR through 2031.
- By deployment model, cloud solutions captured 59.70% of spending in 2025 and are forecast to grow at a 10.25% CAGR to 2031.
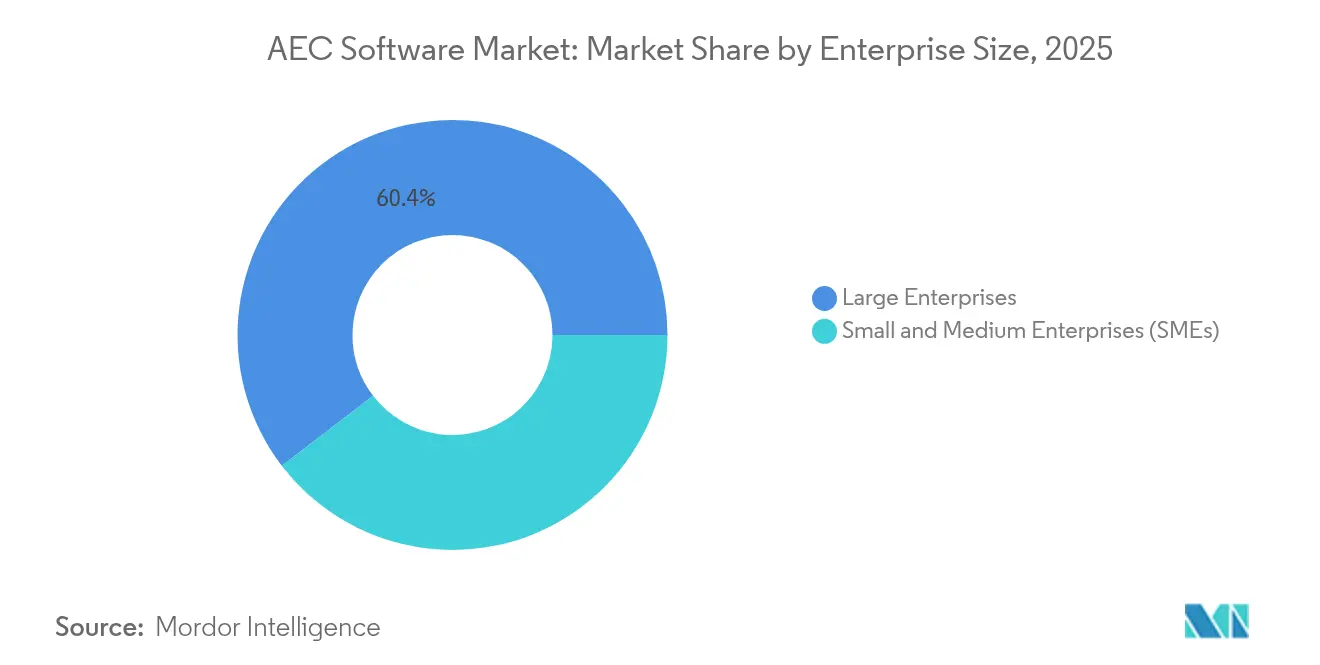
- By enterprise size, large enterprises held 60.40% of the AEC software market share in 2025, whereas SMEs are set to record the fastest rise with an 11.25% CAGR through 2031.
- By discipline, architecture led with a 50.00% share in 2025; construction is expected to log a 10.90% CAGR over the forecast horizon.
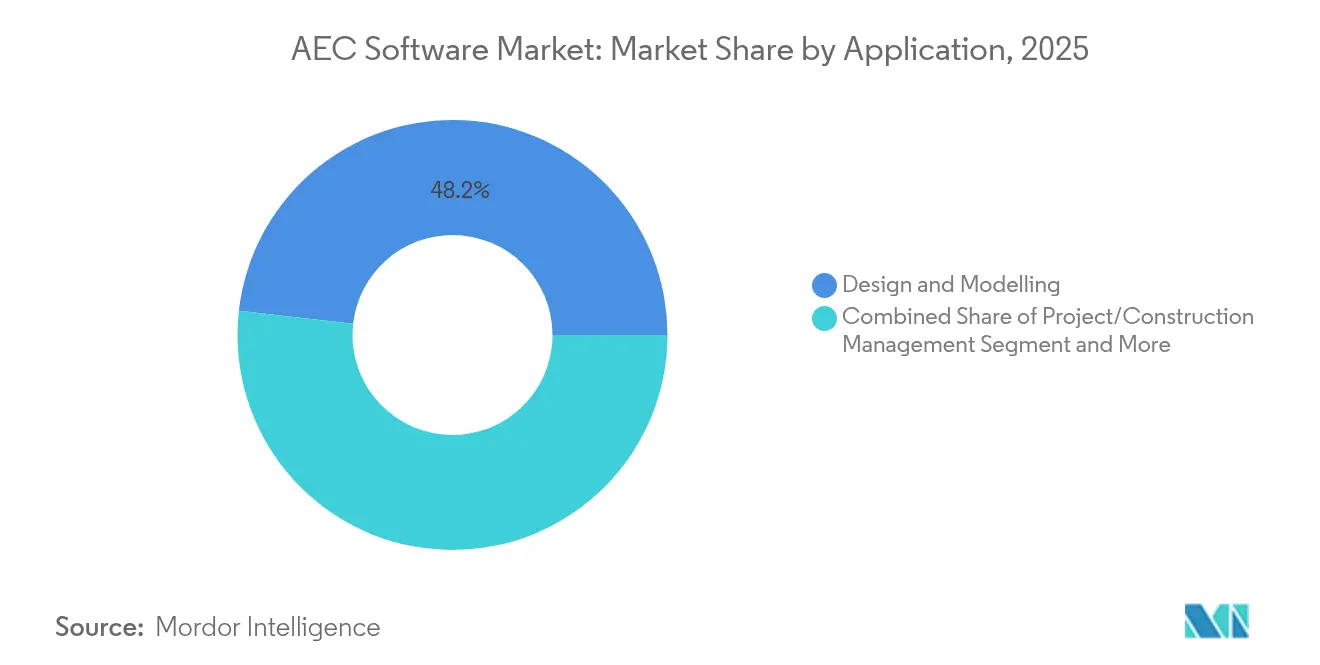
- By application, design and modeling tools contributed 48.20% of 2025 revenue, whereas project and construction management platforms are on track for an 11.10% CAGR to 2031.
- By end-user, design consultancies accounted for 51.40% of revenue in 2025, while owners/developers are poised for a 10.95% CAGR through 2031.
- By geography, North America commanded 37.90% revenue share in 2025; Asia-Pacific is projected to lead growth with a 10.70% CAGR to 2031.
Note: Market size and forecast figures in this report are generated using Mordor Intelligence’s proprietary estimation framework, updated with the latest available data and insights as of 2026.
Global AEC Software Market Trends and Insights
Drivers Impact Analysis*
| Driver | (~) % Impact on CAGR Forecast | Geographic Relevance | Impact Timeline |
|---|---|---|---|
| Infrastructure boom in emerging megacities | +2.1% | Asia-Pacific core, spill-over to MEA | Medium term (2-4 years) |
| Mandated BIM use in public-sector projects | +1.8% | Global, with early gains in Europe, North America | Short term (≤ 2 years) |
| Cloud affordability for SMEs | +1.5% | Global, particularly strong in emerging markets | Short term (≤ 2 years) |
| Consolidation of design-build data platforms | +1.3% | North America and EU, expanding to APAC | Medium term (2-4 years) |
| Generative-AI-driven carbon-optimal design | +1.0% | Global, led by sustainability-focused regions | Long term (≥ 4 years) |
| Digital-twin O&M cost-savings proof-points | +1.2% | Global, early adoption in commercial real estate | Medium term (2-4 years) |
| Source: Mordor Intelligence | |||
Infrastructure Boom in Emerging Megacities
Public authorities in Asia-Pacific are channeling record budgets into transport hubs, prefabricated housing, and district-scale smart utilities, intensifying demand for advanced modeling applications that can coordinate hundreds of subcontractors at once. China’s 14th Five-Year Plan funnels capital toward new urban clusters, while India’s Smart Cities Mission favors BIM-ready documentation on all tender packages. Singapore’s Building and Construction Authority already stipulates BIM submissions on public projects valued above SGD 5 million, setting a compliance benchmark for regional neighbors. Because megacity programs combine rail, utilities, and vertical construction, the AEC software market benefits from bundled licenses that cover design authoring, clash detection, and digital twin handover in a single platform instance. Contractors that historically relied on 2-D CAD now migrate to parametric modeling in order to secure prequalification, creating a multiplier effect for the AEC software market as each flagship scheme triggers follow-on technology purchases among tier-two suppliers. International vendors partly localize user interfaces and code libraries to capture this wave, but competition from indigenous brands remains vigorous, sustaining price transparency and spurring feature innovation.
Mandated BIM Use in Public-Sector Projects
Across advanced economies, voluntary BIM guidance has evolved into enforceable procurement policy. The United Kingdom insists on BIM Level 2 deliverables across all centrally funded works, while the US General Services Administration extends similar provisions to federal jobs above USD 750,000. Eastern European transport ministries incorporate BIM clauses into EU-backed modernization tenders, creating uniform purchase triggers for software vendors. These regulations guarantee a predictable core of annual demand because compliance is not discretionary, driving stable license renewals and service contracts that underpin long‐term revenue visibility for the AEC software market. They also set a hurdle that smaller niche suppliers often struggle to clear, thereby supporting moderate consolidation as certified multiproduct vendors fill the vacuum. The standardization of information-management protocols, moreover, accelerates cloud platform conversion because public owners increasingly accept SaaS hosting once data security requirements are codified in contractual language.
Cloud Affordability for SMEs
Subscription pricing turns what was once a capital purchase into a monthly operating expense, opening BIM and project management portfolios to thousands of studios with fewer than 50 staff. Autodesk’s conversion from perpetual seats to subscription in 2024 lowered the up-front cost for Revit to USD 290 per month, a steep drop from the earlier lifetime license, encouraging small practices to trial full-feature environments without high sunk costs. Cloud hosting further removes workstation constraints because compute-intensive rendering is offloaded to vendor data centers, letting SMEs run complex simulations on mid-range laptops. As SMEs join larger consortia bidding on public work, they are compelled to meet BIM submission rules, therefore multiplying the penetration of the AEC software market among the long‐tail of designers, surveyors, and trade contractors. Vendors respond with simplified onboarding tutorials and pre-packaged discipline templates that speed first-time user adoption and nurture a pipeline of incremental license upgrades.
Consolidation of Design-Build Data Platforms
Inefficiencies created by disjointed point solutions lead owners to favor integrated project-delivery ecosystems that share a single data model from conceptual design through operations. The National Institute of Standards and Technology pegged the annual cost of poor interoperability to the US industry at USD 15.8 billion. In response, established brands are striking code-sharing alliances or outright acquiring complementary modules, a trend illustrated by the 2024 agreement between Autodesk and Nemetschek to streamline exchange workflows between their flagship suites. End-users gain fewer data-translation errors and swifter change-order approvals, while vendors earn broader wallet share and defensible long-term contracts. As consolidation deepens, buyers anticipate native integrations for generative-AI design suggestions, embodied-carbon dashboards, and field-level sensor feedback, reinforcing a flywheel that keeps the AEC software market on an upward revenue trajectory.
Restraints Impact Analysis*
| Restraint | (~) % Impact on CAGR Forecast | Geographic Relevance | Impact Timeline |
|---|---|---|---|
| Talent gap in advanced modeling | -1.2% | Global, particularly acute in emerging markets | Medium term (2-4 years) |
| Inter-suite data-exchange friction | -0.8% | Global, most severe in complex multi-vendor projects | Short term (≤ 2 years) |
| Cyber-security/IP liability on multitenant clouds | -0.6% | Global, heightened in regulated industries | Short term (≤ 2 years) |
| Antitrust scrutiny of de-facto monopolies | -0.4% | North America and EU regulatory jurisdictions | Long term (≥ 4 years) |
| Source: Mordor Intelligence | |||
Talent Gap in Advanced Modeling
Many contractors purchase licenses yet fall short of capturing productivity gains because they lack staff adept at parametric authoring, 4-D sequencing, or AI-assisted clash resolution. Autodesk’s 2024 State of Design and Make Report shows 56% of surveyed firms listing advanced modeling as their foremost recruitment pain point. Pay premiums of 15%–25% for BIM talent inflate project costs and dilute the return on software investment, especially among SMEs that cannot match corporate salary budgets. Training pipelines need six months or more to elevate Revit or Tekla novices to job-ready proficiency, delaying vendor revenue recognition tied to active-use metrics. Although cloud-hosted learning portals shorten ramp-up times, the underlying demographic shortfall remains a medium-term headwind for the AEC software market.
Inter-Suite Data-Exchange Friction
Proprietary storage schemas still impede seamless handover when teams mix authoring tools, despite nominal support for open formats. Minor attribute mismatches can force repetitive manual checks that erode the very efficiency digital workflows promise. NIST attributes USD 15.8 billion in annual US rework and delay costs to such interoperability gaps. [1]“Cost Analysis of Inadequate Interoperability in Construction,” NIST, nist.gov As owners codify interoperability performance clauses into contracts, vendors shoulder the burden of sustaining importer/exporter patches that raise maintenance overhead. Smaller publishers often struggle to allocate sufficient engineering resources, entrenching dependence on top-tier ecosystems and curbing competitive intensity that might otherwise spur price reductions across the AEC software market.
*Our forecasts treat driver/restraint impacts as directional, not additive. The impact forecasts reflect baseline growth, mix effects, and variable interactions.
Segment Analysis
By Product: Services Accelerate Despite Software Dominance
Software licenses remained the primary revenue driver in 2024, yet the services slice is enlarging swiftly because clients want workflow mapping, template creation, and custom API scripting that help realize the full utility of purchased code. Services grew 10.85% annually, outpacing the overall AEC software market and reinforcing the thesis that digital transformation is more about disciplined process change than tool acquisition. Hybrid “software-plus-managed services” bundles are gaining traction, giving vendors recurring income tied to measurable productivity targets rather than unit shipments. Bentley Systems’ 2024 expansion of its professional-services arm targets precisely this consultative vacuum. In parallel, software publishers embed self-service wizards into their flagship platforms to standardize best practice, but larger owners still prefer white-glove configuration, leaving room for integrators and specialist consultancies. Because implementation engagements often trigger add-on module sales, the service momentum generates a virtuous expansion loop for the AEC software market.
A rising proportion of service revenue comes from digital-twin upkeep, security audits, and AI model retraining, tasks that persist long after the initial project phase concludes. Vendors with credible service depth can negotiate enterprise frameworks that align license renewals to operational performance indices, anchoring clients for multiyear terms. This stickiness curbs churn and underpins valuation multiples for publicly listed platforms. Consequently, private equity investors exhibit growing interest in service-heavy targets as a hedge against potential licensing downcycles once the AEC software industry reaches maturity.


By Deployment: Cloud Momentum Reshapes Market Dynamics
Cloud installations held 59.70% of 2025 spending and are forecast to grow at 10.25% CAGR, eclipsing on-premises setups that persist in heavily regulated asset classes such as defense. Work-from-anywhere norms that crystallized during the 2020–2021 pandemic accelerated SaaS uptake and permanently altered user expectations on version parity and simultaneous editing. Procore’s double-digit revenue expansion in early 2025 illustrates how site managers view browser-based dashboards as integral to day-to-day jobsite control. The incremental shift toward cloud also changes cost structure: instead of lumpy capital purchases, firms accrue predictable monthly fees, smoothing cash-flow forecasting, and freeing capital for other project investments.
Further, cloud data hubs enable real-time IoT sensor ingestion and AI-driven pattern detection, features difficult to replicate in siloed on-premises silos. Governments are gradually certifying SaaS for public contracts, provided vendors meet sovereign-hosting or encryption stipulations, thus eliminating a final barrier to ubiquitous cloud penetration. As legacy license models decline, the proportion of subscription income within the AEC software market size figure will swell, making recurring revenue the dominant trajectory in vendor P&L's by the decade’s close.
By Enterprise Size: SME Growth Challenges Traditional Assumptions
Large enterprises still command 60.40% of spending, yet the SME bracket posts 11.25% CAGR thanks to modular subscription tiers that align cost with project volume. The democratization of advanced capabilities levels the playing field: boutique studios can access the same clash detection or generative-design engines previously restricted to large multidisciplinary firms. Consequently, competition intensifies on mid-scale procurement tenders, prompting larger firms to pursue differentiation through integrated design-build-operate service bundles rather than sheer software firepower. From the vendor standpoint, the move adds thousands of modest-value but sticky accounts, diversifying revenue away from a handful of major renewals that previously dominated the AEC software market.
SMEs also act as early adopters of lightweight, AI-centric innovations because they suffer fewer internal approval layers. Higharc’s USD 53 million fundraise to extend AI-powered residential design serves this niche, giving smaller builders automated code compliance checks and plan-set generation that circumvent the need for large in-house drafting teams. As such, case studies proliferate, incumbent platforms will likely add similar features either through internal R&D or acquisition, ensuring the SME cohort continues to influence the roadmap of the AEC software market.
By Discipline: Construction Segment Gains Momentum
Architecture retained the largest share at 50.00% in 2025, but construction discipline revenues are expanding fastest at an 10.90% CAGR as contractors digitize field coordination, materials tracking, and safety inspections. Site teams increasingly demand 4-D scheduling, drone photogrammetry integration, and sensor-based progress validation, functions seldom required in upstream design tasks. Trimble’s Tekla Structures 2025 launch embeds live collaboration features tailored to rebar detailers and steel fabricators, underlining the vendor's pivot toward execution workflows.
From an owner's perspective, most cost overruns accrue during build rather than design; hence, digital-field adoption promises the most immediate margin upside. This economic logic propels investment in site management tablets, RFID-enabled material inventory, and as-built validation workflows, all feeding the construction slice of the AEC software market size. Over the forecast horizon, analysts expect platform scope to blur between detailing and component prefabrication, as off-site manufacturing methods mandate tighter data feedback loops that merge design and production files within a unified repository.
By Application: Project Management Tools Gain Traction
Design and modeling modules remain indispensable, yet owners now demand visibility over total capital program health, pushing project-management dashboards to 11.10% CAGR. These tools aggregate cost reports, risk registers, and RFI workflows into a single pane, shortening decision latency for executives. The move dovetails with the construction discipline surge, since field data must sync with head-office status boards to unlock schedule compression. Modern dashboards increasingly embed predictive analytics that suggest mitigation strategies, transforming them from passive trackers to proactive decision engines.
In parallel, asset and facility management applications ride the wave of digital-twin adoption. Keppel Bay Tower’s 7% energy saving from a virtual model of HVAC operations exemplifies the business case for post-handover analytics. Facilities teams are growing comfortable with sensor-driven dashboards that forecast equipment failure, which in turn requires that design-phase BIM parameters remain intact during the transition to operations. Software publishers, therefore, invest in long-term schema fidelity to bridge the historic gap between capital project close-out and operational maintenance, a synergy that uplifts the entire AEC software market.
By End-User: Owners Drive Platform Evolution
Design consultancies still hold 51.40% of spending, but owners and developers post an 10.95% CAGR because they want direct control over data that underpins lifecycle cost estimates and sustainability reporting. Large real-estate trusts and infrastructure funds increasingly license core platforms themselves rather than relying solely on consultant access, enabling them to retain digital twins for ongoing performance monitoring. The trend de-commoditizes data ownership and shifts bargaining power toward asset holders, prompting contractors and designers to adopt collaborative cloud spaces dictated by the owner’s software stack.
EPC contractors are following suit, drawn by integrated procurement and fabrication modules that synchronize design updates with vendor quotes. AECOM’s use of end-to-end delivery environments across multiple transport projects improved schedule predictability and helped win incentive fees pegged to on-time completion. These wins set a precedent, nudging peers to replicate the model, thereby enlarging the contractor slice of the AEC software market.
Geography Analysis
North America generated 37.90% of global revenue in 2025 owing to mature BIM mandates, stable public-infrastructure budgets, and deep pools of digitally trained labor. State and federal agencies regularly embed Level of Development requirements into tender packages, making compliance tools non-negotiable. Cloud adoption is comparatively advanced as data-hosting providers meet FedRAMP and DoD IL-4 standards, encouraging municipal owners to switch from on-premises vaults to SaaS repositories without extended waiver processes. Tight labor markets, however, push firms to invest in AI-assisted design to offset staffing shortages, ensuring continuous license expansion even in established organizations.
Asia-Pacific emerges as the fastest-growing region at an 10.70% CAGR through 2031. China’s national push for modular construction techniques calls for firm integration between design software and off-site manufacturing execution, rewarding vendors that support parametric modules readily convertible to CNC code. India’s metro and airport sprees amplify demand for centrally hosted coordination hubs where dozens of subcontractors overlap schedules. Local brands such as PKPM compete through domestic code libraries and Chinese-language support, but international vendors defend share by localizing content packs and forging joint ventures with provincial planning institutes. The region’s SME surge further diversifies client profiles, compelling publishers to offer tiered pricing in local currencies to capture volumes in secondary cities.
Europe maintains a steady mid-single-digit growth trajectory anchored by the EU Green Deal and circular-economy legislation that requires whole-life carbon analysis during permitting. Germany’s Building Energy Act compels energy simulations in new builds, prompting widespread purchase of daylight-analysis and HVAC-sizing modules. Cross-border rail and power-interconnect projects also build momentum for open data exchange, pressuring vendors to enhance Industry Foundation Class support or risk exclusion from EU procurement qualification. While the continent’s market is smaller than North America’s in absolute terms, its regulatory rigor sets interoperability benchmarks that ripple outward to global product roadmaps, influencing feature-set decisions across the entire AEC software market.

Competitive Landscape
The AEC software market features moderate concentration: top names such as Autodesk, Bentley Systems, and Trimble leverage wide portfolios and ecosystem loyalty, yet do not dominate to the extent of outright monopoly. Consolidation remains purposeful; vendors buy niche AI start-ups or sustainability plugins to embed next-gen functions rather than simply rolling up direct rivals. For instance, Bentley’s 2024 alignment with Google Cloud extends geospatial analytics for linear infrastructure without cannibalizing mainline modeling revenue. Such alliances demonstrate an emphasis on additive capability instead of defensive lock-in.
Interoperability pacts are emerging as the critical competitive dimension. The Autodesk–Nemetschek détente signaled a pragmatic turn whereby rivals acknowledge that smoother data flow can expand total addressable spend by removing user frustration. In parallel, midsize players differentiate via depth in specific verticals—Graphisoft in mid-rise residential, Bluebeam in markup workflows, and Vectorworks in landscape architecture. [4]“2025 Product Roadmap,” Graphisoft, graphisoft.com Venture funding into AI-native newcomers like MatX and CONXAI indicates investor belief that unbundled, cloud-first targets can still carve share if they solve pain points faster than incumbents.
Pricing structures, too, are a battleground. The pivot to subscription renders annual renewal negotiations a referendum on delivered value. Vendors add bundled cloud storage, analytics credits, or plugin marketplaces to heighten switching costs without raising headline price. As more countries add antitrust scrutiny around software lock-in, visible cooperation on file standards may appease regulators, sustaining an equilibrium where customers enjoy gradual innovation while vendors protect their margins. Overall, strategic maneuvers suggest a sector consolidating around platform breadth balanced with open API ecosystems, a recipe that keeps rivalry vibrant yet manageable.
AEC Software Industry Leaders
Autodesk Inc.
Nemetschek SE
Trimble Inc.
Bentley Systems Inc.
Oracle Corp. (Aconex)
- *Disclaimer: Major Players sorted in no particular order

Recent Industry Developments
- June 2025: Trimble introduced Tekla Structures 2025 with AI-enhanced fabrication drawing automation and expanded Live Collaboration, underlining its focus on structural software efficiency.
- May 2025: Autodesk rolled out Revit 2026, featuring reality-capture mesh imports and accelerated graphics architecture, responding to user requests for smoother model navigation.
- April 2025: Lumion released Lumion Pro 2025, adding neural-rendering algorithms that deliver photorealistic visuals in near real time, catering to architects’ presentation needs.
- March 2025: Acelab unveiled Materials Hub, an AI-powered library that ranks facade and interior finishes by environmental impact, cost, and lead time, streamlining early-stage specification.
- March 2025: Graphisoft published its 2025 product roadmap featuring Archicad 29 and enhanced BIMcloud, with a public technology preview slated for late summer.
- February 2025: Higharc secured USD 53 million Series B financing to accelerate its AI-driven residential design engine, broadening the reach of generative layouts for small builders.
- January 2025: MatX raised USD 95 million in Series A funding for construction-technology platform development, marking the sector’s largest early-stage round and reinforcing investor interest in cloud-native site automation tools.


Global AEC Software Market Report Scope
AEC software refers to a suite of digital tools designed specifically for the Architecture, Engineering, and Construction (AEC) industry to assist professionals in designing, planning, managing, and executing construction projects. The research also examines underlying growth influencers and significant industry vendors, all of which help to support market estimates and growth rates throughout the anticipated period. The market estimates and projections are based on the base year factors and arrived at top-down and bottom-up approaches.
The AEC software market is segmented by product (Software and Services), deployment (On-premises and Cloud-based), enterprise size (Small and Medium-Sized Enterprises (SMEs) and Large Enterprises), and geography (North America, Europe, Asia Pacific, South America, and Middle East & Africa). The market sizing and forecasts are provided in terms of value (USD) for all the above segments.
| Software |
| Services |
| On-Premises |
| Cloud |
| Small and Medium Enterprises (SMEs) |
| Large Enterprises |
| Architecture |
| Engineering |
| Construction |
| Design and Modelling |
| Project/Construction Management |
| Asset and Facility Management |
| Design-Consultancies |
| EPC Contractors |
| Owners/Developers |
| North America | United States | |
| Canada | ||
| Mexico | ||
| South America | Brazil | |
| Argentina | ||
| Chile | ||
| Rest of South America | ||
| Europe | Germany | |
| United Kingdom | ||
| France | ||
| Italy | ||
| Spain | ||
| Russia | ||
| Rest of Europe | ||
| Asia-Pacific | China | |
| India | ||
| Japan | ||
| South Korea | ||
| Singapore | ||
| Malaysia | ||
| Australia | ||
| Rest of Asia-Pacific | ||
| Middle East and Africa | Middle East | United Arab Emirates |
| Saudi Arabia | ||
| Turkey | ||
| Rest of Middle East | ||
| Africa | South Africa | |
| Nigeria | ||
| Rest of Africa | ||
| By Product | Software | ||
| Services | |||
| By Deployment | On-Premises | ||
| Cloud | |||
| By Enterprise Size | Small and Medium Enterprises (SMEs) | ||
| Large Enterprises | |||
| By Discipline | Architecture | ||
| Engineering | |||
| Construction | |||
| By Application | Design and Modelling | ||
| Project/Construction Management | |||
| Asset and Facility Management | |||
| By End-user | Design-Consultancies | ||
| EPC Contractors | |||
| Owners/Developers | |||
| By Geography | North America | United States | |
| Canada | |||
| Mexico | |||
| South America | Brazil | ||
| Argentina | |||
| Chile | |||
| Rest of South America | |||
| Europe | Germany | ||
| United Kingdom | |||
| France | |||
| Italy | |||
| Spain | |||
| Russia | |||
| Rest of Europe | |||
| Asia-Pacific | China | ||
| India | |||
| Japan | |||
| South Korea | |||
| Singapore | |||
| Malaysia | |||
| Australia | |||
| Rest of Asia-Pacific | |||
| Middle East and Africa | Middle East | United Arab Emirates | |
| Saudi Arabia | |||
| Turkey | |||
| Rest of Middle East | |||
| Africa | South Africa | ||
| Nigeria | |||
| Rest of Africa | |||


Key Questions Answered in the Report
What is the current size of the AEC software market and its growth outlook?
The AEC software market reached USD 12.04 billion in 2026 and is projected to hit USD 17.98 billion by 2031, advancing at an 8.35% CAGR.
Which region is growing fastest for AEC software adoption?
Asia-Pacific records the highest regional CAGR at 10.70% through 2031, fueled by infrastructure spending in emerging megacities and government BIM mandates.
How quickly are cloud deployments overtaking on-premises installations?
Cloud solutions held 59.70% of 2025 revenue and are expanding at a 10.25% CAGR, reflecting owner acceptance of SaaS hosting and subscription economics.
What segment inside the AEC software market is expanding most rapidly?
Project and construction management tools are the fastest-growing application area, posting an 11.10% CAGR as owners seek end-to-end workflow oversight.
Why are services gaining ground despite software’s dominance?
Organizations need configuration, integration, and digital-twin maintenance expertise to capture full value, driving services to an 10.85% CAGR and creating recurring revenue for vendors.
How concentrated is vendor competition?
The top five players command about 55% of spending, producing a moderate concentration score of 6, with interoperability alliances and targeted acquisitions shaping rivalry dynamics.
Page last updated on:


