Advanced Functional Materials Market Size and Share
Market Overview
| Study Period | 2020 - 2031 |
|---|---|
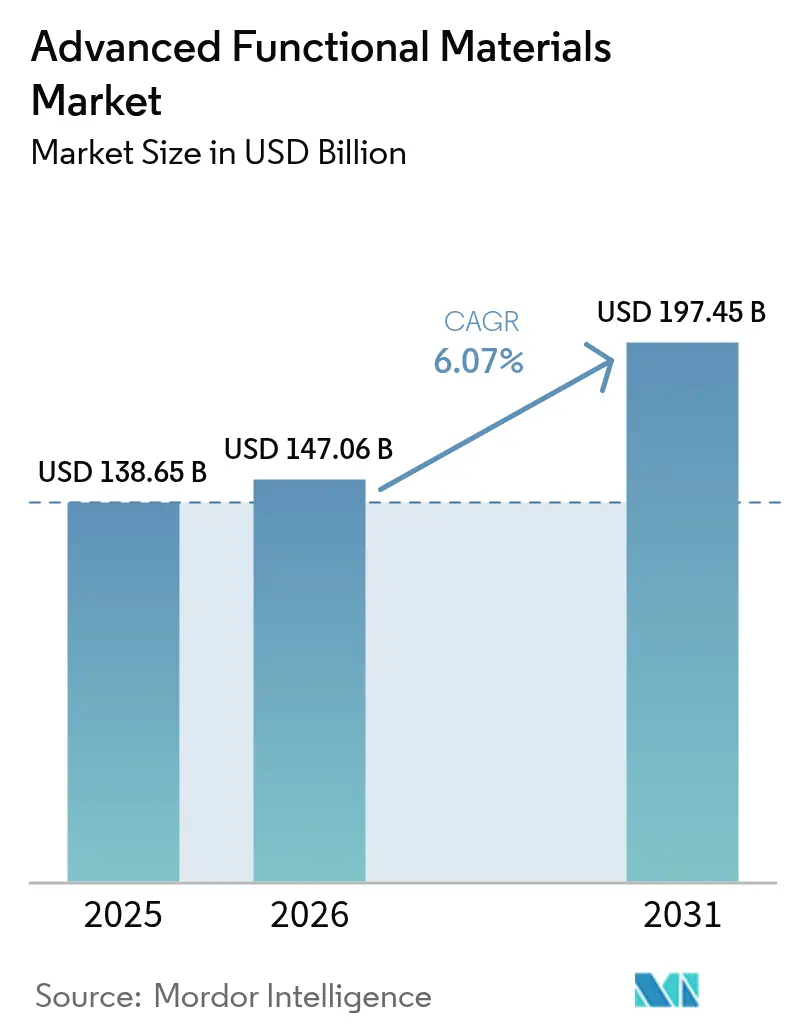
| Market Size (2026) | USD 147.06 Billion |
| Market Size (2031) | USD 197.45 Billion |
| Growth Rate (2026 - 2031) | 6.07% CAGR |
| Fastest Growing Market | Asia Pacific |
| Largest Market | Asia Pacific |
| Market Concentration | Medium |
Major Players *Disclaimer: Major Players sorted in no particular order Image © Mordor Intelligence. Reuse requires attribution under CC BY 4.0. | |
Advanced Functional Materials Market Analysis by Mordor Intelligence
Advanced functional materials market size in 2026 is estimated at USD 147.06 billion, growing from 2025 value of USD 138.65 billion with 2031 projections showing USD 197.45 billion, growing at 6.07% CAGR over 2026-2031. Continuous innovation in electronics, transportation, energy storage, and biomedical devices maintains solid demand even as regulators tighten sustainability norms. Heightened miniaturization requirements in semiconductors, accelerating electric-vehicle adoption, and a global pivot toward renewable energy reinforce resilient order books for producers that can guarantee scale, purity, and traceability. Companies also race to localize critical raw-material supply chains and automate processing lines to offset salary inflation and skilled-labor shortages. Consolidation intensifies as incumbents acquire nanomaterial specialists to secure proprietary chemistries while start-ups target performance gaps in power electronics and solid-state batteries. Supply-chain risk remains the key watchpoint, with firms diversifying sources for rare earths, PFAS substitutes, and battery-grade graphite.
Key Report Takeaways
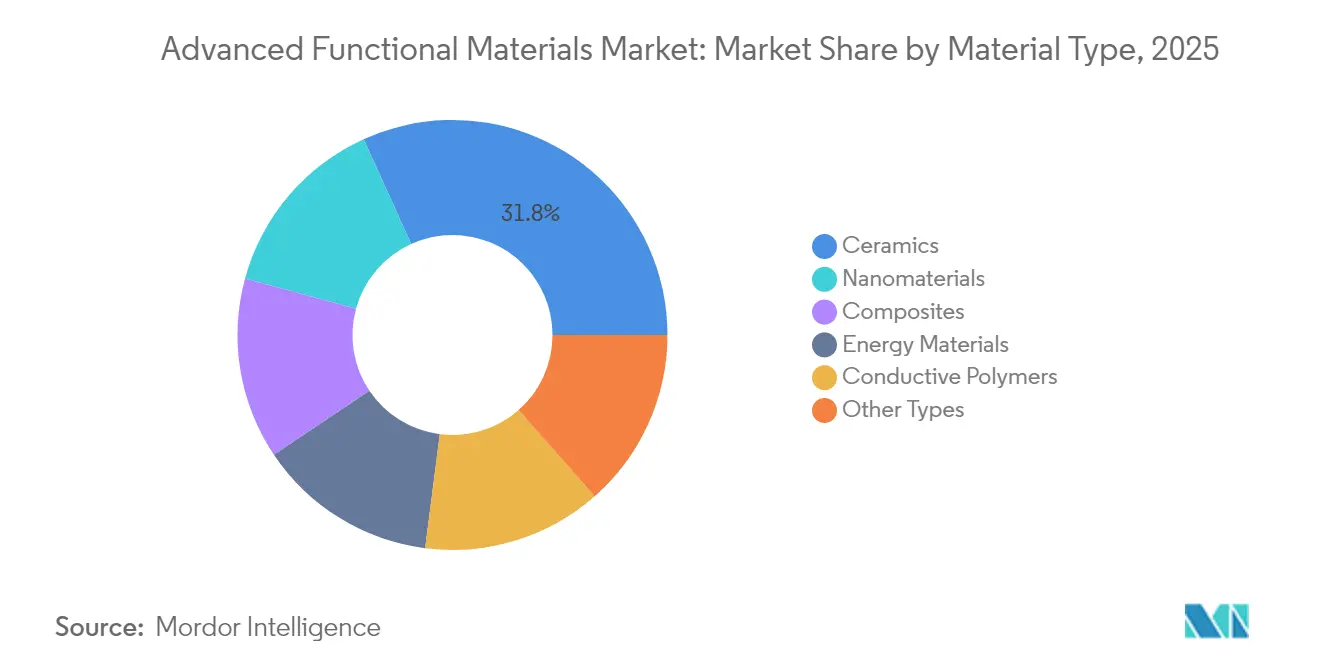
- By material type, ceramics led with 31.78% revenue share of the advanced functional materials market in 2025, while nanomaterials are forecast to expand at a 7.18% CAGR through 2031.
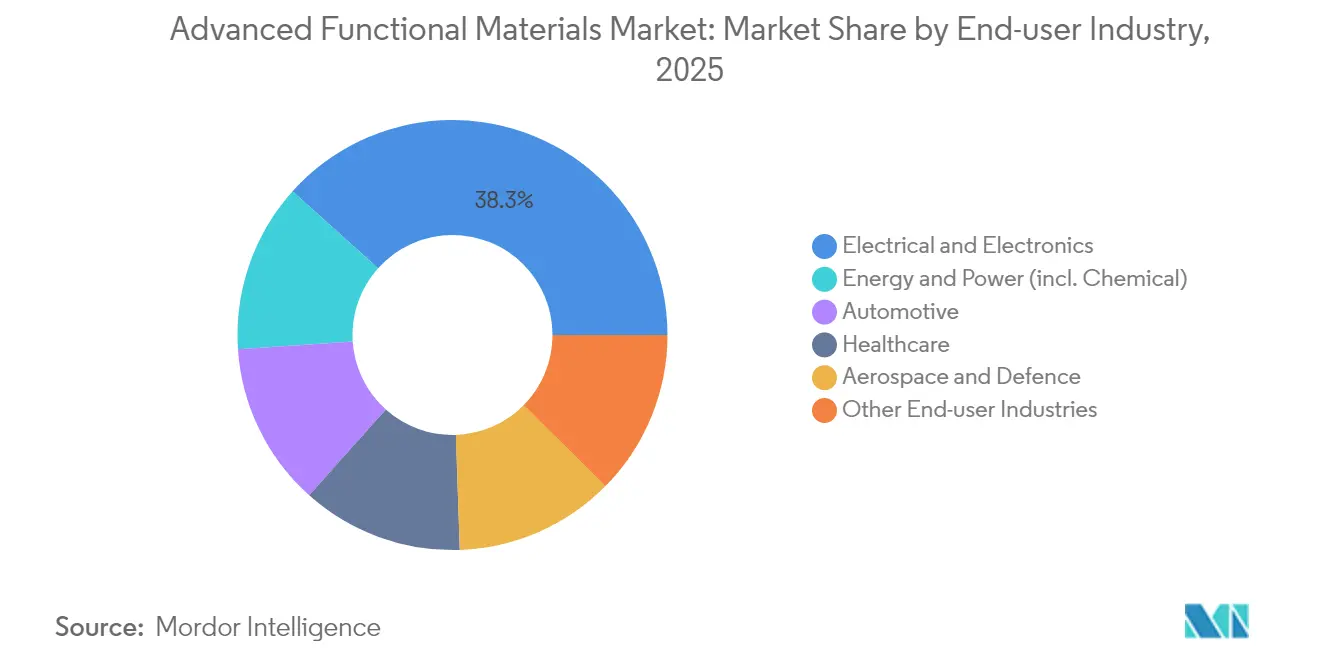
- By end-user industry, the electrical and electronics segment captured 38.35% of the advanced functional materials market size in 2025; energy and power displays the highest projected CAGR at 6.89% between 2026-2031.
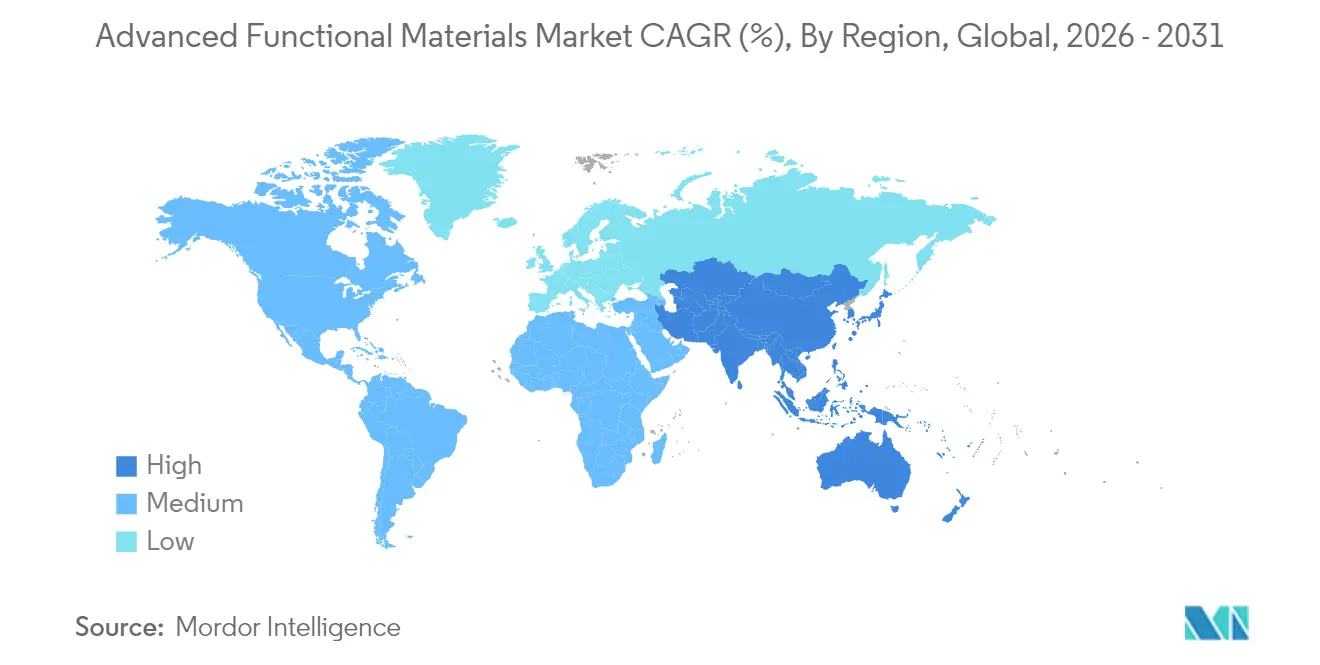
- By geography, Asia-Pacific dominated with 47.62% of the advanced functional materials market share in 2025, and the region is advancing at a 7.03% CAGR to 2031.
Note: Market size and forecast figures in this report are generated using Mordor Intelligence’s proprietary estimation framework, updated with the latest available data and insights as of 2026.
Global Advanced Functional Materials Market Trends and Insights
Drivers Impact Analysis*
| Drivers | (~) % Impact on CAGR Forecast | Geographic Relevance | Impact Timeline |
|---|---|---|---|
| Miniaturisation in consumer electronics | +1.8% | Global, concentrated in Asia-Pacific | Medium term (2-4 years) |
| Lightweighting in automotive and aerospace | +1.5% | North America and Europe, global auto | Long term (≥4 years) |
| Renewable-energy storage and conversion | +1.2% | Global; early uptake in China, Germany, the United States | Long term (≥4 years) |
| Expanding healthcare and biomedical uses | +0.9% | North America and Europe lead | Medium term (2-4 years) |
| Green public procurement mandates | +0.7% | Europe leads; the rest of the world adopting | Short term (≤2 years) |
| Source: Mordor Intelligence | |||
Rising Demand for Miniaturisation in Consumer Electronics
Smartphones, laptops, wearables, and AI edge devices all need thinner interconnects, lower-loss substrates, and conductive pastes that tolerate higher power densities without heat damage. Transparent conducting oxides under development at the University of Minnesota boost electron mobility while letting 90% of visible light pass, pivotal for next-generation OLED and micro-LED displays. Organic electrochemical transistors engineered by the University of Hong Kong integrate machine-learning capability into textile-grade sensors and cut power draw by 80%, which lengthens battery life in medical wearables. MXene sheets now register 35,000 S/cm conductivity and block 99.9% of high-frequency electromagnetic noise, resolving signal-integrity problems inside 5 G handsets and electric vehicles. Collectively, these breakthroughs enlarge design windows for OEMs and reinforce procurement spending on the advanced functional materials market.
Increasing Usage in Automotive and Aerospace for Lightweighting
Automakers and aircraft OEMs target weight cuts that translate directly into range extension and lower lifecycle emissions. Oak Ridge National Laboratory’s nanofiber infusion process lifts carbon-fiber tensile strength by 50% while doubling toughness so that components withstand crash loads and lightning strikes[1]Oak Ridge National Laboratory, “Nanofiber Carbon Fiber Enhancement,” ornl.gov. Hyundai Motor Group and Toray Industries co-develop carbon-fiber-reinforced polymer housings that shed 40 kg from an electric SUV’s battery pack, helping meet a 500 km real-world range goal. Korea Institute of Science and Technology’s high-crystallinity carbon nanotubes replace copper coil windings to raise motor power density by 20%. Shape-memory alloys and piezoelectric actuators improve aerodynamic control surfaces, lowering fuel burn in narrow-body aircraft. United States Department of Energy roadmaps call for 25% lightweighting of light-duty vehicles by 2030, signaling a durable pull for advanced functional materials market suppliers.
Growth of Renewable-Energy Storage and Conversion Solutions
Grid operators worldwide add variable solar and wind assets, raising demand for long-duration storage that relies on novel chemistries. Monash University’s trimodal thermal-storage blocks hold 600 MJ/m³, doubling incumbent salts and enabling 20-hour Carnot battery discharge. Manganese-oxide/graphene superlattices produced by the University of Manchester sustain 5,000 zinc-ion cycles with no dendrite growth, an attractive substitute for lithium in stationary storage. Sodium vanadium phosphate cathodes deliver 15% higher energy density yet use earth-abundant feedstocks, easing critical-mineral pressure. Space-charge layers discovered at the University of Texas at Dallas speed lithium-ion flux twofold in solid-state cells, a leap valued by makers of drones and heavy-duty trucks. These advances underpin a 7.05% CAGR for the energy and power slice inside the advanced functional materials market between 2025-2030.
Expanding Healthcare and Biomedical Applications
Bismuth-based hybrid scintillators detect X-ray doses 50 times lower than commercial panels, supporting ultra-low-dose paediatric imaging. Thermogels from Pennsylvania State University flow through 25-gauge needles then solidify at 37 °C, forming drug depots that release actives for four weeks and halve surgical interventions. Hierarchical nanofiber patches bond to wet tissue with 3 N/cm² strength and suppress 99% of common pathogens, trimming infection risk in chronic wounds. MXene coatings act as highly sensitive ECG electrodes yet stay stable through 10,000 bend cycles, opening prospects for flexible cardiac monitors. Medical OEMs, therefore, look to lock in multi-year contracts, adding steady throughput for participants in the advanced functional materials market.
Restraints Impact Analysis*
| Restraints | (~) % Impact on CAGR Forecast | Geographic Relevance | Impact Timeline |
|---|---|---|---|
| High production cost and raw-material scarcity | −1.4% | Global, China-centric supply chains are most exposed | Short term (≤2 years) |
| Complex, evolving regulatory compliance | −0.8% | Europe most stringent | Medium term (2-4 years) |
| Skilled-labour bottlenecks | −0.6% | North America and Europe most affected | Long term (≥4 years) |
| Source: Mordor Intelligence | |||
High Production Costs and Critical Raw Material Scarcity
International Energy Agency models show demand for rare-earth oxides rising to 169 kt by 2040 while 77% of refining capacity remains in one country, prompting price jumps that hurt margin targets for magnets, phosphors, and battery additives[2]International Energy Agency, “Global Critical Minerals Outlook 2025,” iea.org. The United States Department of Homeland Security flags regulatory overlap that delays new mines by up to eight years, creating a mismatch between offtake agreements and feedstock availability. Europe’s Critical Raw Materials Act covers 34 elements and imposes recycling quotas many smelters cannot yet meet, compelling producers to redesign formulations or pay penalties. Spot energy prices above USD 80/MWh in several OECD economies also squeeze ceramic-kiln operators whose firing steps need 1,600 °C, adding cost pressures.
Complex, Evolving Regulatory Compliance
The 2025 revision of REACH bans full PFAS use in consumer products and introduces 10-year dossier renewal plus Digital Product Passports, lifting documentation overhead by 25% for mid-size formulators. Polymer registrants now must submit low-molecular-weight fraction data and non-animal toxicity models, pushing developers to invest in predictive software and analytical platforms. The Net-Zero Industry Act sets tight lead-time targets: permitting for clean-tech plants cannot exceed 18 months, forcing applicants to align construction, EHS, and circularity plans upfront. Small enterprises report compliance teams equal to 8% of headcount, while multinationals automate SDS authoring through cloud tools but still earmark USD 20 million annually for audits.
*Our forecasts treat driver/restraint impacts as directional, not additive. The impact forecasts reflect baseline growth, mix effects, and variable interactions.
Segment Analysis
By Material Type: Ceramics Leadership Challenged by Nanomaterials Innovation
Ceramics commanded 31.78% of 2025 revenue within the advanced functional materials market on the back of aerospace engine linings, 5 G filters, and implantable bioceramics. Nanomaterials, however, headline growth at 7.18%, supported by ongoing capital expansion at MXene, graphene, and carbon-nanotube fabs. Ultra-high-temperature ceramics such as hafnium carbide tolerate 4,000 °C re-entry heat, enabling hypersonic gliders that were previously infeasible. Ceramic-matrix composites from GE Aerospace run 300 °C hotter than nickel alloys, raising jet-engine fuel efficiency by 2% and saving airlines USD 1 million per twin-aisle unit over the life cycle.
Composites and conductive polymers maintain respectable pipelines. Golden polyaniline films from the University of Tsukuba reach metal-like luster yet keep polymer flexibility, a boon for foldable screens. Two-dimensional polymer sheets with 10 S/cm in-plane conductivity supply electromagnetic shielding inside data-center racks. These expansions diversify the portfolio and strengthen supplier bargaining power in the advanced functional materials market size for high-frequency applications.


By End-User Industry: Electronics Dominance Faces Energy Sector Acceleration
The electrical and electronics domain held 38.35% of 2025 sales, anchored by semiconductor packaging, multilayer ceramic capacitors, and heat-spreaders. Annual wafer-fab expansions in East Asia sustain alumina substrate and photoresist polymer demand, while the consumer-device cycle recovers after earlier inventory burn-off. The energy and power category is reacting fastest, with a 6.89%. Sodium-ion, zinc-air, and solid-state lithium cells require different separator chemistries, prompting broad qualification programs at gigafactories in China, India, and the United States.
Automotive electrification remains decisive. A midsize battery electric car embeds 200 kg of engineered polymers, silicone gap-fillers, and SiC die attaches, versus 40 kg in an internal-combustion model, solidifying procurement pipelines through 2030. Aerospace and defense spending on ceramic radomes, stealth coatings, and high-entropy-alloy turbine parts offsets slower growth in civil construction. The net result is a balanced yet dynamic customer mix that tempers cyclicality in the advanced functional materials industry.
Geography Analysis
Asia-Pacific generated 47.62% of 2025 turnover and is expanding at 7.03% CAGR thanks to policy incentives, deep manufacturing clusters, and raw-material access. China’s 14th Five-Year Plan funnels USD 28 billion into specialty materials, while Japan issues GX Economy Transition Bonds to subsidize net-zero process upgrades. These programs shorten scale-up cycles and place local firms at the center of the advanced functional materials market.
North America leverages the CHIPS and Science Act, a USD 52.7 billion package that mandates domestic content thresholds for critical substrates and encapsulants. Canada advances cathode-grade nickel and cobalt refining, while Mexico attracts EV assembly nearshoring, anchoring regional supply chains.
Europe couples the Net-Zero Industry Act with PFAS curbs, motivating incumbents to substitute fluoro-elastomers with silicone and thermoplastic olefin blends.

Regulatory Landscape
In the European Union, advanced functional materials suppliers face tighter chemicals compliance alongside new industrial-policy initiatives. The REACH framework (consolidated as of October 2025) and related sustainability documentation requirements increase testing and reporting burdens for formulated polymers, nanomaterials, and specialty additives used in electronics, mobility, and healthcare supply chains. In parallel, the EU introduced Regulation (EU) 2025/2455 to establish an observatory and data transparency mechanism for advanced materials and innovative chemicals.
Policy is also moving toward a more structured EU framework for advanced materials: the European Commission targets an Advanced Materials Act by end-2026. In March 2026, it adopted a strengthened Safe and Sustainable by Design (SSbD) framework as a voluntary life-cycle methodology that guides how companies structure R&D and qualification dossiers. In the United States, compliance for defense-linked materials is tightening under the FY 2026 National Defense Authorization Act (signed December 2025) and related DFARS timelines, strengthening origin traceability requirements for covered materials through the 2026 to 2027 transition window.
Value Chain Analysis
The advanced functional materials value chain spans critical mineral extraction and specialty monomer and feedstock production, through purification, synthesis, and compounding (ceramics powders, conductive polymers, nanomaterials, battery binders, and composite intermediates), and then into semi-finished forms such as films, substrates, fibers, coatings, and pastes. OEM qualification follows across semiconductors, EVs, energy storage, aerospace, and medical devices. Midstream processing remains the primary bottleneck because performance depends on purity, particle size distribution, and contamination control. Downstream qualification cycles also lock in specifications that are difficult to transfer across regions.
Supply concentration and regional chokepoints continue to shape sourcing strategies, which pushes some suppliers toward more vertical integration and non-China alternatives for rare earths, graphite, and tungsten. 2026 examples include Solvay signing an LOI with Viridis Mining and Minerals to secure Brazilian rare earth feedstocks for processing at its La Rochelle facility (targeting industrial-scale separation of dysprosium and terbium by September 2026), REalloys and JS Link signing a non-binding LOI to develop a fully integrated North American rare earth magnet platform, and CATL partnering with CarbonScape to scale bio-based graphite materials for anodes. These steps sit alongside broader policy-driven resilience efforts and raise the value of traceability, qualification support, and regional processing capacity as differentiators.
Competitive Landscape
The market is moderately fragmented. Incumbent chemicals majors keep multi-decade positions yet face nimble entrants. 3M joined the US-JOINT consortium to co-design ceramic substrates for advanced chiplets, reinforcing relevance in post-Moore architectures. Competition hinges on IP, secure feedstocks, and low-carbon credentials across the advanced functional materials market.
Advanced Functional Materials Industry Leaders
3M
Covestro AG
Arkema
BASF
Kyocera Corporation
- *Disclaimer: Major Players sorted in no particular order

Market Opportunities and Future Outlook
Battery and electrification value chains continue to expand whitespace for high-performance fluoropolymers, ceramic-coated separator binders, and specialty intermediates that support safety and manufacturability. Arkema started up a 15% PVDF expansion in North America at Calvert City, Kentucky in June 2026. It also announced a 20% Kynar PVDF capacity expansion at Changshu, China (scheduled for 2028 startup), highlighting ongoing localization of key materials used in lithium-ion batteries, wire and cable, and industrial coatings. On the specialty chemicals side, Evonik inaugurated expanded specialty amine production capacity in Nanjing in April 2026 to supply polyurethane and epoxy applications, supporting demand for formulated systems used in electronics encapsulation, adhesives, and composites.
A second opportunity area is lower-carbon, compliance-ready materials development that aligns with the EU direction on safe and sustainable design and industrial leadership. The European Commission is advancing the Advanced Materials Act initiative toward end-2026, alongside implementation actions such as innovation procurement for advanced materials, which gives suppliers a clearer route to sell life-cycle performance documentation and data-rich dossiers. At the same time, integrated manufacturing and infrastructure investments, including BASF inaugurating its Zhanjiang Verbund site in March 2026 (with an e-drive steam cracker featuring 1 million ton ethylene capacity powered by 100% renewable energy), reinforce scale-production momentum with reduced carbon intensity. That tends to benefit downstream producers of high-performance polymers, coatings, and composite matrices that rely on consistent regional feedstock supply.
Recent Industry Developments
- July 2026: 3M and Microsoft announced a strategic partnership to deploy 3M Expanded Beam Optical (EBO) connectivity in Microsoft Azure cloud and AI data center infrastructure. The collaboration links materials and interconnect innovation with hyperscale deployment needs, supporting demand pull for high-reliability optical connectivity components used in dense computing environments.
- December 2025: Covestro closed its EUR 1.17 billion strategic partnership with XRG P.J.S.C. The completed transaction supports portfolio and capability moves in specialty materials, with implications for investment capacity and supply positioning in higher-value advanced materials applications. It also signals Covestro's intent to strengthen regional partnerships and secure long-term feedstock and processing capacity in key markets.
- March 2024: Toray Industries unveiled an ion-conductive polymer membrane delivering 10-fold higher conductivity than previous grades, targeting solid-state and air-battery platforms. The performance step-up raises the bar for electrolyte and separator material qualification, increasing competitive pressure on polymer and membrane suppliers serving next-generation energy storage.


Research Methodology Framework and Report Scope
Market Definition and Coverage
For this study, the advanced functional materials market is the revenue generated from engineered materials that are bought mainly for performance functions like electrical, thermal, optical, or barrier behavior, and then used across electronics, mobility, energy, healthcare, and aerospace supply chains.
Scope exclusions: Commodity grade bulk polymers and standard structural metals are excluded, even when they are used in demanding industrial applications.
Segmentation Overview
- By Material Type
- Ceramics
- Composites
- Conductive Polymers
- Nanomaterials
- Energy Materials
- Other Types
- By End-user Industry
- Electrical and Electronics
- Automotive
- Healthcare
- Aerospace and Defence
- Energy and Power (incl. Chemical)
- Other End-user Industries
- By Geography
- Asia-Pacific
- China
- India
- Japan
- South Korea
- Rest of Asia-Pacific
- North America
- United States
- Canada
- Mexico
- Europe
- Germany
- United Kingdom
- France
- Italy
- Rest of Europe
- South America
- Brazil
- Argentina
- Rest of South America
- Middle-East and Africa
- Saudi Arabia
- South Africa
- Rest of Middle-East and Africa
- Asia-Pacific
Data Sources, Market Sizing, and Validation
Desk Research
Desk work was used to set the boundaries of what counts as an advanced functional material, and to build the first set of demand signals by end use. We relied on public sources such as UN Comtrade trade flows, USGS mineral and materials statistics, IEA energy and battery-related indicators, OECD industry indicators, and standards or publications from relevant technical associations.
Company annual reports, investor decks, and press releases were then used to understand product positioning, pricing direction, and where volume is getting added or removed. In a few cases, subscription tools for company financials, patent databases, and shipment level import-export records were used to cross-check directionally where public data was thin, especially for newer materials where naming is inconsistent. The sources listed here are illustrative only, and many other public documents and data points were also used for collection, validation, and clarification.
Primary Interviews and Surveys
Primary discussions helped us pressure test the desk assumptions on adoption timing, pricing movement, and the practical definition of functional versus structural use. We spoke with material producers, distributors, and downstream buyers, then used feedback from engineering, procurement, and product leaders across APAC, EMEA, and the Americas to confirm which application pools are realistically monetized today.
Distribution of primary research fieldwork respondents
| Company type | Respondent position | Region |
|---|---|---|
| Top tier: 33% | CXOs: 17% | APAC: 39% |
| Mid tier: 45% | Functional/Unit leaders: 40% | EMEA: 36% |
| Smaller Players: 22% | Managers: 43% | Americas: 25% |
Market-Sizing & Forecasting
Sizing starts with a top-down build where end market activity is translated into a revenue pool using observable demand anchors, and the main totals arrive after those anchors are filtered through material intensity and adoption rates. In practice, we track indicators such as semiconductor and electronics output trends, EV and battery manufacturing momentum, aerospace and defense production signals, medical device demand direction, and trade movement for key material families.
After that, the totals are checked using selective bottom-up approximations, such as sampled volume times average selling price (ASP) in priority applications, distributor channel feedback, and a limited roll up of supplier revenue where reporting is clear. When data gaps appear for smaller or emerging sub-areas, we don't force false precision, and instead use conservative penetration ranges that were validated through interviews.
For forecasting, scenario analysis is used around two or three demand variables that move the most, and then pricing is modeled with an ASP progression logic that reflects mix shift, input cost direction, and the pace of qualification in end use. Those short steps keep the model repeatable, and it also makes it easier to explain why a forecast changes when one driver changes.
Data Validation & Update Cycle
Outputs are validated by checking if the implied volumes and prices look reasonable against independent signals like trade values, production indicators, and publicly stated capacity or investment timelines. When a variance is large, we trace it back to the input that caused it, and then re-check the definition and the conversion assumptions before it is accepted.
A second analyst review is done to confirm that totals reconcile across regions and major end uses, followed by a final pass for arithmetic, unit consistency, and currency handling. Reports are refreshed annually, and interim updates are triggered when material events occur, such as sharp input price changes, major capacity additions, or regulation-led substitutions. Before delivery, the full model is re-opened so the latest public updates are reflected in the final numbers.
Mordor Intelligence's Advanced Functional Materials Market Size Measured Against Other Published Estimates
Published market sizes for advanced functional materials often do not match because the definition line is drawn differently, and because price conversion timing and update cycles are not always aligned to the same point in time. Even when the material list sounds similar, the total can move just from how ASPs are carried forward and how mixed-use materials are treated.
In this work, the refresh point and currency timing are kept consistent across the model, and ASP progression is re-checked using interview feedback and public signals, which helps explain why Mordor Intelligence reports USD 138.65 B (2025) while some other figures land above or below it.
Benchmark comparison
| Source | Market Size | Gaps in Research Methodology |
|---|---|---|
| Mordor Intelligence | USD 138.65 B (2025) | |
| Industry Publisher A | USD 159.80 B (2025) | Uses a wider definition that explicitly pulls in a broader set of technology materials (including items like semiconductors and light-emitting materials as categories), which can inflate totals beyond materials sold as functional inputs. |
| Industry Publisher B | USD 133.50 B (2025) | Applies stricter exclusions around low-volume and research-grade materials and may apply a more conservative ASP carry-forward for newer applications, which reduces the counted revenue base. |
The spread mainly comes from scope boundaries and from how price and currency timing are handled in the base year. By keeping the demand pool tied to clear end-use signals and then validating pricing movement during updates, our estimate stays traceable and easier to reconcile when clients review assumptions.


Key Questions Answered in the Report
What is the size of the advanced functional materials market in 2026?
The market is valued at USD 147.06 billion in 2026, with a forecast to reach USD 197.45 billion by 2031.
Which geographic region leads demand?
Asia-Pacific accounts for 47.62% of 2025 revenue and shows the fastest 7.03% CAGR through 2031.
Which material segment grows the quickest?
Nanomaterials post the highest 7.18% CAGR thanks to battery, sensor and biomedical breakthroughs.
What end-use industry represents the largest share?
Electrical and electronics applications represent 38.35% of sales, driven by semiconductors and smart devices.
How do regulations influence the market?
Stricter EU REACH rules and global PFAS bans raise compliance costs and accelerate reformulation toward greener chemistries.
Page last updated on:


