Admission Management Software Market Size and Share
Market Overview
| Study Period | 2020 - 2031 |
|---|---|
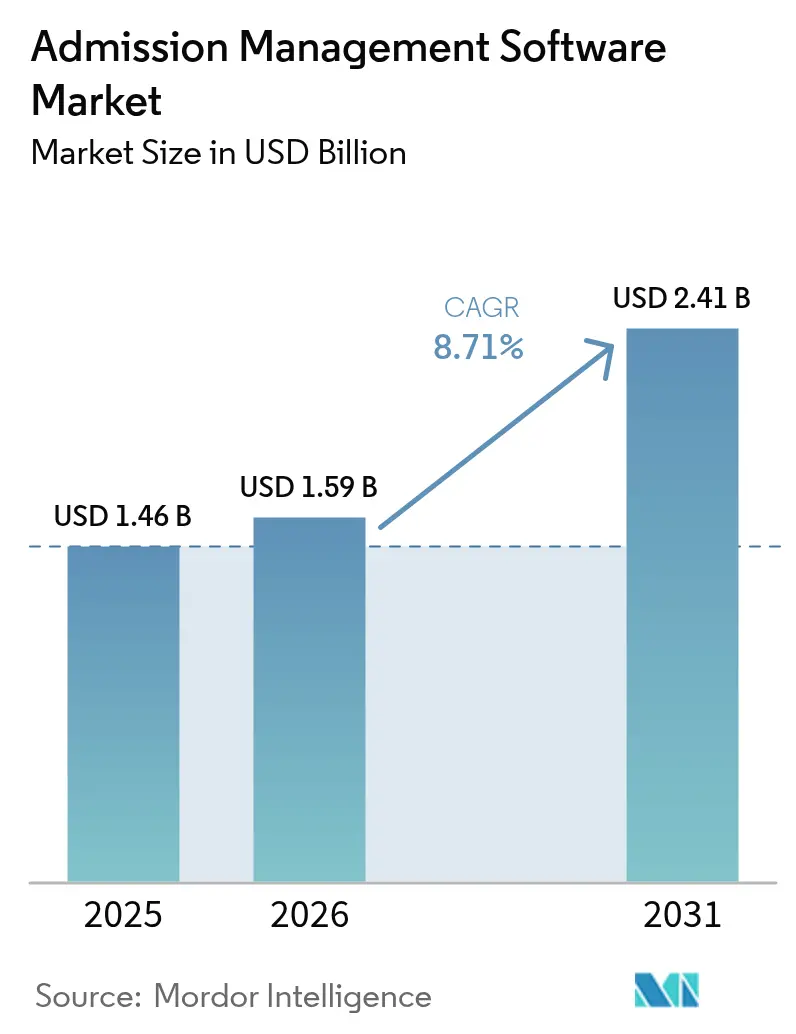
| Market Size (2026) | USD 1.59 Billion |
| Market Size (2031) | USD 2.41 Billion |
| Growth Rate (2026 - 2031) | 8.71% CAGR |
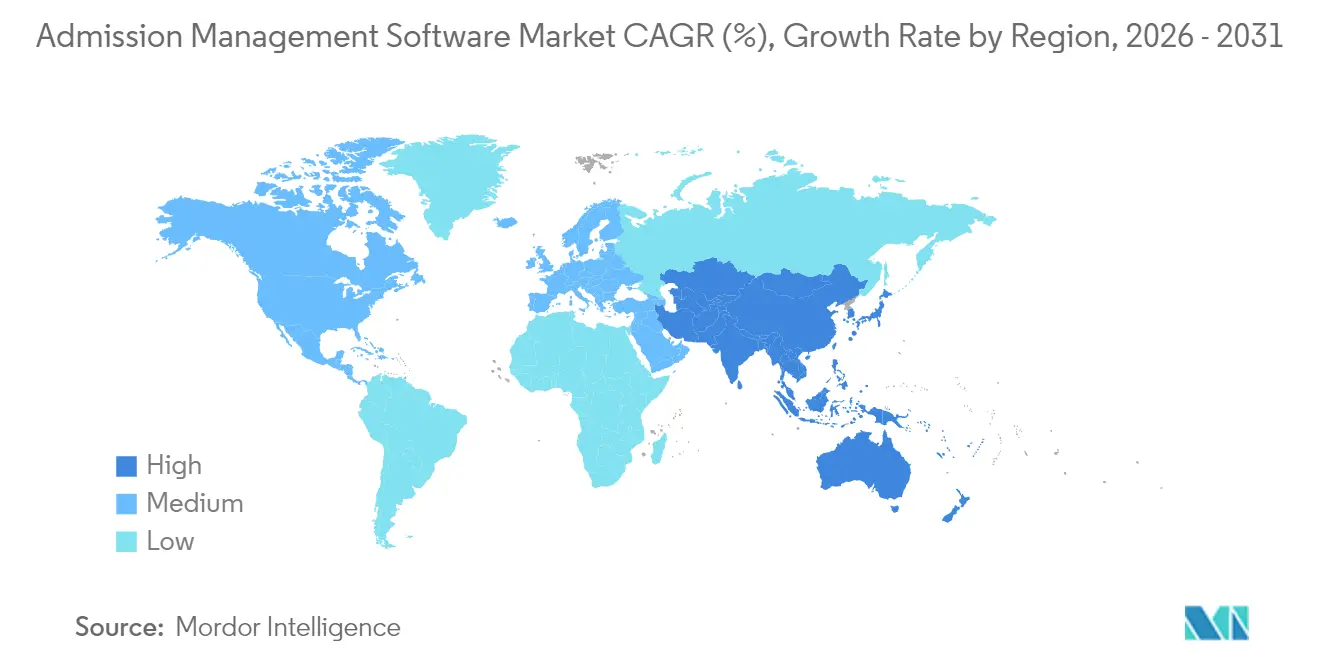
| Fastest Growing Market | Asia Pacific |
| Largest Market | North America |
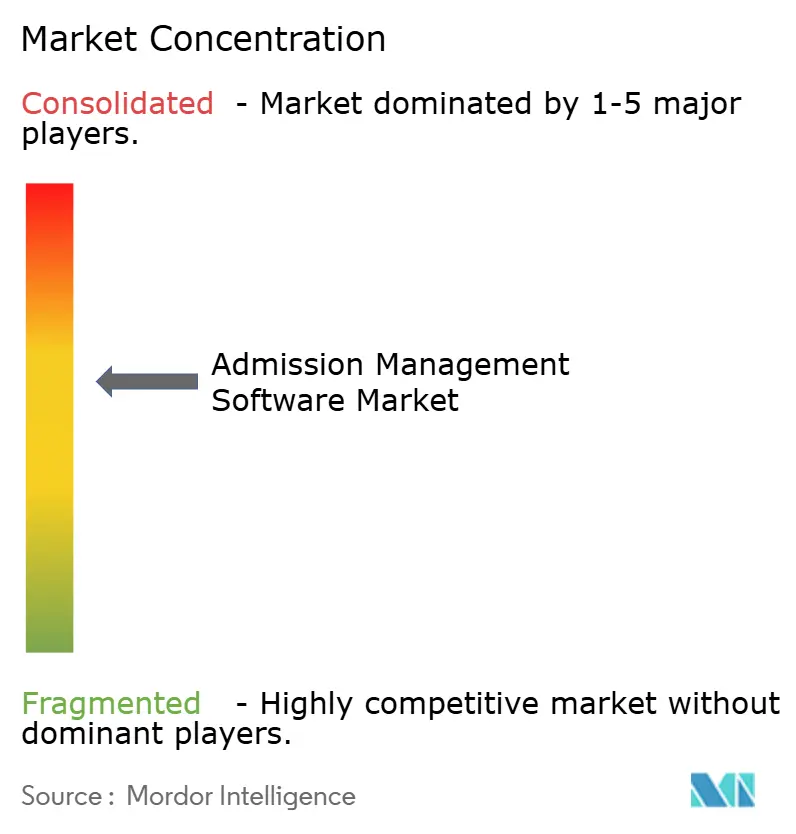
| Market Concentration | Medium |
Major Players *Disclaimer: Major Players sorted in no particular order Image © Mordor Intelligence. Reuse requires attribution under CC BY 4.0. | |
Admission Management Software Market Analysis by Mordor Intelligence
The admission management software market size was valued at USD 1.46 billion in 2025 and estimated to grow from USD 1.59 billion in 2026 to reach USD 2.41 billion by 2031, at a CAGR of 8.71% during the forecast period (2026-2031). The market’s fast rise mirrors the shift from third-party cookies to first-party data, the race for real-time funnel insights, and cloud cost efficiencies that make large-scale click-stream ingestion affordable. Retail and e-commerce platforms are leading adopters because incremental conversion gains translate directly into revenue, while privacy regulations are prompting enterprises to modernize data-collection mechanisms. Intense competition is emerging between full-stack vendors that bundle analytics with broader cloud portfolios and specialist vendors focused on richer behavioural insights. The admission management software market is also shaped by talent shortages in event-stream engineering, pushing demand for managed services and low-code integration tools.
Key Report Takeaways
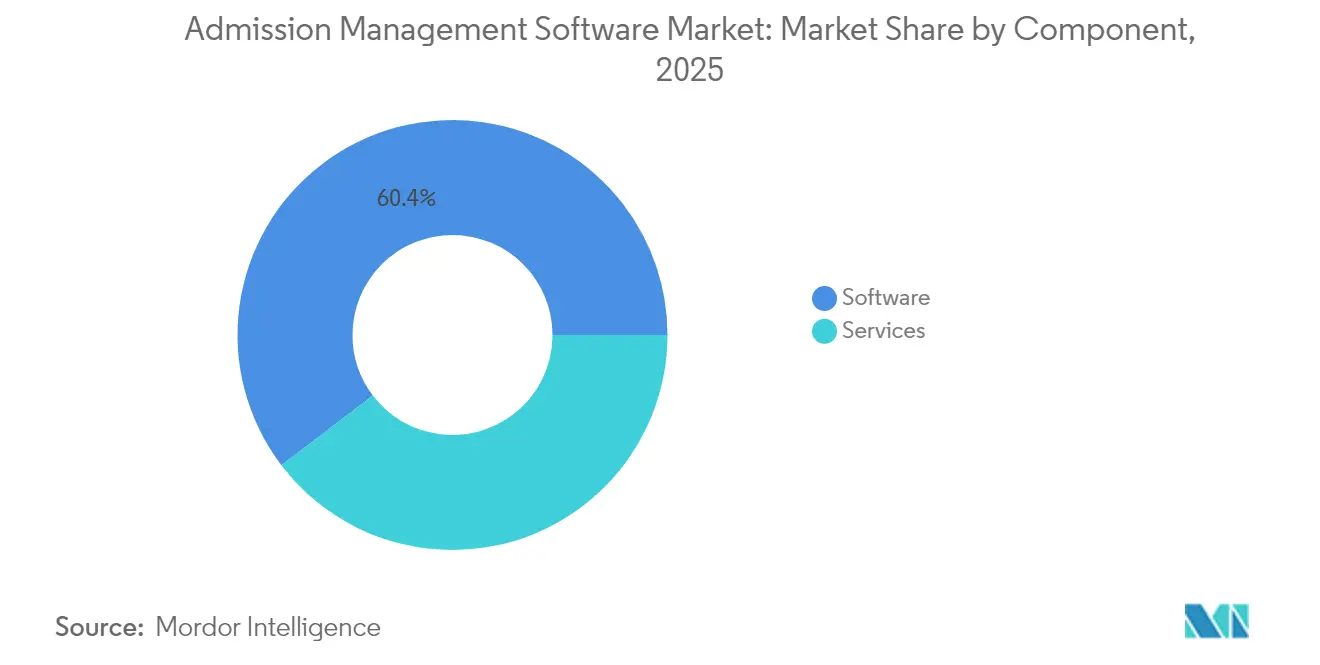
- By component, software led with 60.35% of the admission management software market share in 2025; services are on track for the fastest 13.05% CAGR to 2031.
- By deployment mode, the cloud segment accounted for 67.75% share of the admission management software market size in 2025 and is expanding at a 14.02% CAGR.
- By application, click path and website optimization held 38.10% revenue share in 2025, while customer analysis is advancing at 15.02% CAGR through 2031.
- By industry vertical, retail and e-commerce commanded 23.85% of the admission management software market size in 2025.
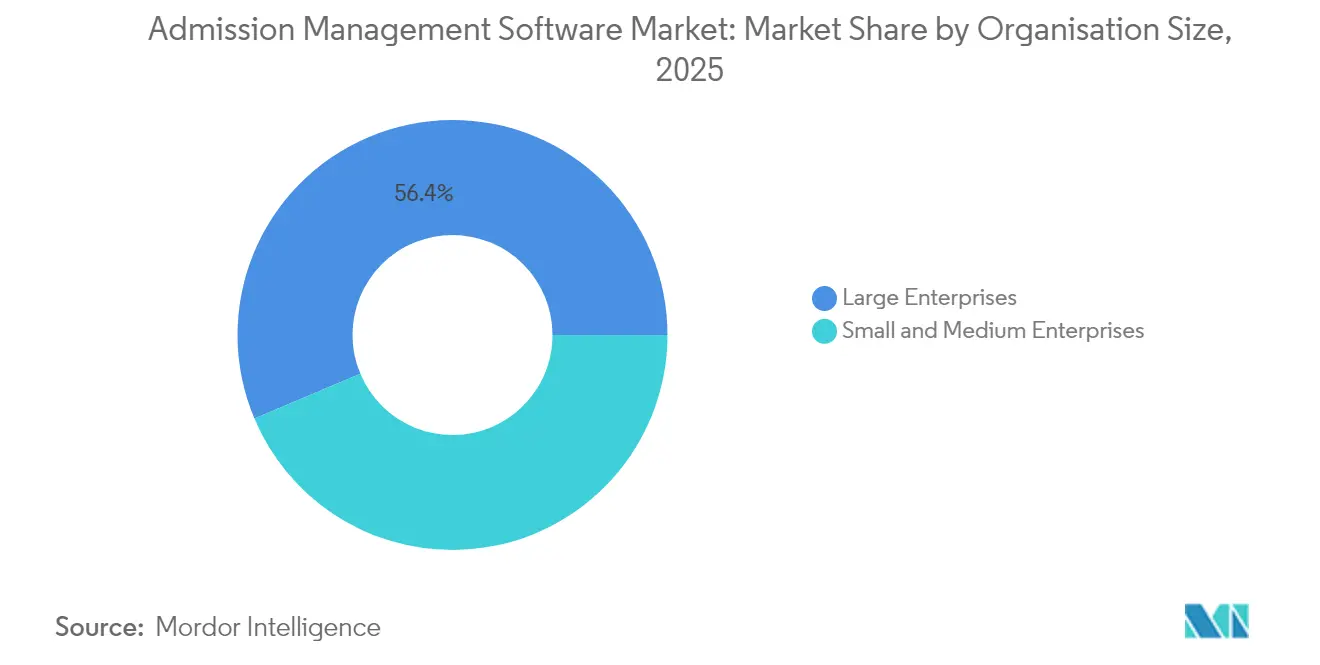
- By organization size, large enterprises controlled 56.35% share in 2025, whereas small and medium enterprises exhibit a 13.76% CAGR.
- By geography, North America captured 41.10% of 2025 revenue; Asia-Pacific is poised for a 15.38% CAGR through 2031.
Note: Market size and forecast figures in this report are generated using Mordor Intelligence’s proprietary estimation framework, updated with the latest available data and insights as of 2026.
Global Admission Management Software Market Trends and Insights
Drivers Impact Analysis*
| Driver | (~) % Impact on CAGR Forecast | Geographic Relevance | Impact Timeline |
|---|---|---|---|
| Phasing-out of third-party cookies | +2.1% | North America and EU lead, global spillover | Medium term (2-4 years) |
| Real-time personalisation for e-commerce | +1.8% | North America, APAC hubs | Short term (≤ 2 years) |
| Cloud cost efficiency for click-stream data | +1.4% | Global, pronounced in emerging markets | Medium term (2-4 years) |
| Digital-marketing ROI pressure | +1.2% | Primarily North America and EU | Short term (≤ 2 years) |
| Edge browser analytics (Wasm) | +0.9% | EU and California first movers | Long term (≥ 4 years) |
| Retail-media network monetisation | +0.8% | North America dominant, expanding to Europe and APAC | Medium term (2-4 years) |
| Source: Mordor Intelligence | |||
Phasing-out of third-party cookies fuels first-party analytics
Google’s shifting cookie-deprecation schedule created a sense of urgency rather than relief. Enterprises that invested early in cookieless pipelines now highlight stronger consent compliance and richer first-party datasets, prompting competitors to accelerate similar upgrades. Vendors are embedding Privacy Sandbox workflows and customer data platforms into the admission management software market, enabling unified profiles across web, mobile and owned media. Early adopters anticipate smoother transitions as regulatory scrutiny intensifies.
E-commerce push for real-time personalization and conversion lift
Personalisation has become table stakes. Retailers report sales uplifts of about 20% when product recommendations react instantly to clicks, driving heavy demand for streaming analytics and low-latency decision engines. The admission management software market benefits because point-and-click tooling lets marketers launch dynamic offers without deep coding skills, while machine learning models surface next-best actions within milliseconds of each interaction.
Cloud cost efficiency enables massive click-data ingestion
Hyperscalers now offer consumption-based pricing tuned for stream processing, lowering unit costs for ingesting terabytes of event data. Mid-market firms that once settled for sampled datasets can afford full-fidelity tracking, unlocking granular behavioural insights. This cost shift underpins the admission management software market’s migration away from on-premises builds toward elastic, pay-as-you-go architectures that auto-scale with campaign peaks.
Digital-marketing ROI pressure drives journey analytics
With budgets scrutinised, marketers need proof that a given touchpoint produced incremental revenue. Cross-channel attribution stitched together by the admission management software market correlates spend to sales in near real time, guiding budget reallocations toward high-yield segments. Platforms integrate visual dashboards that translate complex pathing data into straightforward “what worked” narratives for executives.
Restraints Impact Analysis*
| Restraint | (~) % Impact on CAGR Forecast | Geographic Relevance | Impact Timeline |
|---|---|---|---|
| Global privacy regulations | -1.6% | EU and California lead, worldwide adoption | Short term (≤ 2 years) |
| Integration complexity across tech stacks | -1.2% | Enterprise deployments worldwide | Medium term (2-4 years) |
| Browser anti-tracking (ITP, ETP) | -0.8% | Safari and Firefox user bases | Short term (≤ 2 years) |
| Scarcity of event-stream engineering talent | -0.7% | Most acute in North America and EU | Long term (≥ 4 years) |
| Source: Mordor Intelligence | |||
Global privacy regulations tighten data collection
Nineteen US states added stricter consent mandates in 2025, while GDPR fines rose, forcing analytics pipelines to reduce personally identifiable data. Vendors that bundle automated consent management within the admission management software market gain favour, yet privacy filters remove some behavioural detail, limiting model accuracy and restraining overall CAGR.
Integration complexity across streaming stacks
Enterprises juggle legacy web-analytics tags, CRM data, and mobile SDKs. Harmonising schemas in real time requires scarce specialists adept at Kafka, Snowflake and micro-batch ETL tooling. Delayed implementations slow procurement cycles, though pre-built connectors and no-code transformation layers are easing the barrier.
*Our forecasts treat driver/restraint impacts as directional, not additive. The impact forecasts reflect baseline growth, mix effects, and variable interactions.
Segment Analysis
By Component: Services close the gap on software
The software segment held 60.35% of admission management software market share in 2025, underscoring the primacy of platforms that map every click to revenue outcomes. Yet services revenue is rising at a 13.05% CAGR because enterprises need hands-on help aligning data governance, privacy and machine-learning models with business goals. The admission management software market relies on integrators to orchestrate complex hybrid cloud topologies and fine-tune user-journey dashboards.
A second growth driver is changing management. Large rollouts often fail when end-users cannot interpret new metrics. Advisory partners therefore bundle enablement workshops, experimentation playbooks, and continuous optimisation audits. As privacy rules evolve, recurring compliance assessments expand services billings, narrowing the gap with pure-play licences.


By Deployment Mode: Cloud cements supremacy
Cloud deployments captured 67.75% of admission management software market size in 2025 and are scaling at a 14.02% CAGR. Elastic compute absorbs traffic surges during seasonal campaigns, while managed security controls help satisfy emerging cross-border data regulations. Real-time AI features—such as automated anomaly flags—tend to launch first on SaaS editions, further accelerating cloud preference.
On-premises persists in sectors with strict data-sovereignty clauses, but most of these organisations are introducing hybrid patterns that keep sensitive identifiers inside the firewall yet stream event aggregates to cloud analytics engines. Over the forecast window, existing licence renewals increasingly convert to SaaS, reinforcing the admission management software market’s subscription-based revenue mix.
By Application: Customer analysis races ahead
Click-path optimisation remained the largest slice at 38.10% in 2025, but customer analysis applications are now the growth star with a 15.02% CAGR. Businesses want to spot churn risk, predict next-order items, and segment high-lifetime-value cohorts. Embedding these models inside engaging visual workflows differentiates leading platforms.
As maturity grows, firms shift budgets away from static dashboards toward predictive scoring and prescriptive recommendations. The admission management software market accordingly invests in embedded machine-learning frameworks and low-code model builders that shorten deployment cycles and cut dependence on data-science headcount.
By Organization Size: SME uptake accelerates
Large enterprises still produced 56.35% of 2025 revenue thanks to multi-brand, multi-channel complexity that mandates enterprise-grade tooling. However, SME subscriptions are rising at 13.76% CAGR as vendors introduce freemium tiers, step-by-step onboarding, and auto-generated insights. Lightweight SDKs eliminate the need for deep engineering talent, letting lean teams track funnels within hours.
Growing SME adoption expands total addressable volume, though average deal sizes remain smaller. Vendors counterbalance this by automated upsell paths—advanced feature unlocks and pay-per-event tiers—keeping the admission management software market’s revenue curve steady.
By Industry Vertical: Retail and e-commerce dominate, but healthcare and travel climb
Retail and e-commerce generated 23.85% of 2025 revenue because basket-level insights convert directly to purchase uplift. Media, BFSI and telecom follow, each seeking richer engagement metrics. Healthcare adoption is climbing as patient portals integrate behavioural nudges to improve appointment adherence, while airlines and OTAs apply journey analytics to reduce booking abandonment. These sector expansions diversify the admission management software market, cushioning exposure to single-industry cycles.
Cross-vertical demand is unified by the same objective: interpreting granular user events to personalise touchpoints. Industry-specific templates—HIPAA-compliant schemas for healthcare, PCI-aligned flows for payment data—help vendors penetrate regulated niches without heavy custom coding.
Geography Analysis
North America delivered 41.10% of global revenue in 2025 due to high digital-commerce penetration, mature cloud infrastructure, and concentration of leading vendors. Enterprises in the region treat analytics as a make-or-break competency, funnelling budgets into AI augmentation and privacy-by-design frameworks. While growth is slowing as adoption saturates, wallet share remains high because buyers expand use cases within the same platforms, sustaining account-based revenue.
Europe ranks second, driven by GDPR-induced demand for platforms that blend insight depth with strict consent controls. Vendors localise data-hosting options and integrate multilingual consent banners, boosting uptake in Germany, France and the Nordics. The admission management software market benefits from pan-EU data-transfer rules that favour providers offering in-region datacentres and advanced security certifications. Growth is steady as organisations embed analytics deeper into marketing resource-management workflows.
Asia-Pacific is the flash-growth engine, forecast to log a 15.38% CAGR. Mobile-first consumer behaviour in India, Indonesia and the Philippines requires multi-device identity stitching, pushing local firms to adopt event-stream analytics early. Generative-AI-centric feature sets resonate with digitally native start-ups eager for low-code insight extraction. Regional governments’ push for cross-border data flows and cloud adoption further enlarges the admission management software market, especially in e-payments and super-app ecosystems.

Competitive Landscape
The admission management software market is moderately fragmented. Adobe, Google and Microsoft leverage wide ecosystems—advertising, CMS, productivity suites—to cross-sell analytics modules. Their breadth appeals to enterprises seeking consolidated procurement and unified data fabrics. Specialist vendors such as Amplitude, Mixpanel and Contentsquare focus on depth, offering granular session replay, in-app funnel diagnostics, and lightweight experimentation layers that attract product teams.
Platform consolidation is intensifying larger players acquire niche tools to plug capability gaps (for example, session replay or predictive churn scoring). Simultaneously, start-ups differentiate via privacy-preserving approaches—edge-processed metrics and synthetic identifiers—to win accounts wary of regulatory risk. Patent filings around WebAssembly-based browser analytics and differential privacy illustrate a pipeline of innovation that could realign competitive standings over the next five years.
Pricing models are also diverging. Full-stack suites bundle analytics with CDPs and marketing-automation, creating multi-year commitments. Point-solution vendors emphasise transparent per-event or per-seat rates, appealing to cost-sensitive SMEs. Services partners play a pivotal role in stitching together mixed stacks, shaping vendor shortlists. Overall, buyer power is rising as switching costs fall, nudging providers to prioritise open APIs and out-of-the-box integrations to retain clients.
Admission Management Software Industry Leaders
Adobe Inc.
Google LLC
International Business Machines Corporation (IBM)
Microsoft Corporation
Oracle Corporation
- *Disclaimer: Major Players sorted in no particular order

Recent Industry Developments
- January 2025: Adobe enforced a shift from Service Account (JWT) to OAuth Server-to-Server credentials for all outbound integrations, strengthening security posture.
- February 2025: Adobe published its 2025 AI and Digital Trends report showing that 65% of executives cite AI analytics as a primary growth lever.
- March 2025: Adobe rolled out a B2B edition of Customer Journey Analytics tailored to account-based sales cycles.
- April 2025: Quantum Metric unveiled Felix AI User Summaries, Dimensional Dashboards, and replay-driven funnel builders in its Spring 2025 launch.


Research Methodology Framework and Report Scope
Market Definitions and Key Coverage
Mordor Intelligence defines the admission management software market as all purpose-built digital solutions that help educational institutions receive, process, and convert applications into enrolled students, covering workflow automation, applicant communication, fee collection, document validation, and yield analytics across K-12 schools, higher education, and short-cycle vocational programs.
Scope excludes stand-alone learning management, attendance, or finance modules that do not directly influence the admissions funnel.
Segmentation Overview
- By Component
- Software
- Services
- By Deployment Mode
- Cloud
- On-premise
- By Application
- Click Path and Website Optimization
- Customer Analysis
- Basket Analysis and Personalization
- Traffic Analysis
- Website / App Performance Optimization
- By Industry Vertical
- Retail and E-commerce
- Media and Entertainment
- BFSI
- Telecommunications and IT
- Travel and Hospitality
- Healthcare
- Others
- By Organisation Size
- Large Enterprises
- Small and Medium Enterprises
- By Geography
- North America
- United States
- Canada
- Mexico
- South America
- Brazil
- Argentina
- Rest of South America
- Europe
- United Kingdom
- Germany
- France
- Italy
- Rest of Europe
- Asia-Pacific
- China
- Japan
- India
- South Korea
- Rest of Asia-Pacific
- Middle East
- Israel
- Saudi Arabia
- United Arab Emirates
- Turkey
- Rest of Middle East
- Africa
- South Africa
- Egypt
- Rest of Africa
- North America
Detailed Research Methodology and Data Validation
Primary Research
Subsequently, we spoke with admissions directors at universities, K-12 district technology managers, cloud integrators, and regional EdTech associations across North America, Europe, India, and Southeast Asia. These interviews tested adoption curves, intake seasonality, and discounting practices, filling gaps that desk work could not resolve and grounding our assumptions in real purchasing behavior.
Desk Research
Our analysts began with publicly available education statistics such as NCES enrollment datasets, UNESCO Institute for Statistics updates on tertiary participation, Eurostat higher-ed mobility files, and AICTE annual handbooks, which outline applicant pools country by country. Government procurement portals, patent databases like Questel (to gauge innovation velocity), and company 10-K filings were mined to benchmark average selling prices and renewal rates. D&B Hoovers and Dow Jones Factiva provided revenue splits that let us approximate vendor penetration. The sources cited above are illustrative; many additional open and paid references informed data capture, clarification, and verification.
Market-Sizing & Forecasting
A top-down enrollment pool reconstruction was executed. Total applicants by institution type were multiplied by digitization ratios and weighted average software spend. Results were cross-checked through selective bottom-up vendor roll-ups and sampled ASP × license volumes, ensuring mutual coherence in the two approaches. Key variables like online application penetration, cloud price erosion, cross-border student flow, regulatory compliance spend, and multi-channel communication demand drive both the 2025 baseline and five-year regression forecast. Multivariate regression, validated by expert consensus, projects future values while scenario analysis tempers shocks such as sudden visa rule changes. Where supplier data were thin, we filled gaps by aligning to regional benchmarks from comparable districts before applying conservative variance caps.
Data Validation & Update Cycle
Outputs pass a three-layer review: automated outlier flags, peer analyst scrutiny, and senior sign-off. Annual refresh is standard, yet interim updates launch when major policy or merger events shift market fundamentals. Before release, an analyst re-runs critical checks so clients receive the freshest view.
Why Mordor's Admission Management Software Baseline Commands Reliability
Published estimates often diverge because firms choose dissimilar functional scopes, price points, and update cadences.
Key gap drivers include whether K-12 segments are counted with higher education only, the treatment of bundled SIS modules, currency translation dates, and the aggressiveness of cloud cost deflators. Our disciplined scoping and annual recalibration curb such swings.
Benchmark comparison
| Market Size | Anonymized source | Primary gap driver |
|---|---|---|
| USD 1.46 B (2025) | Mordor Intelligence | - |
| USD 1.58 B (2024) | Global Consultancy A | Combines admission tools with broader student information suites, inflating total |
| USD 1.25 B (2023) | Research Publisher B | Omits K-12 adoption and applies lower ASP benchmarks |
| USD 1.03 B (2024) | Industry Association C | Counts software licenses only, excluding implementation and support services |
Taken together, the comparison shows that Mordor's clearly defined scope, dual-track modeling, and yearly refresh deliver a balanced, transparent baseline that decision-makers can trace back to concrete variables and repeatable steps.


Key Questions Answered in the Report
What is the current value of the admission management software market?
The admission management software market size is USD 1.59 billion in 2026.
How fast will the admission management software market grow?
The market is projected to expand at a 8.71% CAGR, reaching USD 2.41 billion by 2031.
Which region leads in revenue?
North America holds 41.10% of 2025 revenue, ahead of Europe and Asia-Pacific.
Why are cloud deployments preferred?
Cloud captures 67.75% share because elastic compute reduces the cost of ingesting and analysing large click-stream volumes.
Which application segment is growing fastest?
Customer analysis applications are advancing at a 15.02% CAGR as firms seek predictive insights into churn and lifetime value.
How are privacy regulations affecting adoption?
Stricter rules like GDPR and CCPA push enterprises to platforms with built-in consent and data-minimization tools, influencing vendor selection and slowing implementations that lack compliance features.
Page last updated on:


