3D Secure Pay Authentication Market Size and Share
Market Overview
| Study Period | 2020 - 2031 |
|---|---|
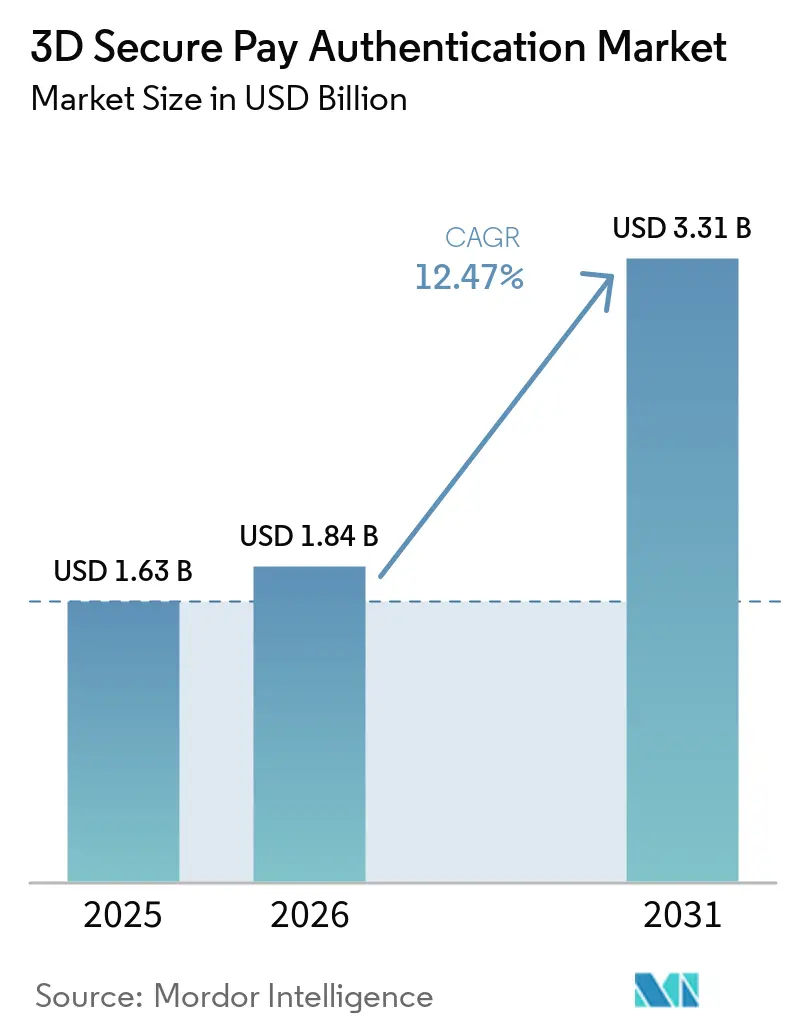
| Market Size (2026) | USD 1.84 Billion |
| Market Size (2031) | USD 3.31 Billion |
| Growth Rate (2026 - 2031) | 12.47% CAGR |
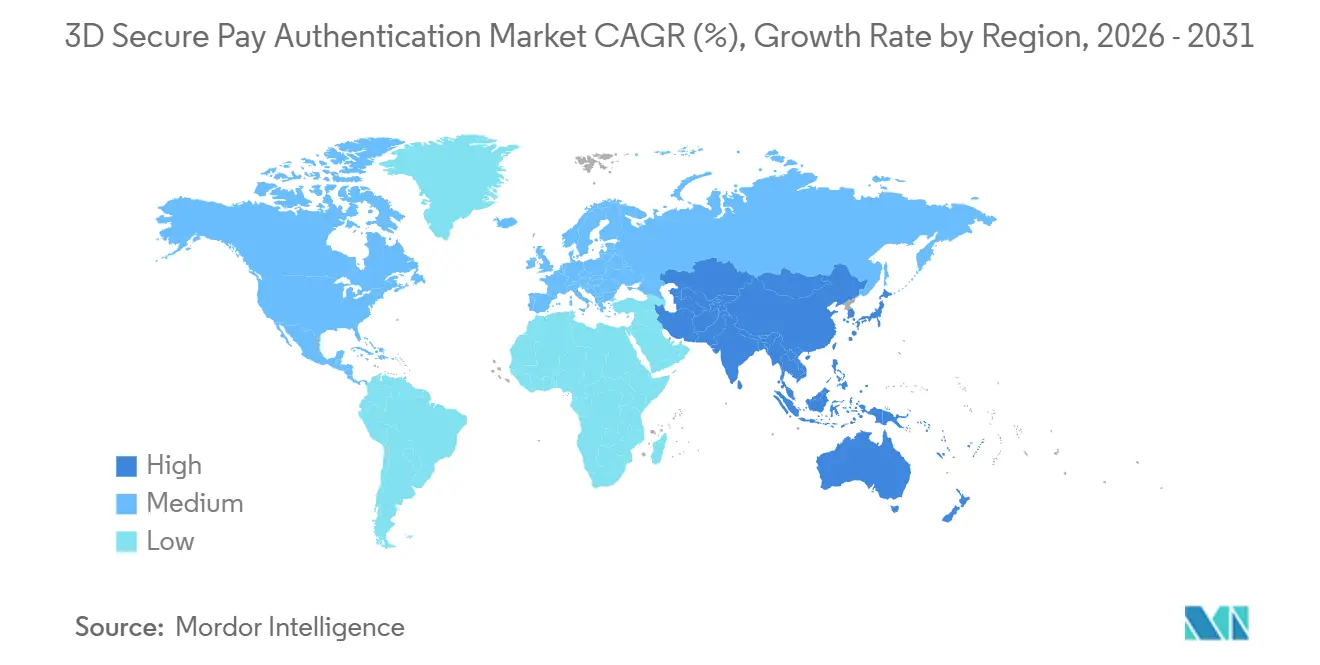
| Fastest Growing Market | Asia Pacific |
| Largest Market | North America |
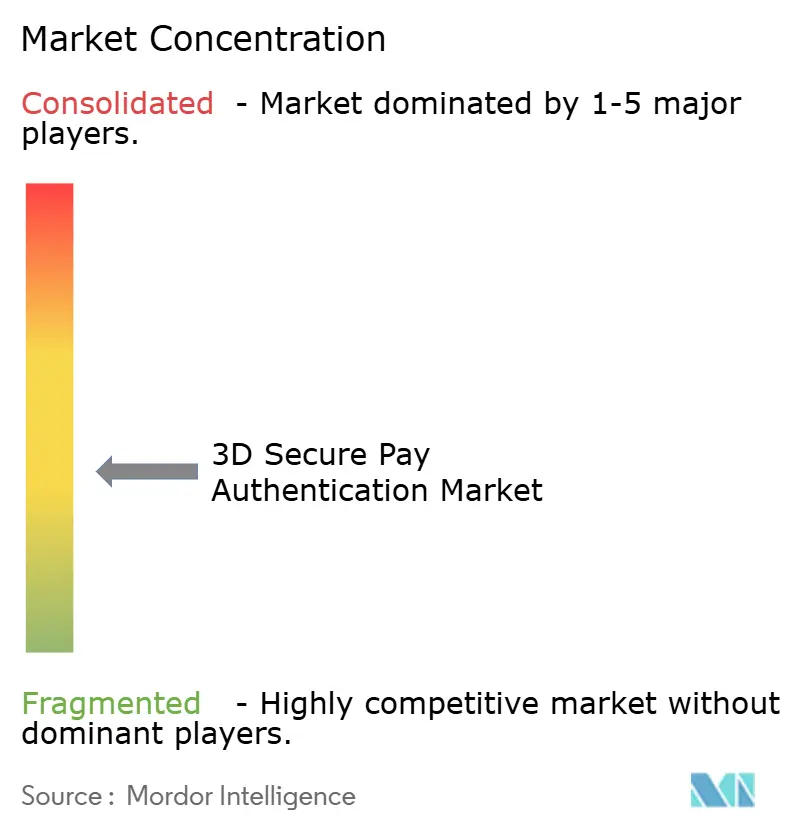
| Market Concentration | Medium |
Major Players *Disclaimer: Major Players sorted in no particular order Image © Mordor Intelligence. Reuse requires attribution under CC BY 4.0. | |
3D Secure Pay Authentication Market Analysis by Mordor Intelligence
The 3D Secure Pay Authentication market size is expected to grow from USD 1.63 billion in 2025 to USD 1.84 billion in 2026 and is forecast to reach USD 3.31 billion by 2031 at 12.47% CAGR over 2026-2031. Merchant demand for real-time risk scoring, issuer pressure to curb chargebacks, and card-network performance penalties are creating a structural need for stronger payer verification across every digital channel. Regulatory deadlines in India, Brazil, and key European Union markets are accelerating adoption even among merchants that historically resisted checkout friction. As cloud infrastructure lowers entry barriers, fintech and Buy Now Pay Later providers now embed passkeys and biometrics directly inside mobile applications, shifting budget away from legacy plug-ins toward software development kits and orchestration engines. Competitive intensity is rising as card networks offer managed authentication platforms while specialist vendors differentiate on conversion uplift through machine learning personalization.
Key Report Takeaways
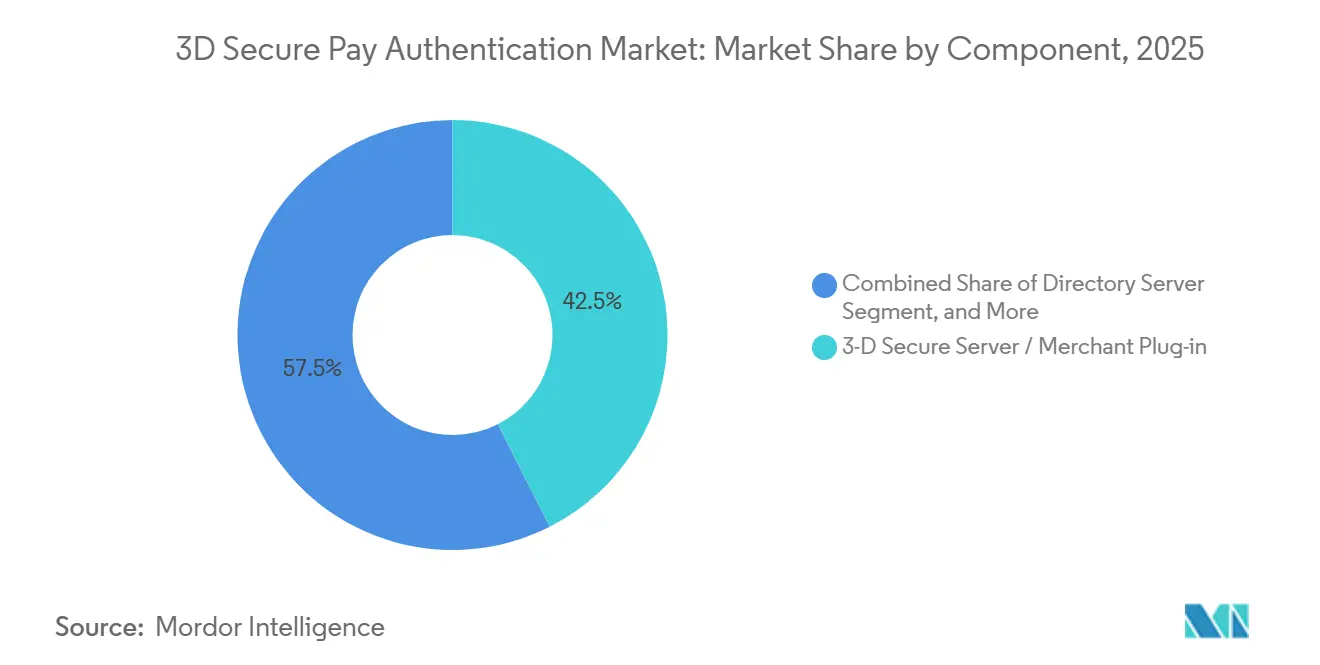
- By component, the 3D Secure Server and Merchant Plug-in segment led the 3D Secure Pay Authentication market with 42.53% market share in 2025, and SDK and Integration Services are projected to expand at a 12.91% CAGR through 2031.
- By deployment mode, cloud-based models accounted for 51.18% of the 3D Secure Pay Authentication market in 2025. Also, cloud-based models are set to grow at a 12.83% CAGR from 2026 to 2031.
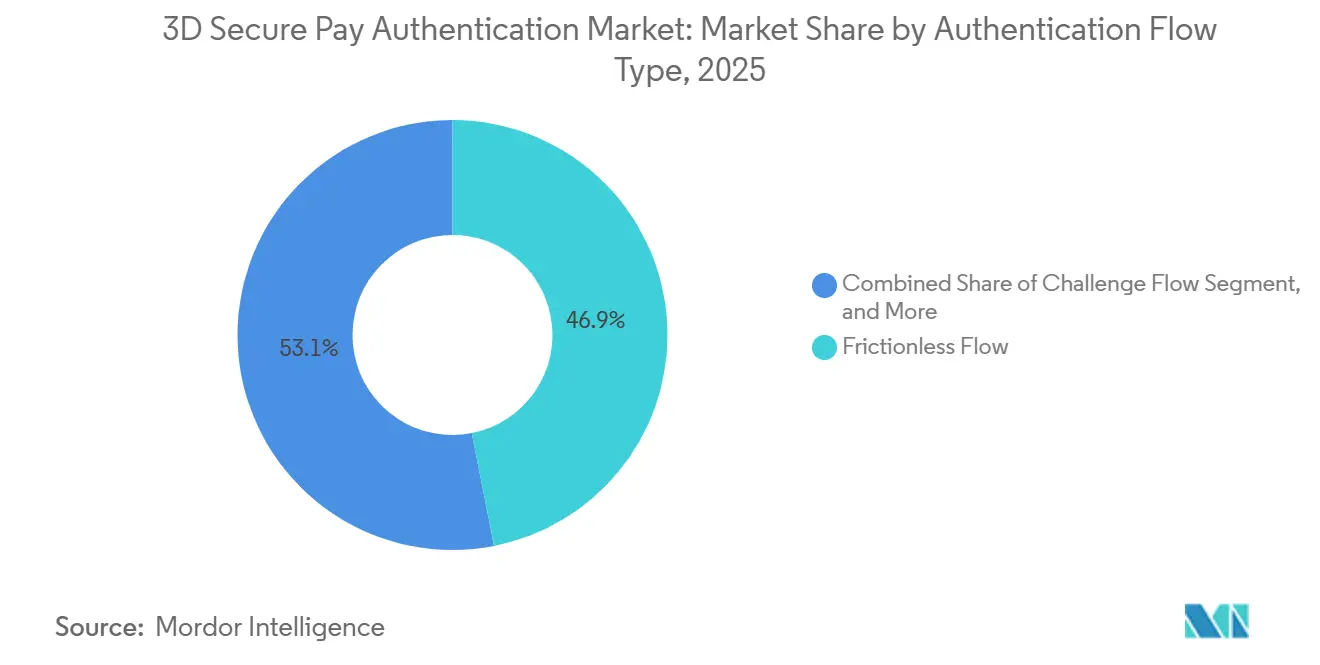
- By authentication flow type, frictionless flow accounted for 46.91% of the 3D Secure Pay Authentication market in 2025, while out-of-band and decoupled flow are advancing at a 12.86% CAGR through 2031.
- By end user, banks and issuers held 38.98% revenue share of the 3D Secure Pay Authentication market in 2025, and fintech plus Buy Now Pay Later platforms are the fastest-growing segment at 13.06% CAGR to 2031.
- By geography, North America generated 40.55% share of the 3D Secure Pay Authentication market in 2025, and Asia-Pacific is forecast to record the highest regional CAGR at 13.11% through 2031.
Note: Market size and forecast figures in this report are generated using Mordor Intelligence’s proprietary estimation framework, updated with the latest available data and insights as of January 2026.
Global 3D Secure Pay Authentication Market Trends and Insights
Drivers Impact Analysis*
| Driver | (~) % Impact on CAGR Forecast | Geographic Relevance | Impact Timeline |
|---|---|---|---|
| Surge in E-Commerce and Card-Not-Present Fraud | +3.2% | Global, acute in North America, Europe, Asia-Pacific | Short term (≤ 2 years) |
| Regulatory Mandates (PSD2 SCA, India RBI, Brazil BCB) | +2.8% | Europe, Asia-Pacific, South America, the Middle East, and Africa | Medium term (2-4 years) |
| Migration To EMV 3-D Secure 2. X Protocols | +2.1% | Global, led by Europe and North America | Medium term (2-4 years) |
| Mobile-Wallet and In-App Payment Boom | +1.9% | Asia-Pacific, North America, Europe | Short term (≤ 2 years) |
| Webauthn and Passkey Integration | +1.3% | Global, concentrated in North America and Europe | Long term (≤ 4 years) |
| Cloud HSM-Powered Real-Time Risk Scoring | +1.1% | North America, Europe, and the early Asia-Pacific | Medium term (2-4 years) |
| Source: Mordor Intelligence | |||
Surge in E-Commerce and Card-Not-Present Fraud
Record USD 48 billion in e-commerce fraud during 2025 pushed card-not-present abuse to 73% of total card fraud, making strong customer authentication the primary loss-prevention lever.[1]Association for Financial Professionals, “2026 Payments Fraud and Control Survey,” afponline.org Chargeback fraud losses are projected at USD 28.1 billion during 2026, and every fraudulent dollar now costs U.S. merchants USD 4.61 when merchandise, shipping, and fees are included.[2]Ravelin Technology Ltd., “Ravelin Online Payments Benchmark 2026,” ravelin.com EMV 3-D Secure liability shift rules place chargeback responsibility on issuers once authentication is declined, encouraging banks to raise challenge rates. Authenticated checkouts cut fraud-coded chargebacks by 60-80%, a return that offsets per-call fees of USD 0.05-0.15. Fraud escalation, therefore, fuels volume growth for 3D Secure Pay Authentication market providers while forcing them to balance security with friction-free experiences.
Regulatory Mandates Compress Compliance Timelines
Payment Services Directive 2 prevented an estimated EUR 20 billion (USD 22.3 billion) in European fraud, but narrower exemptions and issuer denial of low-risk requests now drive mandatory authentication volumes.[3]European Central Bank, “Fifth PSD2 Progress Report,” ecb.europa.eu India’s September 2025 directions require at least one dynamic factor for every domestic transaction from April 2026, and issuers must reimburse customers for non-compliance losses. Brazil’s Resolution 506 requires biometric confirmation for Pix transfers and device registration, increasing infrastructure spending among local institutions. Visa began penalizing acquirers in October 2025 when authentication rates fell below network thresholds, lifting U.S. authentication volume from January 2026 onward.[4]Visa Inc., “Value-Added Services Minimum Performance Program,” visa.com Rules in multiple regions create a compliance floor beneath organic demand, accelerating the 3D Secure Pay Authentication market even where merchant adoption was previously discretionary.
Migration to EMV 3-D Secure 2.x Unlocks Frictionless and Delegated Flows
EMV Co data show that version 2.x cuts online fraud by 85% on implemented sites and enables frictionless, challenge, and out-of-band options that legacy 1.0 lacked. Protocol updates in March 2025, August 2025, and January 2026 added WebAuthn Conditional Create and Secure Payment Confirmation, paving the way for biometric or passkey approvals inside issuer apps. Adyen reported up to 7% conversion uplift when merchants use delegated authentication before routing to issuer Access Control Servers. Mastercard demonstrated that tokenization plus biometrics triples fraud reduction relative to no controls and boosts approval by up to 6 percentage points. While issuer acceptance still varies between 68-92%, the technology foundation now exists to scale low-friction authentication globally.
Mobile-Wallet and In-App Payment Boom Expands Authentication Surface
Network tokens issued by Visa rose 44% year over year to 12.6 billion as tokenization became the baseline for in-app and wallet traffic. PayPal disclosed that passkey deployment lowered cart abandonment by 15-25% and sped up checkout by 20-35% in January 2025, prompting payment service providers to prioritize FIDO2 rollout. J.P. Morgan piloted facial recognition for account validation in May 2025 to counter synthetic identity fraud that cost the United States USD 30-35 billion. Apple’s April 2024 decision to open Face ID and NFC APIs exposed capability differences between iOS and Android, adding complexity to cross-platform integration. Rapid wallet adoption, therefore, expands both opportunity and surface area for 3D Secure Pay Authentication market vendors.
Restraints Impact Analysis*
| Restraint | (~) % Impact on CAGR Forecast | Geographic Relevance | Impact Timeline |
|---|---|---|---|
| Integration Cost and Complexity | -1.8% | Global, acute for small and mid-sized merchants | Short term (≤ 2 years) |
| Checkout Friction in Non-Mandate Regions | -1.4% | North America, parts of Asia-Pacific, the Middle East, and Africa | Short term (≤ 2 years) |
| Inconsistent Issuer Readiness in Emerging Markets | -0.9% | Asia-Pacific, South America, Africa | Medium term (2-4 years) |
| Privacy Rules Limiting Data-Sharing | -0.6% | Europe, North America, and spillover to the Asia-Pacific | Long term (≥ 4 years) |
| Source: Mordor Intelligence | |||
Integration Cost and Complexity Deter Mid-Market Merchants
Per-authentication fees appear modest, yet small merchants face one-time integration projects, device testing, and ongoing dispute management that strain limited resources. Entersekt’s Orkestrate promises 85% faster deployment and 98% frictionless logins, but adoption remains skewed toward tier-one banks. Regulatory mandates force even low-value transactions into strong customer authentication, pushing some sellers to lobby for risk-based exemptions that dilute fraud benefits. The cost-benefit gap narrows where average ticket values are high, yet many micro-merchants still choose to absorb chargebacks rather than risk abandonment. The drag on the 3D Secure Pay Authentication market is therefore most acute in fragmented long-tail segments.
Checkout Friction in Non-Mandate Regions Caps Voluntary Uptake
Global authorization decline rates average 17%, and 19% of transactions sent to 3-D Secure are lost to friction, according to Ravelin’s 2026 benchmark. In the United States and several Asia-Pacific jurisdictions, merchants can legally bypass authentication for low-risk baskets, and many do so to avoid conversion loss. Adyen’s Personalize uses machine learning to tailor challenges and claims 6% conversion uplift, but requires historical data that new merchants lack. Issuers are tightening risk thresholds to dodge liability-shift chargebacks, eroding frictionless success rates in 76% of surveyed countries. Until passkey and biometric flows deliver a true one-tap experience, optional adoption in non-mandate regions will remain constrained.
*Our forecasts treat driver/restraint impacts as directional, not additive. The impact forecasts reflect baseline growth, mix effects, and variable interactions.
Segment Analysis
By Component: SDK and Integration Services Gain as Passkey Adoption Accelerates
SDK and Integration Services are set to capture a growing share of the 3D Secure Pay Authentication market revenue as issuers embed biometric and passkey flows natively in mobile apps. The 3D Secure Server and Merchant Plug-in category kept a 42.53% share in 2025, reflecting legacy installs, yet the preference is shifting toward modular software kits that speed device binding and reduce maintenance. Visa’s Payment Passkey Service and Noon Payments’ global launch illustrate the card network's intention to deliver plug-and-play FIDO2 through managed services, which supports the 12.91% forecast CAGR for SDK spend. Directory Servers retain their importance as routing components, yet most are bundled into broader orchestration platforms rather than sold standalone. Integration budgets are also flowing toward delegated authentication capability, letting merchants pre-score risk and call issuer Access Control Servers only when needed.
Cloud delivery models further catalyze growth. Utimaco’s Payment HSM as a Service on IBM Cloud exemplifies a move away from capital-intensive hardware toward elastic cryptography functions. Mastercard token services now append authentication metadata, reducing the need for separate server calls and blurring the lines between tokenization and authentication components. As mobile-first markets such as India expect biometrics and passkeys to lift success rates 2-3 percentage points, SDK demand intensifies across fintech and Buy Now Pay Later platforms. Consequently, SDKs and orchestration tools reinforce the 3D Secure Pay Authentication market's momentum without adding checkout friction.


By Deployment Mode: Cloud-Based Models Dominate Through Elastic Compute
Cloud-based deployment accounted for 51.18% of the 3D Secure Pay Authentication market size in 2025 and will grow at 12.83% through 2031. Managed services such as Utimaco Payment HSM on IBM Cloud and Microsoft Azure Payment HSM remove the need for physical key-management hardware, opening enterprise-grade security to mid-tier issuers. Real-time machine learning models that calculate risk scores now update continuously in cloud environments, a feat hard to match on fixed on-premises appliances. Visa’s Intelligent Authorization platform, launched in Europe during March 2026, pledges 99.999% uptime and 96.3% approval accuracy, metrics that showcase cloud resilience.
On-premises systems persist where data residency mandates require local processing, especially among regulated banks in South America and the Asia-Pacific. Hybrid architectures place event-stream analytics in the cloud while retaining key stores locally, offering a compliance bridge. Variable pricing further favors cloud: paying USD 0.05-0.15 per authentication on a usage basis is simpler than depreciating capital hardware over five years. Fraud surge and synthetic identity threats costing U.S. institutions up to USD 35 billion reinforce the need for scalable analytics, anchoring the cloud’s leadership within the 3D Secure Pay Authentication market.
By Authentication Flow Type: Out-of-Band and Decoupled Flow Rises
Frictionless flow still processed 46.91% of 2025 transactions, yet out-of-band plus decoupled models are racing ahead at a 12.86% CAGR. EMV Co protocol updates include Split-SDK and Secure Payment Confirmation, enabling issuers to push approval requests to customer devices while a browser session remains active. This asynchronous method preserves conversion because users authenticate in a familiar biometric environment instead of keying in a password in a pop-up. Delegated authentication is a rising subset: merchants conduct risk analysis locally, turning to issuer servers only when risk exceeds a dynamic threshold. Adyen documented 7% conversion uplift from this approach.
Frictionless success rates are falling in three-quarters of the surveyed countries as issuers tighten risk models, driving merchants toward out-of-band flows that better meet regulatory requirements while maintaining user experience. PayPal reported that cart abandonment fell by up to 25% after passkey deployment, validating the benefits of the asynchronous model. The caveat is that merchants without native apps cannot leverage decoupled push notifications, creating a two-tier landscape. Nevertheless, regulatory encouragement and consumer preference position out-of-band authentication at the forefront of future 3D Secure Pay Authentication market adoption.
By End User: FinTechs and BNPL Platforms Accelerate
Banks and issuers accounted for 38.98% of 2025 spending because they hold final authorization decisions under EMV 3-D Secure. However, fintech and Buy Now Pay Later operators will outpace every other group with 13.06% CAGR to 2031. Klarna’s USD 136 million jump in credit losses in Q1 2025 underscores the urgency of stronger identity checks. Agentic commerce partnerships, such as Fiserv and Mastercard’s January 2026 framework, require authentication stacks that can validate non-human transaction initiators, expanding addressable demand.
Merchants and payment gateways continue investing because chargeback liability often rests with them. Adyen’s Personalize feature targets this cohort, leveraging historical data to lower friction without degrading security. Visa’s centralized Intelligent Authorization moves decision logic out of individual issuers into the network layer, promising uniform global performance. Regional mandates in India and Brazil, meanwhile, force legacy issuers to modernize, adding volume to the broader 3D Secure Pay Authentication market.
Geography Analysis
North America remained the revenue leader in 2025 with 40.55% share, as Visa and Mastercard interchange optimization, plus October 2025 performance penalties, drove issuers to authenticate a higher portion of e-commerce traffic. The region’s abundant cloud infrastructure lets acquirers implement risk scoring quickly, and network token penetration exceeds any other global zone.
Asia-Pacific is the growth engine, with a 13.11% CAGR projected through 2031. India’s April 2026 mandate for dynamic two-factor checks and China’s booming cross-border e-commerce demand compel issuers to deploy EMV 3-D Secure 2.x at scale. More than 12.6 billion network tokens were active worldwide in 2026, with Asia-Pacific accounting for a disproportionate slice because mobile wallets dominate daily transactions. Authentication success gaps persist, however: India reached only 72% and Brazil 36% in 2026 compared with the United Kingdom’s 95%, highlighting readiness disparities that vendors must bridge.
Europe enjoys the world’s highest authentication success due to mature PSD2 rollouts, registering 95% in the United Kingdom, 93% in Italy, and 92% in the Netherlands. Continued tightening of transaction-risk analysis exemptions keeps volume elevated even in saturated markets. The Middle East and Africa and South America trail on absolute dollars but post step-change adoption as the United Arab Emirates and Saudi Arabia align rules with card-network standards, and Brazil’s biometric Pix requirements escalate spend. Geographic divergence in issuer capabilities therefore shapes a multi-speed expansion path for the 3D Secure Pay Authentication market.

Competitive Landscape
The 3D Secure Pay Authentication market is moderately fragmented. Visa and Mastercard control protocol updates and certification regimes, yet now also provide managed platforms such as Visa Intelligent Authorization and Mastercard Token Authentication Service, blurring the roles of standard-setter and vendor. Visa’s European launch of Intelligent Authorization in March 2026 promised 99.999% uptime and 96.3% approval accuracy, a benchmark few standalone vendors can match. Mastercard’s December 2025 Digital Payment Security Principles white paper backed tokens plus biometrics and cited 40% fewer false positives in pilot studies.
Specialists like Entersekt, Netcetera, and Ravelin differentiate on orchestration speed and conversion uplift. Entersekt Orkestrate, released in November 2025, claims 85% faster integration and 98% frictionless logins, appealing to payment service providers consolidating multiple flows into a single engine. Adyen delivers machine learning personalization that lifts conversion rates by up to 6% and trims costs by 3%, demonstrating demand for data-driven challenge logic.
Cloud infrastructure providers IBM, Microsoft, and Amazon Web Services now host Payment HSM as a Service, democratizing cryptographic hardware while capturing recurring revenue. EMV Co protocol enhancements that support WebAuthn and passkeys reduce vendor lock-in by standardizing advanced flows. White-space opportunity remains largest in emerging markets where issuer success rates lag, Brazil at 36% and India at 72%, and in verticals such as Buy Now Pay Later that still battle synthetic identity fraud costing USD 30-35 billion. Overall rivalry centers on delivering higher approval rates at lower friction while maintaining compliance, a balance that rewards continuous innovation within the 3D Secure Pay Authentication market.
3D Secure Pay Authentication Industry Leaders
GPayments Pty Ltd.
CardinalCommerce Corporation
Modirum Oy
Broadcom Inc.
Entrust Corporation
- *Disclaimer: Major Players sorted in no particular order

Recent Industry Developments
- March 2026: Worldline launched its FIDO Server to merge biometric and passkey flows inside issuer Access Control Servers.
- March 2026: Visa and Fiserv expanded their European partnership to roll out Visa Acceptance Platform, bundling authentication, tokenization, and fraud tools.
- March 2026: Visa launched Intelligent Authorisation in Europe, promising 99.999% uptime and 96.3% approval accuracy.
- March 2026: Affirm and Klarna integrated Stripe Shared Payment Tokens so artificial intelligence agents can complete checkouts on behalf of consumers.


Global 3D Secure Pay Authentication Market Report Scope
The scope of the report includes an analysis of the 3D Secure Pay Authentication market, a security protocol that enhances online transaction safety by adding an additional layer of authentication. This protocol ensures that cardholders and merchants are protected against unauthorized transactions during online payments. The study examines market trends, growth drivers, challenges, and opportunities within the forecast period.
The 3D Secure Pay Authentication Market Report is Segmented by Component (Access Control Server, 3-D Secure Server and Merchant Plug-in, Directory Server, SDK and Integration Services, and More), Deployment Mode (On-premises, Cloud-based, and Hybrid), Authentication Flow Type (Frictionless Flow, Challenge Flow, Out-of-Band and Decoupled Flow, and Delegated Authentication), End User (Banks and Issuers, Merchants and Payment Gateways, Payment Service Providers, FinTechs and BNPL Platforms, and More), and Geography (North America, Europe, Asia-Pacific, Middle East, Africa, and South America). The Market Forecasts are Provided in Terms of Value (USD).
| Access Control Server (ACS) |
| 3-D Secure Server / Merchant Plug-in |
| Directory Server |
| SDK and Integration Services |
| Other Component |
| On-premises |
| Cloud-based |
| Hybrid |
| Frictionless Flow |
| Challenge Flow |
| Out-of-Band / Decoupled Flow |
| Delegated Authentication |
| Banks / Issuers |
| Merchants and Payment Gateways |
| Payment Service Providers (PSPs) |
| FinTechs and BNPL Platforms |
| Other End User |
| North America | United States |
| Canada | |
| Mexico | |
| Europe | Germany |
| United Kingdom | |
| France | |
| Italy | |
| Rest of Europe | |
| Asia-Pacific | China |
| Japan | |
| India | |
| South Korea | |
| Australia | |
| Rest of Asia-Pacific | |
| South America | |
| Middle East and Africa |
| By Component | Access Control Server (ACS) | |
| 3-D Secure Server / Merchant Plug-in | ||
| Directory Server | ||
| SDK and Integration Services | ||
| Other Component | ||
| By Deployment Mode | On-premises | |
| Cloud-based | ||
| Hybrid | ||
| By Authentication Flow Type | Frictionless Flow | |
| Challenge Flow | ||
| Out-of-Band / Decoupled Flow | ||
| Delegated Authentication | ||
| By End User | Banks / Issuers | |
| Merchants and Payment Gateways | ||
| Payment Service Providers (PSPs) | ||
| FinTechs and BNPL Platforms | ||
| Other End User | ||
| By Geography | North America | United States |
| Canada | ||
| Mexico | ||
| Europe | Germany | |
| United Kingdom | ||
| France | ||
| Italy | ||
| Rest of Europe | ||
| Asia-Pacific | China | |
| Japan | ||
| India | ||
| South Korea | ||
| Australia | ||
| Rest of Asia-Pacific | ||
| South America | ||
| Middle East and Africa | ||


Key Questions Answered in the Report
How large will the 3D Secure Pay Authentication market be by 2031?
The market is forecast to reach USD 3.31 billion by 2031, expanding at 12.47% CAGR from 2026-2031.
Which component segment is growing fastest?
SDK and Integration Services is projected to rise at 12.91% CAGR as issuers embed passkey and biometric support directly into mobile apps.
Why is cloud deployment gaining share?
Cloud models offer elastic compute for real-time risk analytics and shift capital expense to variable fees, driving 12.83% CAGR for cloud-based adoption.
Which region shows the highest growth potential?
Asia-Pacific leads with a forecast 13.11% CAGR due to India's dynamic authentication mandate and China's cross-border e-commerce expansion.
How are card networks influencing competition?
Visa and Mastercard now supply managed authentication platforms that promise near-zero downtime and high approval accuracy, intensifying rivalry with independent software vendors.
What role do regulatory mandates play?
Deadlines in Europe, India, and Brazil create a compliance-driven floor under demand, compelling even friction-averse merchants to adopt strong customer authentication.
Page last updated on:


