1,3-Propanediol (PDO) Market Size and Share
Market Overview
| Study Period | 2021 - 2031 |
|---|---|
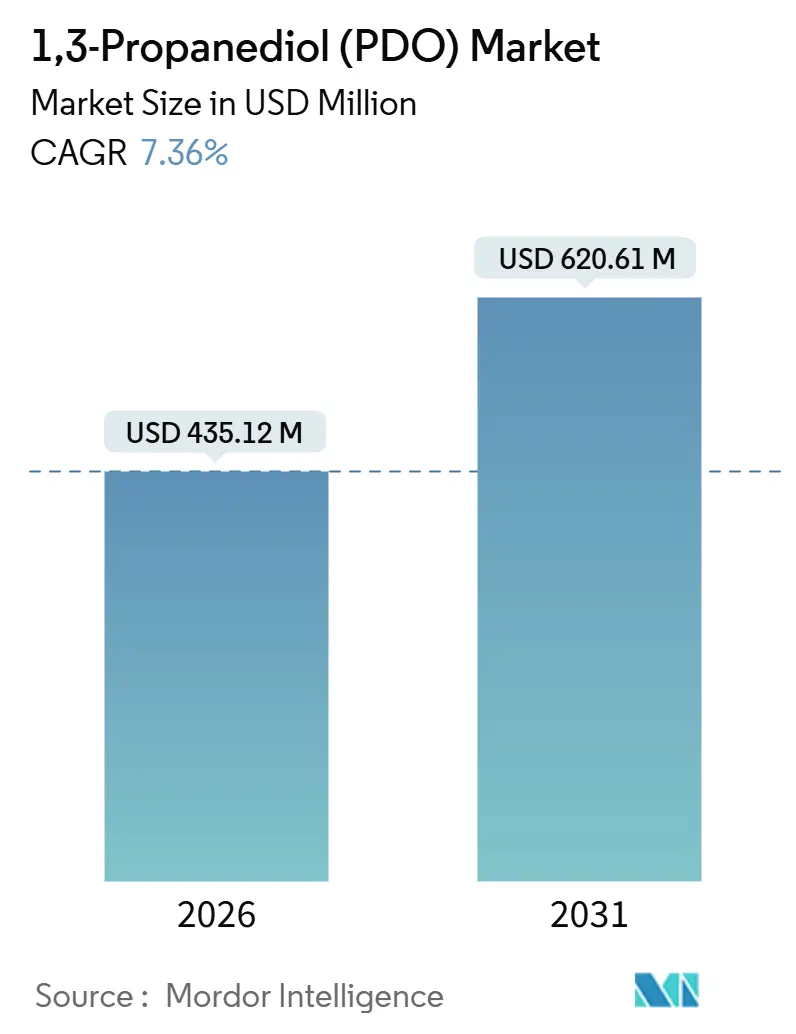
| Market Size (2026) | USD 435.12 Million |
| Market Size (2031) | USD 620.61 Million |
| Growth Rate (2026 - 2031) | 7.36% CAGR |
| Fastest Growing Market | Asia Pacific |
| Largest Market | North America |
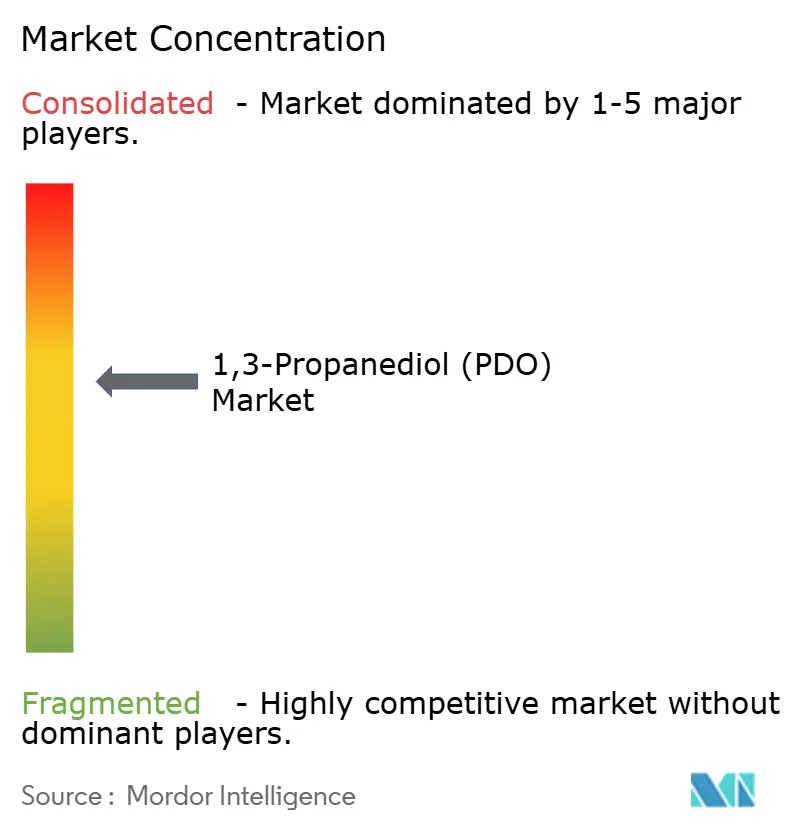
| Market Concentration | Medium |
Major Players *Disclaimer: Major Players sorted in no particular order Image © Mordor Intelligence. Reuse requires attribution under CC BY 4.0. | |
1,3-Propanediol (PDO) Market Analysis by Mordor Intelligence
The 1,3-Propanediol Market size is estimated at USD 435.12 million in 2026, and is expected to reach USD 620.61 million by 2031, at a CAGR of 7.36% during the forecast period (2026-2031). Rapid penetration of bio-based polymers, sustained premium pricing for high-purity grades, and automotive electrification are amplifying structural demand for specialty diols. Policy incentives in the United States, the European Union, and China are compressing the historical green premium, which fell from 25% in 2023 to nearly 15% by late-2025. Meanwhile, volatility in corn and crude-glycerol prices continues to test margins for fermentation players, although process optimizations are curbing feedstock intensity by 5%-8%. Competitive intensity is inching upward as Chinese glycerol-route producers undercut industrial-grade prices, prompting Western incumbents to sharpen their focus on cosmetic, pharmaceutical, and polymer applications that reward sustainability credentials. The 1,3-propanediol (PDO) market is therefore evolving into a two-tier ecosystem that pairs a volume-oriented industrial base with an insulated specialty tier.
Key Report Takeaways
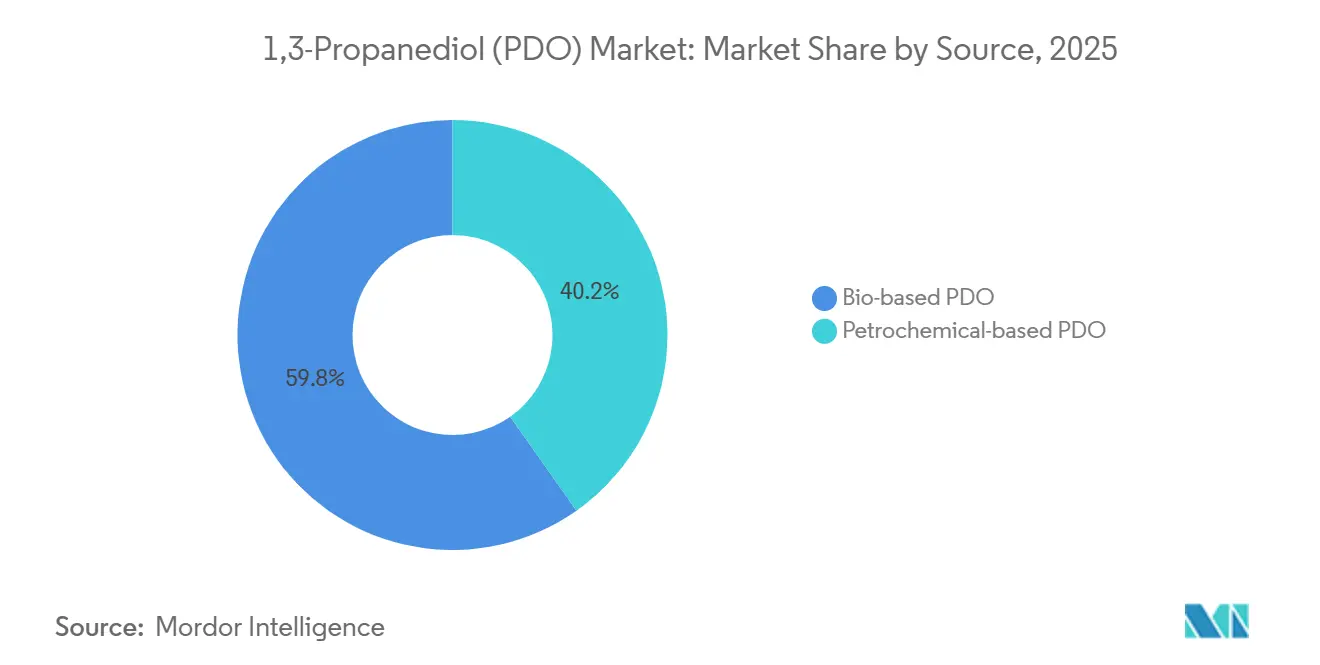
- By source, bio-based PDO captured 59.78% of revenue in 2025 and is anticipated to expand at an 8.93% CAGR through 2031.
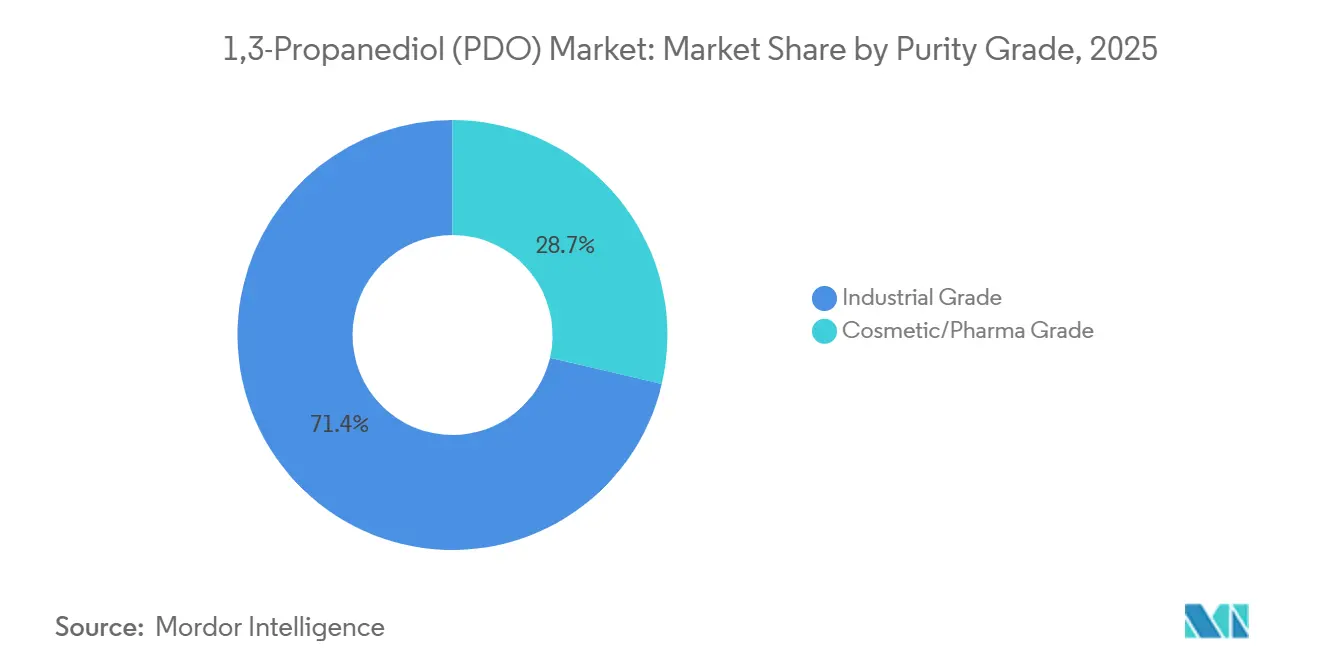
- By purity grade, industrial grade held 71.35% share in 2025 while cosmetic/pharma grade is projected to grow at a 9.88% CAGR through 2031.
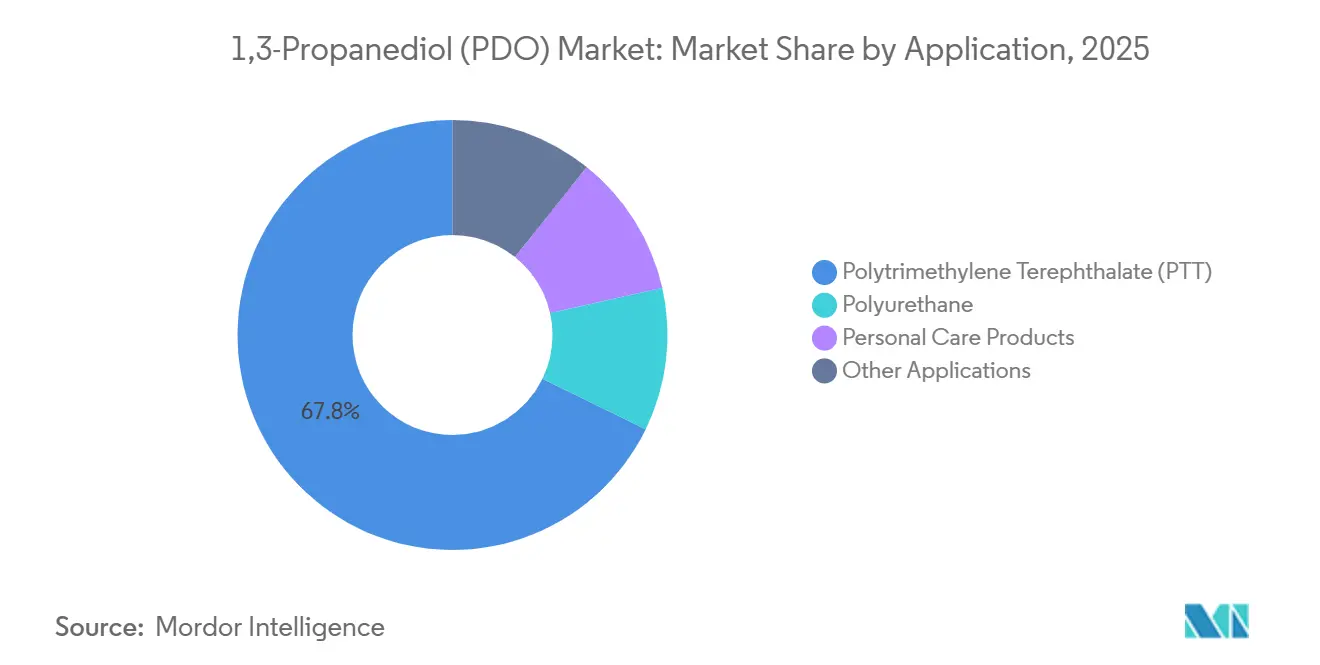
- By application, polytrimethylene terephthalate (PTT) led with 67.78% of 2025 demand and personal care products record the fastest 10.34% CAGR to 2031.
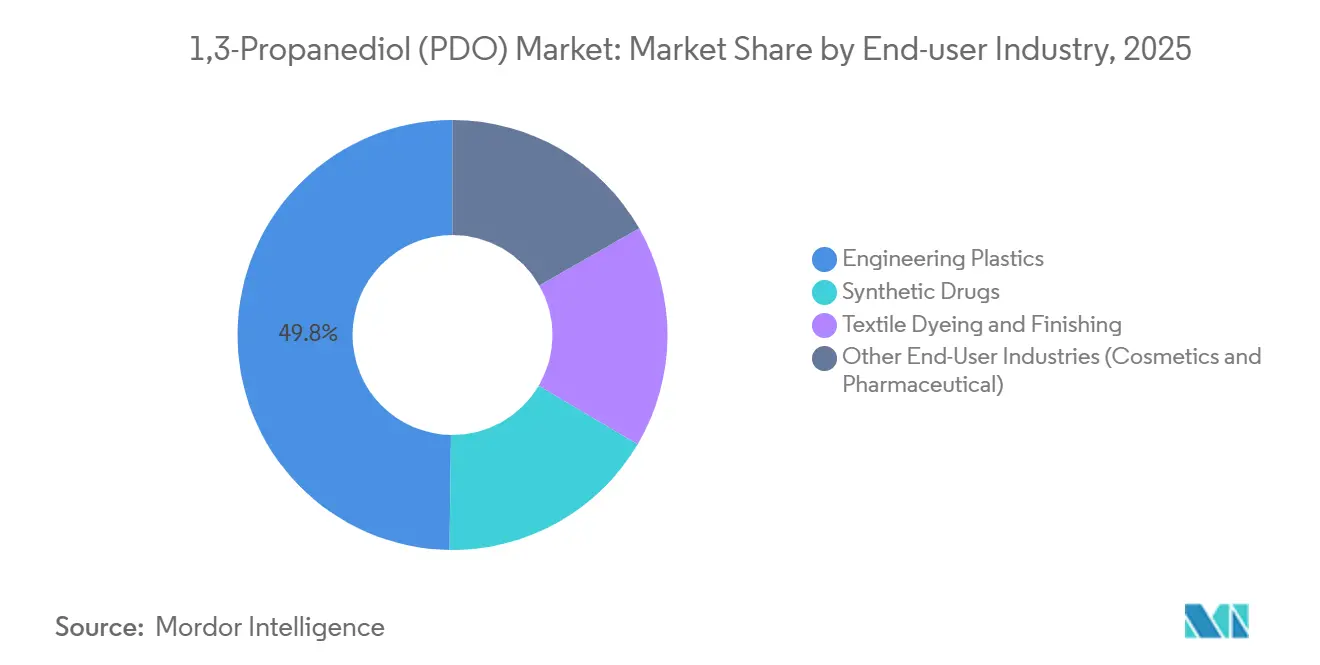
- By end-user industry, engineering plastics held 49.78% share of the 1,3-propanediol (PDO) market size in 2025 and textile dyeing and finishing is advancing at an 8.92% CAGR through 2031.
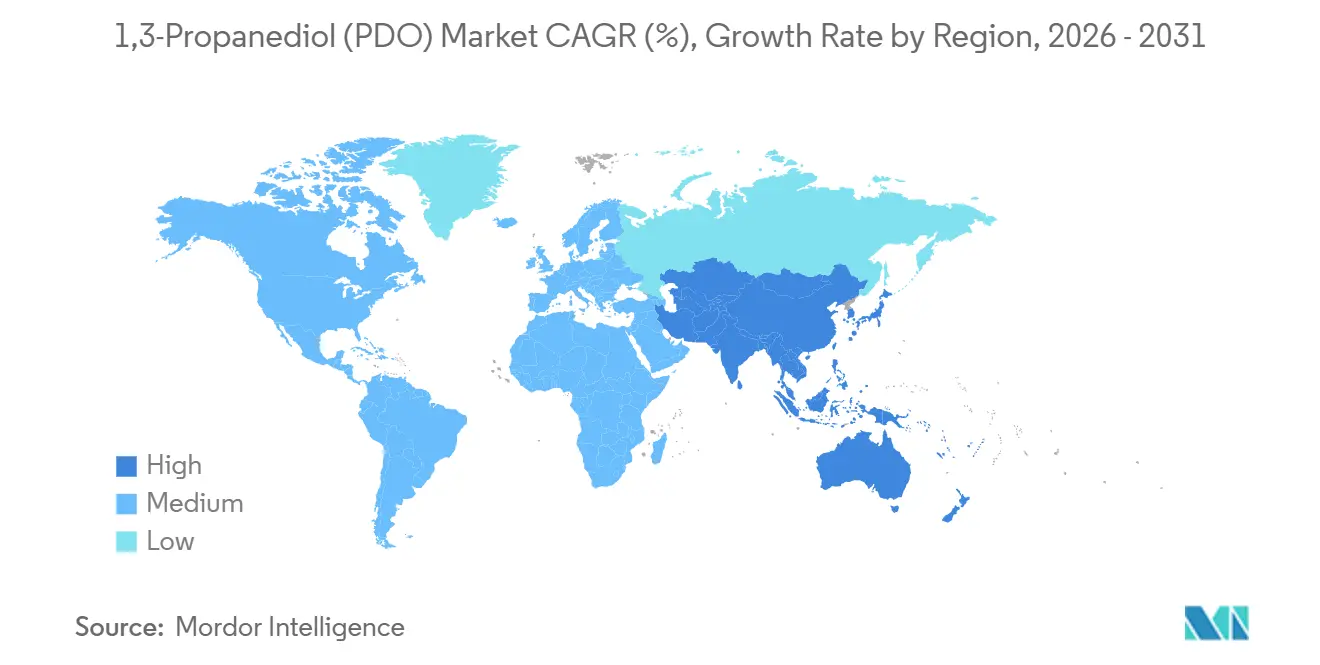
- By geography, North America commanded 34.89% share in 2025 and Asia-Pacific is forecast to deliver the highest 10.67% CAGR to 2031.
Note: Market size and forecast figures in this report are generated using Mordor Intelligence’s proprietary estimation framework, updated with the latest available data and insights as of January 2026.
Global 1,3-Propanediol (PDO) Market Trends and Insights
Drivers Impact Analysis*
| Driver | (~) % Impact on CAGR Forecast | Geographic Relevance | Impact Timeline |
|---|---|---|---|
| Surging Demand for Bio-Based Polymers | +2.1% | Global, with North America and EU leading adoption | Medium term (2-4 years) |
| Growing PTT Fiber Adoption in Automotive and Apparel | +1.8% | North America, Europe, APAC core markets | Medium term (2-4 years) |
| Expansion of Polyurethane Foams and Insulation | +1.3% | Global, particularly North America and Europe | Long term (≥ 4 years) |
| Government Incentives for Biomass-Based Chemicals | +1.5% | North America (US IRA), EU, China | Short term (≤ 2 years) |
| Shift Toward PDO-Based High-Purity Heat-Transfer Fluids | +0.7% | North America, Europe, emerging in APAC | Long term (≥ 4 years) |
| Source: Mordor Intelligence | |||
Surging Demand for Bio-Based Polymers
Corporate decarbonization is pushing buyers toward renewable monomers that carry verified life-cycle savings. DuPont’s latest sustainability audit shows that Susterra PDO delivers a 61% greenhouse-gas reduction versus petrochemical routes. The European Commission’s 2024 bio-based products strategy prioritizes drop-in chemicals such as PDO that avoid downstream retooling. China’s 14th Five-Year Plan earmarked CNY 15 billion (USD 2.1 billion) for fermentation capacity with PDO listed among 12 platform chemicals. Scale economies and carbon-pricing schemes are narrowing the green premium to near single digits. As a result, the 1,3-propanediol (PDO) market is pivoting from early-adopter niches toward mainstream polymer applications where cost parity is within reach.
Growing PTT Fiber Adoption in Automotive and Apparel
Electric-vehicle lightweighting agendas are intensifying PTT fiber penetration into seating, headliners, and carpeting. Sorona fiber sales to automotive customers grew 22% year-over-year in 2025, with European OEMs responsible for 40% of incremental volume. PTT dyes at 100 °C versus 130 °C for polyester, trimming energy use by 30% and aligning with forthcoming EU eco-design rules[1]European Commission, “Ecodesign for Sustainable Products Regulation,” europa.eu . Athletic-apparel brands prize PTT’s elastic recovery, while premium home-textile suppliers tout the fiber’s softer hand. These performance advantages are translating into long-term supply contracts that lock in PDO offtake and buttress the 1,3-propanediol (PDO) market against price swings in commodity glycols.
Expansion of Polyurethane Foams and Insulation
North American and European building codes now impose higher R-value benchmarks that are spurring adoption of PDO-extended polyols. BASF’s technical data indicate that such polyols improve compressive strength by 12% compared with conventional EO-PO grades. The International Code Council increased mandated insulation performance by 15% in its 2024 energy code updates. Formulators value the inherent flame resistance of PDO-based foams that reach B-s1,d0 classification without halogenated additives restricted under REACH. This regulatory synergy continues to channel steady volume into the 1,3-propanediol (PDO) market.
Government Incentives for Biomass-Based Chemicals
The U.S. Inflation Reduction Act awards up to USD 1.75 per gasoline-equivalent gallon of avoided carbon for qualifying bio-chemicals, a measure that shaves 12-18 cents per kilogram from U.S. fermentation cash costs. Europe’s REPowerEU program allocates EUR 3 billion in loan guarantees and grants to derisk commercial-scale biorefineries. China’s 2024 VAT rebate on bio-based intermediates drops effective tax to near zero, further accelerating payback for new projects. These incentives are pulling several greenfield plants forward, uplifting near-term supply yet anchoring long-run competitiveness of the 1,3-propanediol (PDO) market.
Restraints Impact Analysis*
| Restraint | (~) % Impact on CAGR Forecast | Geographic Relevance | Impact Timeline |
|---|---|---|---|
| Feedstock (Corn/Glycerol) Price Volatility | -1.4% | Global, acute in North America (corn) and EU (glycerol) | Short term (≤ 2 years) |
| Cheaper Glycols as Functional Substitutes | -0.9% | Global, particularly in price-sensitive industrial applications | Medium term (2-4 years) |
| Biodiesel-Glycerol Supply Disruptions | -0.6% | North America and EU, spillover to APAC | Short term (≤ 2 years) |
| Source: Mordor Intelligence | |||
Feedstock Price Volatility
Corn prices swung between USD 4.20-5.80 per bushel during 2024-2025, causing as much as USD 0.08 per kilogram variance in bio-PDO cash cost. Crude-glycerol values whipsawed between USD 150-320 per ton as renewable-diesel expansions diverted feedstock from biodiesel. Such swings deter long-term offtake agreements, particularly with automotive tier-ones that demand 12-18-month cost certainty. The 1,3-propanediol (PDO) market remains exposed, although integrated players with hedged grain contracts are cushioning volatility.
Cheaper Glycols as Functional Substitutes
Ethylene glycol averaged USD 0.85 per kilogram in Asia during 2025, roughly 20%-30% below bio-PDO spot quotes. Propylene glycol carries U.S. FDA GRAS status, easing regulatory barriers in food and pharma niches. BASF reported that bio-based BDO costs slipped below USD 1.50 per kilogram in 2024, eroding PDO’s differentiation edge in polyurethane and engineering-plastic segments. Unless sustainability premiums deepen, price-sensitive buyers may lean on these incumbents, limiting upside for the 1,3-propanediol (PDO) market.
*Our forecasts treat driver/restraint impacts as directional, not additive. The impact forecasts reflect baseline growth, mix effects, and variable interactions.
Segment Analysis
By Source: Fermentation Maturity Extends Bio-Based Lead
Bio-based PDO held 59.78% market share in 2025 and is projected to outpace overall growth at an 8.93% CAGR through 2031. The 1,3-propanediol (PDO) market benefits from DuPont’s corn-to-PDO pathway that now delivers titers of 135 g/L and yields above 0.51 g/g glucose. Genomatica’s four active Asian licensees add 80 kilotons of capacity by 2027, diversifying global supply. Petrochemical PDO remains price competitive when Brent trades near USD 70 per barrel, yet mounting carbon levies are squeezing its cost advantage, particularly in Europe. Shell permanently exited petro-PDO production in Singapore in 2024, underscoring structural headwinds for fossil routes.
Captive monomer pull from PTT polymerization allows integrated bio-players to hedge spot risk and capture higher margins. Conversely, glycerol-route producers in China thrive on feedstock arbitrage, supplying industrial grades at double-digit discounts. These dynamics signal that the 1,3-propanediol (PDO) market is settling into a bio-centric growth arc with fossil supply relegated to price-driven niches.


By Purity Grade: Cosmetic and Pharma Specifications Accelerate Premium Tier
Industrial grade accounted for 71.35% volume in 2025, yet cosmetic and pharmaceutical grades are expanding at 9.88% CAGR to 2031. Updated European Pharmacopoeia monographs cap residual water at 0.1% and individual impurities below 50 ppm. Meeting these targets adds USD 0.30-0.50 per kilogram but earns 40-60% price premiums. L’Oréal reformulated 120 SKUs with bio-PDO during 2025 to align with clean-beauty positioning. The U.S. FDA’s inactive-ingredient database now lists PDO for both parenteral and oral applications, lowering regulatory barriers.
Industrial demand still dominates because PTT and polyurethane segments absorb bulk tonnage. Even so, the specialty-grade niche is forecast to supply an outsized share of incremental value. Sustained brand-owner pull suggests that high-purity grades will continue to elevate the value mix of the 1,3-propanediol (PDO) market.
By Application: PTT Retains Scale as Personal Care Surges
Polytrimethylene Terephthalate (PTT) captured 67.78% of 2025 demand, underpinning core volume for the 1,3-propanediol (PDO) market. PTT’s 95% elastic recovery and lower melt temperature cut processing energy by 8-12%, making it the polymer of choice for automotive carpet and performance apparel. Personal-care products, however, post the fastest 10.34% CAGR, buoyed by PDO’s 1.2-g/g water-binding capacity and lighter sensorial profile versus glycerin. Polyurethane foams are widening adoption due to PDO-based polyols that achieve flame-resistant ratings without halogens. Niche applications such as heat-transfer fluids and unsaturated polyester resins collectively remain below 10% share but offer differentiated margins.
The 1,3-propanediol (PDO) market size for PTT remains pivotal, yet faster-growing personal-care products are diversifying demand, trimming concentration risk and supporting value resilience.

By End-user Industry: Engineering Plastics Dominate as Textiles Accelerate
Engineering plastics held 49.78% share in 2025, leveraging PTT’s 80 J/m notched Izod impact strength and low thermal expansion to replace metal and nylon in automotive clips and consumer-appliance housings. Textile dyeing and finishing exhibits an 8.92% CAGR as PDO-based dispersants cut dyeing time by up to 20% and curb effluent volumes. Pharmaceutical formulators, meanwhile, rely on PDO to solubilize poorly water-soluble APIs, though volume remains modest.
Overall, the 1,3-propanediol (PDO) market share anchored in engineering plastics continues to fund R&D, while emerging end users expand the addressable base and hedge sectoral downturns.
Geography Analysis
North America accounted for 34.89% of 2025 revenue, a position underpinned by DuPont’s Tennessee biorefinery and favorable corn economics. Inflation Reduction Act credits shave production costs, reinforcing continental competitiveness[2]U.S. Department of Energy, “Bioenergy Technologies Office Update 2025,” energy.gov . Canadian producers are exploring a Saskatchewan project that leverages canola-derived glycerol feedstock. Mexico’s role remains downstream compounding. These factors ensure that the 1,3-propanediol (PDO) market retains a North American anchor even as growth moderates.
Asia-Pacific is projected to post a 10.67% CAGR to 2031, the fastest regional expansion. China’s Sheng Hong Group commissioned 50 kilotons of bio-PDO in 2024, feeding its captive PTT lines and exporting to Southeast Asian mills. Indian pharmaceutical demand is scaling at 18% annually as injectable generics gain global share. Japan and South Korea remain premium importers focused on cosmetics and specialty polymers. Thailand and Vietnam are emerging textile-auxiliary markets as garment production migrates from China. Collectively, these trends enlarge the 1,3-propanediol (PDO) market footprint in Asia-Pacific.
Europe represents a moderate share of demand, with Germany and France leading automotive and cosmetic demand. REPowerEU grants and REACH restrictions accelerate PDO adoption, especially in personal care where petrochemical glycols face tighter scrutiny. Scandinavia’s focus on circular materials further amplifies uptake. South America and the Middle East and Africa jointly represent a lower share, though Brazil’s sugarcane economy offers future optionality if fermentation costs fall. Overall, regional diversification supports stable global growth for the 1,3-propanediol (PDO) market.

Competitive Landscape
The market shows moderate concentration. DuPont, BASF, and Cargill control key fermentation IP and integrate downstream channels, giving them a pricing moat in premium grades. DuPont’s 63 kiloton facility runs near full rates and feeds its Sorona PTT line, insulating cash flow from spot swings. BASF pursues joint development with LG Chem to co-produce PDO-based polyols for automotive seating, leveraging BASF’s formulation expertise and LG’s regional reach. Cargill’s Primient brand targets cosmetic-grade demand under COSMOS certification.
Chinese challengers Zhangjiagang Glory and Sheng Hong compete on cost through glycerol routes and provincial subsidies. However, limited regulatory dossiers constrain their access to EU and U.S. personal-care markets. Genomatica’s licensing model democratizes access to optimized strains, enabling regional producers to bypass multi-year R&D cycles. Patent activity in 2024-2025 shows incumbent focus on PDO-based polyols and esters to expand into flame-retardant foams and biodegradable lubricants.
Heat-transfer fluids, pharma solubilizers, and specialty polyurethanes represent white-space opportunities. Rising Chinese capacity is compressing industrial-grade margins, pressuring Western incumbents to double down on sustainability certification and technical-service differentiation. The competitive equilibrium of the 1,3-propanediol (PDO) market therefore hinges on innovation pace and downstream integration depth.
1,3-Propanediol (PDO) Industry Leaders
Shell plc
Zhangjiagang Glory Biomaterial
Primient Covation LLC
Sheng Hong Group Holdings Limited
METabolic Explorer SA
- *Disclaimer: Major Players sorted in no particular order

Recent Industry Developments
- November 2025: Primient Covation LLC launched new hair color formulations incorporating Zemea propanediol. Zemea propanediol, a 100% plant-based 1,3-propanediol alternative to petroleum-derived diols, eliminated the need for ingredients such as propylene glycol and ammonia, thereby addressing environmental concerns.
- February 2025: MOJIABIO partnered with A*STAR to develop a sustainable biomanufacturing technology platform. This platform included commercial-scale fermentation lines for the production of 1,3-propanediol, focusing on improving sustainable manufacturing capabilities.


Research Methodology Framework and Report Scope
Market Definitions and Key Coverage
Our study defines the 1,3-propanediol market as the yearly value generated from fresh, merchant-grade PDO produced via biological fermentation of corn or glycerin-based feedstocks and through established petrochemical routes, delivered in bulk or packaged form to downstream polymer, personal-care, and specialty fluid converters.
Scope Exclusions: recycled PDO streams, captive in-house consumption that never enters trade channels, and laboratory reagent grades are outside this scope.
Segmentation Overview
- By Source
- Bio-based PDO
- Petrochemical-based PDO
- By Purity Grade
- Industrial Grade
- Cosmetic/Pharma Grade
- By Application
- Polytrimethylene Terephthalate (PTT)
- Polyurethane
- Personal Care Products
- Other Applications
- By End-user Industry
- Engineering Plastics
- Synthetic Drugs
- Textile Dyeing and Finishing
- Other End-User Industries (Cosmetics and Pharmaceutical)
- By Geography
- Asia-Pacific
- China
- India
- Japan
- South Korea
- ASEAN Countries
- Rest of Asia-Pacific
- North America
- United States
- Canada
- Mexico
- Europe
- Germany
- United Kingdom
- France
- Italy
- NORDIC Countries
- Rest of Europe
- South America
- Brazil
- Argentina
- Rest of South America
- Middle-East and Africa
- Saudi Arabia
- South Africa
- Rest of Middle-East and Africa
- Asia-Pacific
Detailed Research Methodology and Data Validation
Primary Research
Mordor analysts held structured calls with PDO plant managers in North America, polymer compounders in Europe, and Asian distributors, followed by a short survey of personal-care formulators. The discussions clarified average selling prices, regional demand pulses, and realistic ramp-up lags that secondary files alone could not capture.
Desk Research
We began with open government trade records (U.S. ITC HS 290532, Eurostat Comext), production statistics from the U.S. Energy Information Administration, patent families identified in Questel, and technical papers indexed on PubMed that track fermentation yield improvements. Company 10-Ks, investor decks, and association notes from the American Chemistry Council added operating capacity and utilization clues. Data rolls from D&B Hoovers and news flows archived on Dow Jones Factiva helped confirm expansion timelines. These sources are illustrative; many additional public and licensed repositories informed our desk work.
Market-Sizing & Forecasting
A top-down build starts with verified plant nameplate capacities, adjusts for quarterly utilization, and layers in net import balances to recreate 2025 apparent supply. Targeted bottom-up cross-checks, sampled contract ASP multiplied by disclosed shipment tonnage, temper the total. Key inputs include corn sugar prices, PTT production volumes, polyurethane resin output, cosmetic humectant adoption rates, and announced capacity additions. Five-year projections employ multivariate regression blended with scenario analysis, letting elasticity to GDP and polymer end-use growth steer the curve while experts validate turning points.
Data Validation & Update Cycle
Outputs pass a three-level peer review in which anomalies versus historical ratios or sudden divergences from trade data trigger rework. Before release, one analyst reruns the model with the newest customs and capacity updates. Full refreshes occur annually, and material events, such as plant outages and legislation, prompt interim updates.
Why Mordor's 1,3-Propanediol Market Baseline Stands Uniquely Reliable
Published figures often diverge because firms pick differing inclusions, price anchors, and refresh cadences. We acknowledge those gaps upfront so clients understand why totals vary.
Key gap drivers include: some publishers roll derivative blends into PDO value; others stretch forecasts from older 2020 bases without new primary checks; a few apply uniform global ASPs that ignore bio-premium differentials; refresh timing also skews results when large Asian plants start mid-year.
Benchmark comparison
| Market Size | Anonymized source | Primary gap driver |
|---|---|---|
| USD 434.28 Mn (2025) | Mordor Intelligence | |
| USD 691 Mn (2025) | Global Consultancy A | Relies on 2020 base scaled by fixed CAGR and bundles downstream polymer margins |
| USD 455.7 Mn (2024) | Trade Journal B | Counts select captive volumes and applies single global price point |
| USD 425.3 Mn (2025) | Regional Consultancy C | Limits coverage to North America and APAC, then extrapolates rest of world |
In sum, by pairing transparent scope, fresh primary intelligence, and dual-track validation, Mordor delivers a balanced baseline that decision-makers can trace back to clear variables and repeatable steps.


Key Questions Answered in the Report
What is the current value of the 1,3-propanediol (PDO) market?
The market is valued at USD 435.12 million in 2026 and is on track to reach USD 620.61 million by 2031.
Which segment is growing fastest within application?
Personal care products are expanding at a 10.34% CAGR due to demand for bio-based humectants.
Why is Asia-Pacific expected to lead future PDO growth?
New Chinese and Indian capacity, plus strong textile and pharmaceutical demand, drive a projected 10.67% regional CAGR.
How do government incentives influence PDO economics?
U.S., EU, and Chinese policies reduce production costs by up to 20 cents per kilogram, improving project paybacks and boosting capacity additions.
Page last updated on:


