Tamaño y participación del mercado de proteínas de Japón
Visión General del Mercado
| Período de Estudio | 2021 - 2031 |
|---|---|
| Período de Datos Pronosticados | 2026 - 2031 |
| Período de Datos Históricos | 2021 - 2024 |
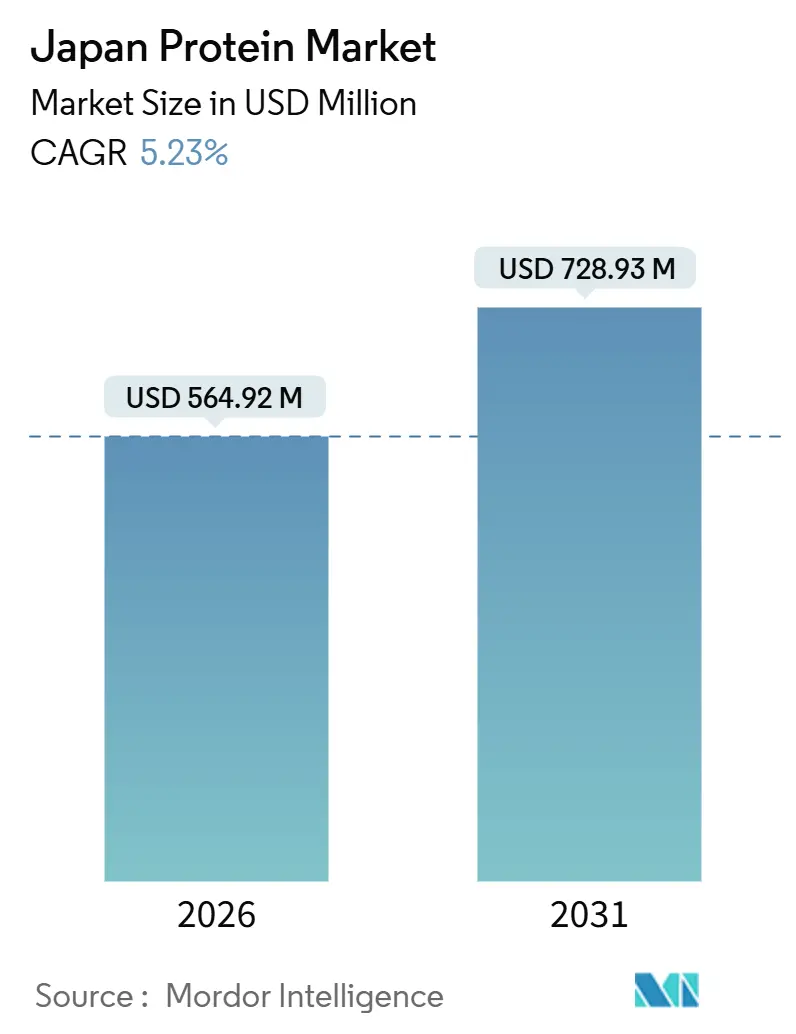
| Tamaño del Mercado (2026) | 564.92 Millones de dólares |
| Tamaño del Mercado (2031) | 728.93 Millones de dólares |
| Tasa de crecimiento (2026 - 2031) | 5.23% CAGR |
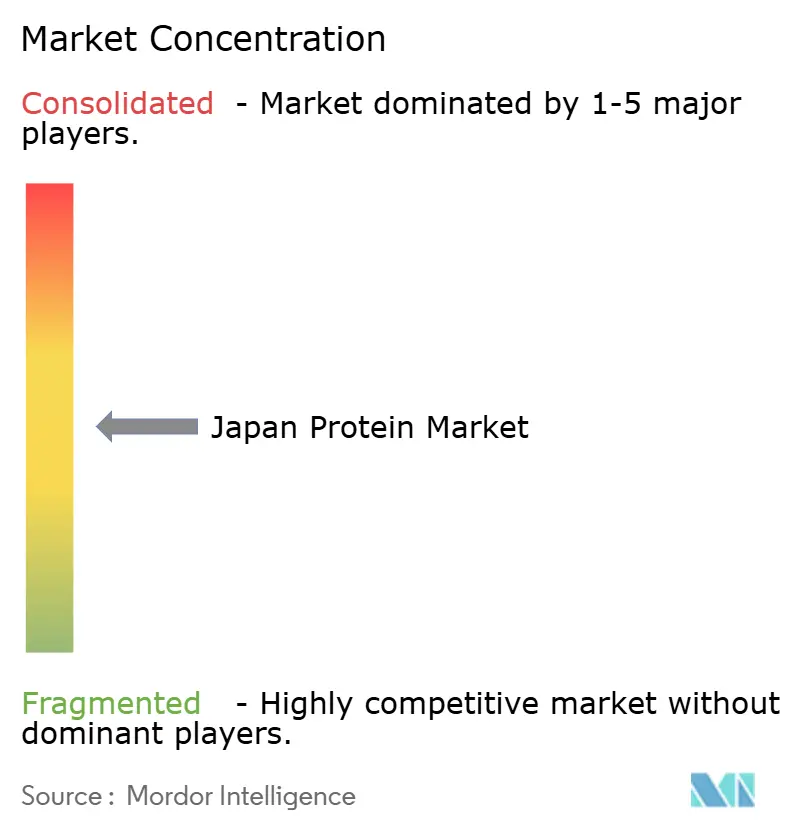
| Concentración del Mercado | Medio |
Jugadores principales *Nota aclaratoria: los principales jugadores no se ordenaron de un modo en especial Imagen © Mordor Intelligence. El uso requiere atribución según CC BY 4.0. | |
Análisis del mercado de proteínas de Japón por Mordor Intelligence
El tamaño del mercado de proteínas de Japón se estima en USD 564,92 millones en 2026 y se espera que alcance los USD 728,93 millones en 2031, a una CAGR del 5,23% durante el período de previsión (2026-2031). Este crecimiento refleja un cambio significativo en la forma en que se consume, posiciona e integra la proteína en la nutrición diaria. La expansión del mercado está impulsada por la evolución de la proteína, que ha pasado de ser un ingrediente de nicho orientado al rendimiento a convertirse en un componente fundamental de la salud preventiva y las dietas funcionales. Al mismo tiempo, los avances en tecnologías de procesamiento, ciencia de formulación y funcionalidad de ingredientes están mejorando la digestibilidad, el sabor y la versatilidad. Estas mejoras permiten integrar la proteína de forma fluida en una amplia variedad de ocasiones de consumo. Adicionalmente, el mercado se está adaptando a las expectativas de etiquetado limpio, las preocupaciones por la sostenibilidad y la demanda de nutrición científicamente validada. Estos factores están redefiniendo las estrategias de desarrollo de productos y fortaleciendo la confianza del consumidor.
Conclusiones clave del informe
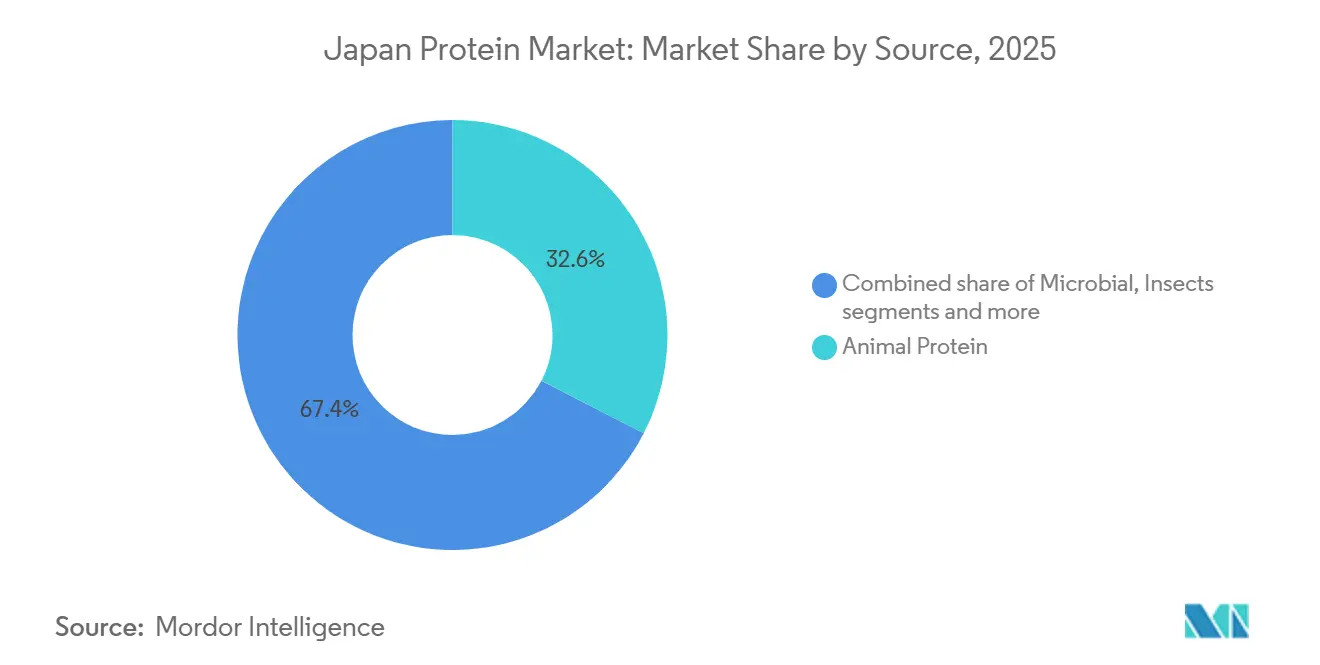
- Por tipo de fuente, la proteína animal representó el 32,56% de la participación del mercado de proteínas de Japón en 2025, mientras que se prevé que la proteína microbiana se expanda a una CAGR del 5,64% hasta 2031.
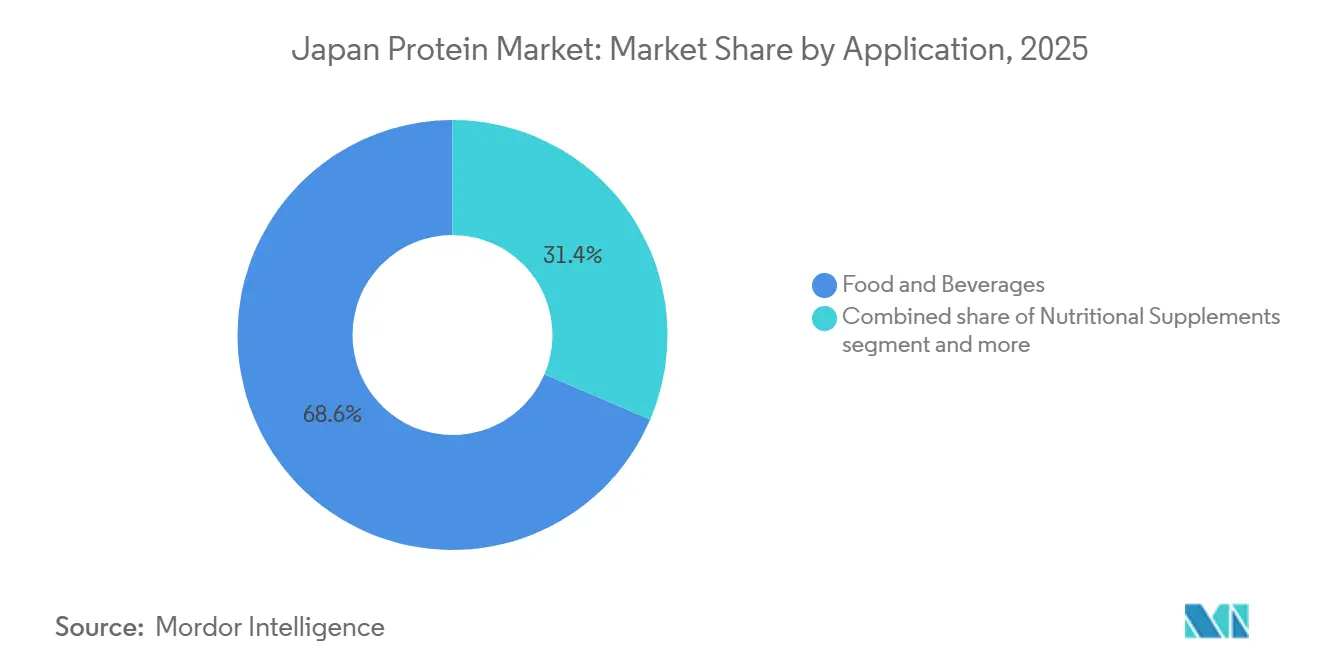
- Por aplicación, los alimentos y bebidas representaron el 68,58% del tamaño del mercado de proteínas de Japón en 2025, mientras que se proyecta que los cosméticos y el cuidado personal crezcan a una CAGR del 6,45% hasta 2031.
Nota: Las cifras del tamaño del mercado y los pronósticos de este informe se generan utilizando el marco de estimación patentado de Mordor Intelligence, actualizado con los datos y conocimientos más recientes disponibles a partir de enero de 2026.
Tendencias e información del mercado de proteínas de Japón
Análisis del impacto de los impulsores*
| Impulsor | (~) % de impacto en la previsión de la CAGR | Relevancia geográfica | Horizonte temporal del impacto |
|---|---|---|---|
| Sociedad en rápido envejecimiento y enfoque en la longevidad saludable | +1.2% | Nacional, con concentración en Tokio, Osaka y prefecturas rurales que experimentan un envejecimiento acelerado | Largo plazo (≥ 4 años) |
| Expansión de la cultura deportiva, del fitness y del estilo de vida activo | +0.9% | Nacional, con primeras ganancias en centros urbanos (Tokio, Yokohama, Nagoya) | Mediano plazo (2-4 años) |
| Preferencias de etiquetado limpio e ingredientes minimalistas | +0.7% | Nacional, más fuerte en áreas metropolitanas entre consumidores de 30 a 50 años | Mediano plazo (2-4 años) |
| Creciente demanda de productos proteicos de origen vegetal e híbridos | +0.8% | Nacional, con mayor adopción en Tokio, Kioto y Fukuoka | Mediano plazo (2-4 años) |
| Patrones de consumo nutricional impulsados por la conveniencia | +0.6% | Nacional, especialmente entre la población en edad laboral (25-55 años) | Corto plazo (≤ 2 años) |
| Cambio hacia proteínas de alta calidad y fácilmente digestibles | +0.7% | Nacional, con énfasis en la población de edad avanzada (65+ años) | Largo plazo (≥ 4 años) |
| Fuente: Mordor Intelligence | |||
Sociedad en rápido envejecimiento y enfoque en la longevidad saludable
La rápida evolución demográfica hacia el envejecimiento de la población y el énfasis nacional en la longevidad saludable son factores clave que impulsan el mercado de proteínas de Japón. La proteína dietética es cada vez más reconocida como vital para mantener la masa muscular, la movilidad, la función inmunitaria y la calidad de vida general entre los adultos mayores. La estructura demográfica de Japón, fuertemente sesgada hacia los grupos de mayor edad, intensifica la demanda de soluciones nutricionales dirigidas a condiciones relacionadas con el envejecimiento, como la sarcopenia, la fragilidad y la reducción de la eficiencia metabólica. Las dietas ricas en proteínas, suministradas a través de alimentos fortificados, bebidas funcionales, suplementos y nutrición médica, se promueven activamente para atender estas necesidades. Esta demanda está respaldada además por la preferencia de los consumidores de edad avanzada por formatos de proteína fáciles de consumir, altamente digestibles y clínicamente validados, como el suero de leche, los péptidos de colágeno y las mezclas de origen vegetal incorporadas a los alimentos cotidianos. La magnitud y urgencia de esta tendencia se ponen de manifiesto con los datos demográficos del Fondo de Población de las Naciones Unidas (UNFPA), que indica que las personas de 65 años o más representaron el 29,56% de la población de Japón en 2023, una de las proporciones más altas a nivel mundial [1]Fuente: Fondo de Población de las Naciones Unidas (UNFPA), "Proporción de personas de 65 años o más en la población total de Japón", unfpa.org. Esta realidad demográfica está impulsando a los fabricantes de alimentos, bebidas y nutrición a centrarse en la fortificación proteica y en formulaciones específicas para cada grupo de edad.
Expansión de la cultura deportiva, del fitness y del estilo de vida activo
El crecimiento de la cultura deportiva, del fitness y del estilo de vida activo constituye un importante impulsor estructural del mercado de proteínas de Japón. El consumo de proteínas se asocia cada vez más con el rendimiento físico, la recuperación muscular y la salud funcional general en diversos grupos de edad. Japón ha experimentado un cambio constante hacia el ejercicio regular, la participación en gimnasios, los deportes recreativos y las rutinas de acondicionamiento físico estructuradas. Este cambio de estilo de vida contribuye directamente al aumento de la demanda de productos de nutrición deportiva, incluidos los polvos de proteína de suero de leche y de origen vegetal. La proteína se posiciona ahora como una necesidad nutricional diaria más que como un suplemento especializado para el culturismo, ampliando su atractivo entre trabajadores de oficina, atletas recreativos e individuos con conciencia de salud. En apoyo de esta tendencia, datos del Ministerio de Economía, Comercio e Industria (METI) indican que Japón contaba con aproximadamente 2,88 millones de miembros de clubes de fitness en 2024, lo que subraya la escala de la participación organizada en actividades físicas en el país [2]Fuente: Ministerio de Economía, Comercio e Industria (METI), "Número de miembros de clubes de fitness en Japón", meti.go.jp. Este ecosistema de fitness en expansión está promoviendo el consumo constante de proteínas como parte de los hábitos de un estilo de vida activo. En consecuencia, los fabricantes se centran cada vez más en la innovación en este espacio.
Preferencias de etiquetado limpio e ingredientes minimalistas
Las preferencias por el etiquetado limpio y los ingredientes minimalistas se están convirtiendo en un impulsor significativo del mercado de proteínas de Japón, reflejo del fuerte enfoque de los consumidores del país en la transparencia, la seguridad y la simplicidad en sus elecciones de alimentos y nutrición. Los consumidores japoneses examinan cada vez más las listas de ingredientes y favorecen los productos proteicos que excluyen aditivos artificiales, sabores sintéticos, edulcorantes en exceso y componentes químicos complejos. Esta tendencia se alinea con la cultura alimentaria tradicional de Japón, que enfatiza la pureza, los ingredientes naturales y los beneficios funcionales por encima de las formulaciones altamente procesadas. En consecuencia, los fabricantes de proteínas están reformulando sus productos para incluir listas de ingredientes más cortas, materias primas fácilmente reconocibles y fuentes de proteínas claramente identificadas, como el suero de leche, la soja, el colágeno marino y las proteínas derivadas de la fermentación. El posicionamiento de etiquetado limpio es particularmente impactante en categorías como alimentos funcionales, bebidas proteicas listas para beber, productos de nutrición para personas mayores y suplementos de belleza desde el interior, donde la confianza y la seguridad percibida desempeñan un papel fundamental en las decisiones de compra.
Creciente demanda de productos proteicos de origen vegetal e híbridos
La creciente demanda de productos proteicos de origen vegetal e híbridos es un factor clave que influye en el desarrollo del mercado de proteínas de Japón. Los consumidores buscan cada vez más soluciones nutricionales que ofrezcan beneficios para la salud, sostenibilidad y flexibilidad dietética. Si bien la proteína animal sigue siendo un alimento básico en las dietas tradicionales, existe una creciente aceptación de las proteínas de origen vegetal, como la soja, los guisantes, el arroz y las algas, especialmente cuando se comercializan como complementos en lugar de sustitutos completos. Esta tendencia ha impulsado el auge de las formulaciones de proteínas híbridas, que combinan proteínas vegetales con proteínas de origen animal como el suero de leche o el colágeno. Estas formulaciones tienen como objetivo mejorar los perfiles de aminoácidos, la digestibilidad y el sabor, al tiempo que reducen la dependencia de proteínas de fuente única. Además, la creciente conciencia sobre la salud digestiva, el manejo del colesterol y la sostenibilidad ambiental está alentando a los consumidores a diversificar sus fuentes de proteínas. Los fabricantes de alimentos y bebidas responden activamente a estos cambios en las preferencias de los consumidores mediante la innovación en nuevas ofertas de productos, la reformulación de los existentes y la inversión en investigación para satisfacer las demandas en constante evolución del mercado.
Análisis del impacto de las restricciones*
| Restricción | (~) % de impacto en la previsión de la CAGR | Relevancia geográfica | Horizonte temporal del impacto |
|---|---|---|---|
| Desafíos de aceptación sensorial en cuanto a sabor, textura y experiencia organoléptica | -0.8% | Nacional, con especial incidencia en los segmentos de proteínas de origen vegetal y de insectos | Mediano plazo (2-4 años) |
| Sensibilidad digestiva entre los consumidores de edad avanzada | -0.7% | Nacional, concentrada en la población de 65 años o más | Largo plazo (≥ 4 años) |
| Complejidad regulatoria para reclamaciones funcionales y de salud | -0.6% | Nacional, que afecta a todos los ingredientes proteicos novedosos y las reclamaciones funcionales | Mediano plazo (2-4 años) |
| Escasa conciencia sobre el consumo de proteínas en relación con las normas dietéticas | -0.4% | Nacional, más pronunciada en áreas rurales y entre la población de edad avanzada | Largo plazo (≥ 4 años) |
| Fuente: Mordor Intelligence | |||
Desafíos de aceptación sensorial en cuanto a sabor, textura y experiencia organoléptica
Los desafíos de aceptación sensorial en cuanto a sabor, textura y experiencia organoléptica constituyen restricciones significativas en el mercado de proteínas de Japón, dado que las decisiones de compra de los consumidores están fuertemente influenciadas por la autenticidad del sabor, la sensación en boca y la experiencia gastronómica general. Los consumidores japoneses son muy exigentes en cuanto a la calidad sensorial y esperan que los productos enriquecidos con proteínas cumplan los mismos estándares que los alimentos tradicionales en términos de sabor, aroma y textura. Muchas formulaciones proteicas, en particular las de origen vegetal, microbiano e híbrido, presentan problemas como amargor, notas desagradables terrosas o a legumbres, sensación harinosa en la boca o excesiva densidad, lo que puede desincentivar las compras repetidas. Estos desafíos sensoriales son especialmente pronunciados en bebidas listas para beber, productos de panadería y aperitivos funcionales, donde la incorporación de proteínas puede alterar el equilibrio de textura y sabor. Además, los consumidores de edad avanzada, un grupo demográfico clave para los alimentos fortificados con proteínas, son especialmente sensibles a la textura y la palatabilidad, prefiriendo formatos suaves, suaves al paladar y fáciles de tragar, lo que limita la flexibilidad en la formulación.
Complejidad regulatoria para reclamaciones funcionales y de salud
La complejidad regulatoria en torno a las reclamaciones funcionales y de salud supone una restricción significativa para el mercado de proteínas de Japón. Japón aplica uno de los marcos regulatorios más estrictos y detallados del mundo en materia de alimentos, suplementos e ingredientes funcionales. Los productos proteicos comercializados con beneficios para la salud, funcionales o preventivos deben adherirse a diversas vías regulatorias, incluidos los Alimentos para Usos de Salud Específicos (FOSHU), los Alimentos con Reclamaciones de Función (FFC) y las normas generales de etiquetado de alimentos. Cada vía requiere una extensa sustentación y documentación científica, lo que genera desafíos significativos para los fabricantes. Esta complejidad suele dar lugar a procesos de aprobación prolongados, altos costes de cumplimiento y menor flexibilidad en la comunicación de marketing, especialmente para fuentes de proteínas emergentes como las microbianas, las de insectos o las híbridas. Además, la necesidad de navegar por regulaciones superpuestas y garantizar el cumplimiento de estándares en constante evolución complica aún más la entrada al mercado. Los fabricantes deben alinear cuidadosamente las reclamaciones científicamente precisas con los requisitos regulatorios, lo que puede diluir los mensajes dirigidos al consumidor, dificultar la diferenciación del producto y frenar la innovación en el mercado.
*Nuestras previsiones consideran los impactos de impulsores y restricciones como direccionales, no aditivos. Las previsiones de impacto reflejan el crecimiento base, los efectos de mezcla y las interacciones entre variables.
Análisis de segmentos
Por tipo de fuente: la fermentación impulsa las proteínas de próxima generación
En 2025, la proteína animal representó una participación sustancial del 32,56% del mercado de proteínas de Japón, lo que pone de manifiesto su preferencia continua entre los consumidores japoneses. Esta predominancia se atribuye en gran medida a la percepción de las proteínas animales, como el suero de leche, la caseína, el colágeno y las proteínas del huevo, como proteínas de alta calidad y completas que suministran todos los aminoácidos esenciales necesarios para el desarrollo muscular, la recuperación y la salud en general. La envejecida población de Japón impulsa aún más la demanda, ya que los adultos mayores adoptan cada vez más dietas ricas en proteínas para combatir la sarcopenia y mantener la salud ósea y muscular. Además, la creciente tendencia del fitness y la nutrición deportiva ha reforzado el consumo de proteína animal, con los usuarios de gimnasios, atletas e individuos activos que prefieren los suplementos a base de suero de leche y caseína por sus beneficios en la reparación muscular y la energía sostenida.
La proteína microbiana emerge como el segmento de más rápido crecimiento en el mercado de proteínas de Japón, con una CAGR proyectada del 5,64% hasta 2031. Este crecimiento está impulsado por su alineación con las prioridades de Japón en seguridad alimentaria, sostenibilidad e innovación tecnológica. Los avances en biotecnología y procesos de fermentación han permitido la producción eficiente de proteínas de alta pureza a partir de microorganismos como levaduras, hongos, bacterias y algas. A diferencia de la proteína animal tradicional, la proteína microbiana ofrece calidad constante, condiciones de producción controladas y menor susceptibilidad a la variabilidad agrícola, lo que la hace muy adecuada para aplicaciones a escala industrial. La expansión del segmento está respaldada además por el sólido ecosistema de Investigación y Desarrollo (I+D) de Japón y las iniciativas gubernamentales que promueven el desarrollo de proteínas alternativas como parte de los sistemas alimentarios del futuro.


Por aplicación: los cosméticos superan a los alimentos en crecimiento
En 2025, el segmento de alimentos y bebidas representó una participación de mercado significativa del 68,58%, consolidando su posición como piedra angular del mercado de proteínas de Japón. Esta predominancia se atribuye a la integración generalizada de la proteína en los hábitos dietéticos diarios, ya que los consumidores priorizan cada vez más la mejora nutricional a través del consumo regular de alimentos en lugar de suplementos independientes. Los alimentos y bebidas enriquecidos con proteínas son favorecidos por su conveniencia, familiaridad y facilidad de incorporación en las rutinas diarias. La creciente demanda de alimentos funcionales y orientados a la salud ha impulsado aún más la inclusión de proteínas como ingrediente clave, alineándose con las preferencias de los consumidores por la nutrición preventiva y las dietas equilibradas. Los fabricantes se centran en formulaciones de etiquetado limpio, perfiles de sabor mejorados y beneficios multifuncionales, lo que permite integrar la proteína de manera fluida en productos alimentarios y de bebidas de uso general.
El segmento de cosméticos y cuidado personal es la aplicación de más rápido crecimiento en el mercado de proteínas de Japón, con una proyección de expansión a una CAGR del 6,45% hasta 2031. Este crecimiento está impulsado principalmente por el uso creciente de péptidos de colágeno marino en el cuidado de la piel antienvejecimiento, formulaciones para el cuidado del cabello y suplementos de belleza ingeribles. La sólida cultura de "belleza desde el interior" de Japón ha fomentado la convergencia de la nutrición y los cosméticos, posicionando los ingredientes a base de proteínas como componentes esenciales. Estas proteínas se utilizan cada vez más en sérums antienvejecimiento de alta gama debido a su alta biodisponibilidad, perfil sensorial limpio y la sólida confianza de los consumidores en los ingredientes de origen marino. El crecimiento del segmento está respaldado además por la tendencia de premiumización de Japón en el cuidado personal, donde los consumidores buscan activamente formulaciones científicamente validadas, funcionales y antienvejecimiento frente a las soluciones cosméticas convencionales. Esta tendencia se refleja en los datos comerciales, ya que Aduanas de Japón informó que el valor de importación de cosméticos a Japón alcanzó aproximadamente 446,1 mil millones de JPY en 2024, lo que subraya la sólida demanda de productos cosméticos avanzados y de alto valor que incorporan cada vez más activos a base de proteínas [3]Fuente: Aduanas de Japón, "Valor de importación de cosméticos a Japón", customs.go.jp.
Análisis geográfico
El mercado de proteínas de Japón muestra diferencias regionales significativas, influenciadas por las variaciones en los perfiles demográficos, la concentración industrial, la infraestructura minorista y las preferencias de estilo de vida. Las áreas urbanas se benefician de poblaciones densas, sistemas de distribución avanzados y una mayor exposición a alimentos funcionales, nutrición deportiva y productos premium de bienestar. Por el contrario, las regiones rurales muestran patrones de demanda centrados en la nutrición relacionada con el envejecimiento y la suplementación dietética esencial. Estas disparidades regionales afectan a los volúmenes de consumo, los formatos de producto preferidos, las fuentes de proteínas y la adopción de innovaciones, lo que da lugar a una estructura de mercado geográficamente diversa.
El Área Metropolitana de Tokio, junto con Osaka y la región de Kansai, constituye el principal centro de demanda del mercado de proteínas. La alta urbanización, el comportamiento de compra frecuente y la rápida adopción de tendencias nutricionales caracterizan estas áreas metropolitanas. Los centros de fitness, los minoristas especializados, los puntos de venta de alimentos de conveniencia y los canales de servicios de alimentación orientados a la innovación se concentran en estas regiones, impulsando una fuerte demanda de alimentos enriquecidos con proteínas, bebidas listas para beber y productos nutricionales orientados al estilo de vida. Los consumidores del Japón urbano muestran preferencia por las proteínas híbridas, las formulaciones de etiquetado limpio y las declaraciones funcionales relacionadas con el rendimiento, la belleza y la salud preventiva. Estos factores posicionan las áreas urbanas como terrenos de prueba clave para nuevos conceptos de proteínas y ofertas premium.
Por el contrario, regiones como Hokkaido y prefecturas rurales, incluidas áreas de envejecimiento intensivo como Akita y Shimane, muestran patrones de demanda centrados en necesidades nutricionales más que en preferencias de estilo de vida. Estas áreas enfrentan un envejecimiento poblacional acelerado y una diversificación minorista limitada, lo que lleva a una mayor dependencia de alimentos básicos fortificados con proteínas, productos de nutrición clínica y formatos fácilmente digestibles diseñados para el mantenimiento muscular y la salud general. Aunque la adopción de innovaciones es más lenta en estas regiones, siguen siendo centros de demanda críticos para la nutrición funcional y médica, destacando el papel de la proteína en el abordaje de los desafíos demográficos a largo plazo de Japón.
Panorama competitivo
El mercado de proteínas de Japón está moderadamente concentrado, con un número limitado de proveedores de ingredientes multinacionales que operan junto a sólidos especialistas nacionales. Los actores clave del mercado incluyen Archer Daniels Midland Company, Arla Foods amba, Bunge Limited, Fuji Oil Holdings Inc. y Darling Ingredients Inc. Estas empresas aprovechan cadenas de suministro integradas verticalmente, carteras diversificadas de proteínas y experiencia técnica para atender diversas aplicaciones de uso final, incluidos alimentos y bebidas, nutrición, cosméticos y formulaciones farmacéuticas.
Dentro del mercado, están surgiendo oportunidades en formatos de proteínas híbridas que combinan proteínas de origen vegetal y animal. Estos formatos proporcionan perfiles completos de aminoácidos al tiempo que mantienen el sabor, la textura y la digestibilidad. Este enfoque atrae a los consumidores flexitarianos que priorizan el equilibrio nutricional y la sostenibilidad, pero que aún no están preparados para adoptar plenamente las dietas de origen vegetal. Las proteínas híbridas ayudan a los proveedores a abordar los desafíos sensoriales asociados con las formulaciones de fuente única, manteniendo al mismo tiempo la confianza y la familiaridad del consumidor.
Los avances tecnológicos están redefiniendo la dinámica competitiva, con énfasis en el procesamiento avanzado y la innovación funcional. Las tecnologías de hidrólisis enzimática y fermentación permiten a los proveedores fraccionar las proteínas en péptidos bioactivos con beneficios para la salud específicos, como el mantenimiento muscular, la salud cutánea, el soporte digestivo y la función metabólica. Estas innovaciones permiten que los ingredientes proteicos transiten de productos nutricionales básicos a aplicaciones de alto valor respaldadas por la ciencia, mejorando la relevancia de los proveedores en alimentos funcionales, productos de belleza desde el interior y nutrición clínica.
Líderes de la industria de proteínas de Japón
Archer Daniels Midland Company
Arla Foods amba
Bunge Limited
Fuji Oil Holdings Inc.
Darling Ingredients Inc.
- *Nota aclaratoria: los principales jugadores no se ordenaron de un modo en especial

Desarrollos recientes en la industria
- Septiembre de 2025: Leaft Foods ha colaborado con Lacto Japan, distribuidor y productor de ingredientes alimentarios especializados, para avanzar en la comercialización de su innovador Aislado de Proteína de Rubisco para su uso en la fabricación de alimentos en Japón.
- Febrero de 2025: Kinish, una empresa especializada en agricultura molecular vegetal para producir proteínas de leche, ha recaudado 120 millones de JPY en una ronda de financiación semilla. Los fondos se utilizarán para avanzar en los esfuerzos de investigación y desarrollo en la producción de caseína y las operaciones de fábricas vegetales.


Alcance del informe del mercado de proteínas de Japón
Los ingredientes proteicos se derivan de diversas fuentes animales, vegetales y microbianas que se utilizan frecuentemente para mejorar las propiedades funcionales de alimentos, bebidas, productos de cuidado personal y alimentación animal.
El mercado de proteínas de Japón está segmentado en función de la fuente y la aplicación. Según la fuente, el mercado se segmenta en animal, microbiano, insectos y vegetal. Según la aplicación, el mercado se segmenta en alimentos y bebidas, suplementos nutricionales, alimentación animal, cosméticos y cuidado personal, productos farmacéuticos y otros.
El informe proporciona el tamaño del mercado y las previsiones tanto en valor (USD) como en volumen (toneladas) para todos los segmentos mencionados.
| Animal |
| Microbiana |
| Insectos |
| Vegetal |
| Alimentos y bebidas |
| Suplementos nutricionales |
| Alimentación animal |
| Cosméticos y cuidado personal |
| Farmacéutica |
| Otros |
| Por tipo de fuente | Animal |
| Microbiana | |
| Insectos | |
| Vegetal | |
| Por aplicación | Alimentos y bebidas |
| Suplementos nutricionales | |
| Alimentación animal | |
| Cosméticos y cuidado personal | |
| Farmacéutica | |
| Otros |


Preguntas clave respondidas en el informe
¿Cuál es el tamaño del mercado de proteínas de Japón en 2026?
El tamaño del mercado de proteínas de Japón alcanzó los USD 564,92 millones en 2026 y se proyecta que continúe creciendo a una CAGR del 5,23%.
¿Qué tipo de fuente se expande con mayor rapidez?
La proteína microbiana es la fuente de más rápido crecimiento, con una previsión de aumento a una CAGR del 5,64% hasta 2031 a medida que se amplía la capacidad de fermentación.
¿Por qué el colágeno es popular en Japón?
El colágeno marino proveniente de pieles de salmón y atún ofrece una alta biodisponibilidad y se alinea con las tendencias de belleza desde el interior, impulsando una fuerte demanda en cosméticos y suplementos.
¿Cuál es la principal barrera para la adopción de proteínas vegetales?
Los desafíos sensoriales, como el sabor a legumbres y la textura arenosa, limitan las tasas de incorporación, aunque las tecnologías de enmascaramiento están mejorando la aceptación.
Última actualización de la página el:


