
Market Overview
| Study Period | 2020 - 2031 |
|---|---|
| Forecast Data Period | 2026 - 2031 |
| Base Year Market Size (2025) | USD 51.88 Billion |
| Market Size (2026) | USD 53.55 Billion |
| Market Size (2031) | USD 62.81 Billion |
| Growth Rate (2026 - 2031) | 3.23 % |
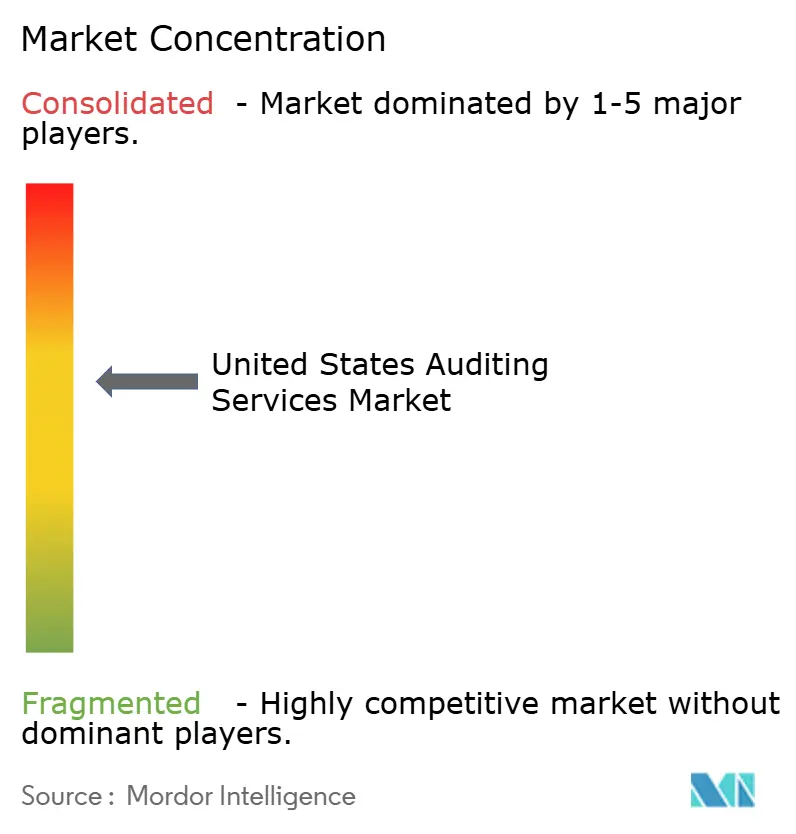
| Market Concentration | Medium |
Major Players *Disclaimer: Major Players sorted in no particular order Image © Mordor Intelligence. Reuse requires attribution under CC BY 4.0. | |
United States Auditing Services Market Analysis by Mordor Intelligence
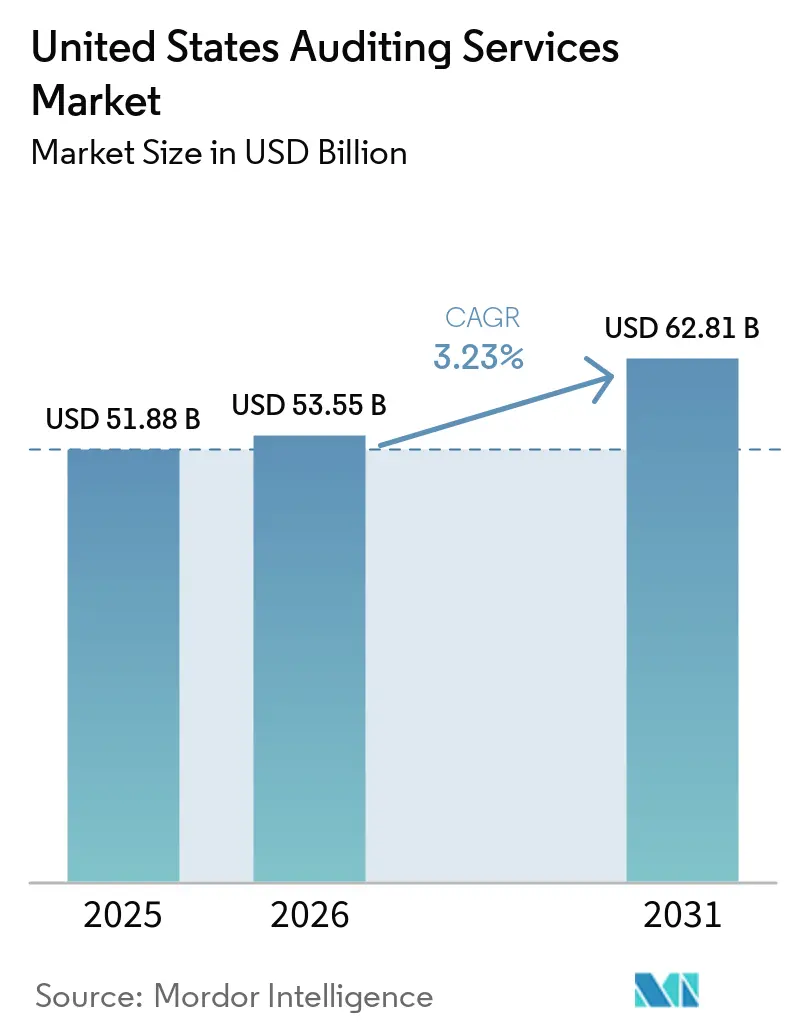
The United States auditing services market size in 2026 is estimated at USD 53.55 billion, growing from 2025 value of USD 51.88 billion with 2031 projections showing USD 62.81 billion, growing at 3.23% CAGR over 2026-2031. This growth trajectory reflects the United States auditing services market transition from a compliance-centric model toward integrated assurance that covers cybersecurity, ESG disclosures, and operational risk. Intensifying SEC oversight of internal controls, mounting cyber threats, and mandatory sustainability assurance are combining to lift demand, while automation platforms and offshore delivery temper pricing power. The United States auditing services market is further buoyed by federal infrastructure spending that triggers single-audit requirements, although labor shortages and fee pressure from analytics-driven efficiency gains remain structural brakes. External audit commands 63.63% revenue in 2025, but internal audit services, strengthened by continuous monitoring technologies and enterprise risk management adoption, are advancing at a 9.15% CAGR through 2031. Information-system auditing is growing fastest within service lines as clients integrate IT control testing into statutory audits.
Key Report Takeaways
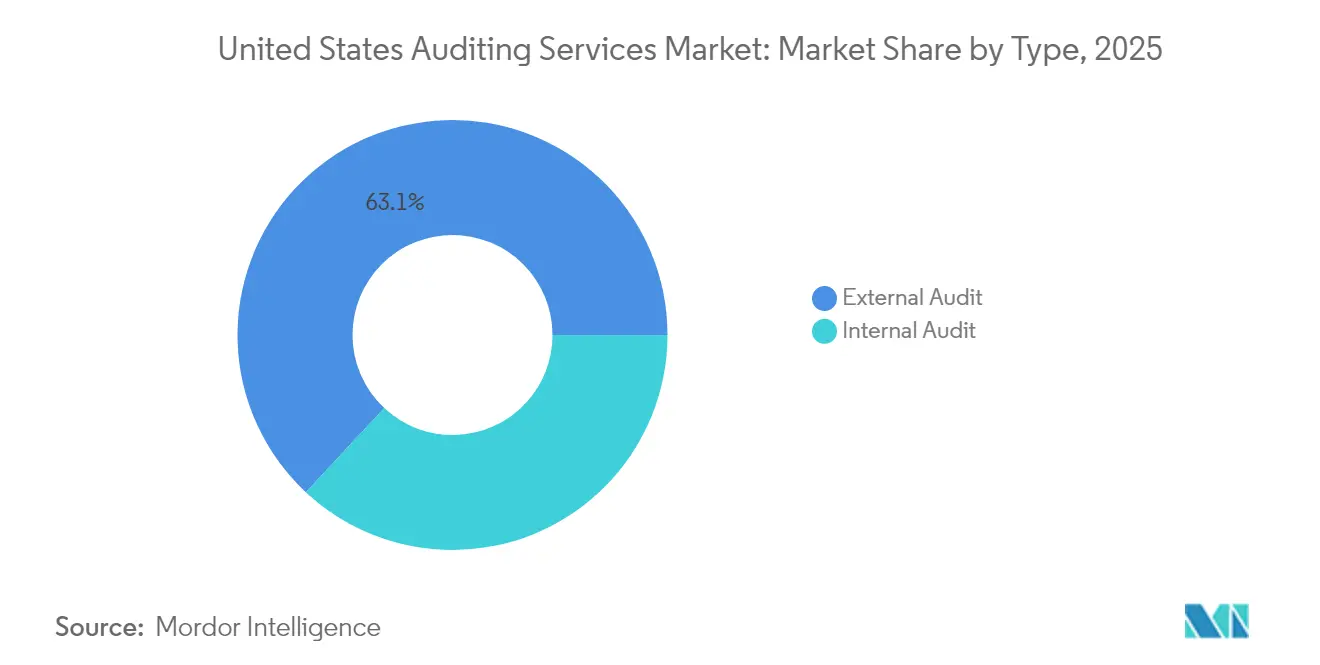
- By type, external audit captured 63.05% of the United States auditing services market share in 2025, while internal audit is on track for a 8.72% CAGR through 2031.
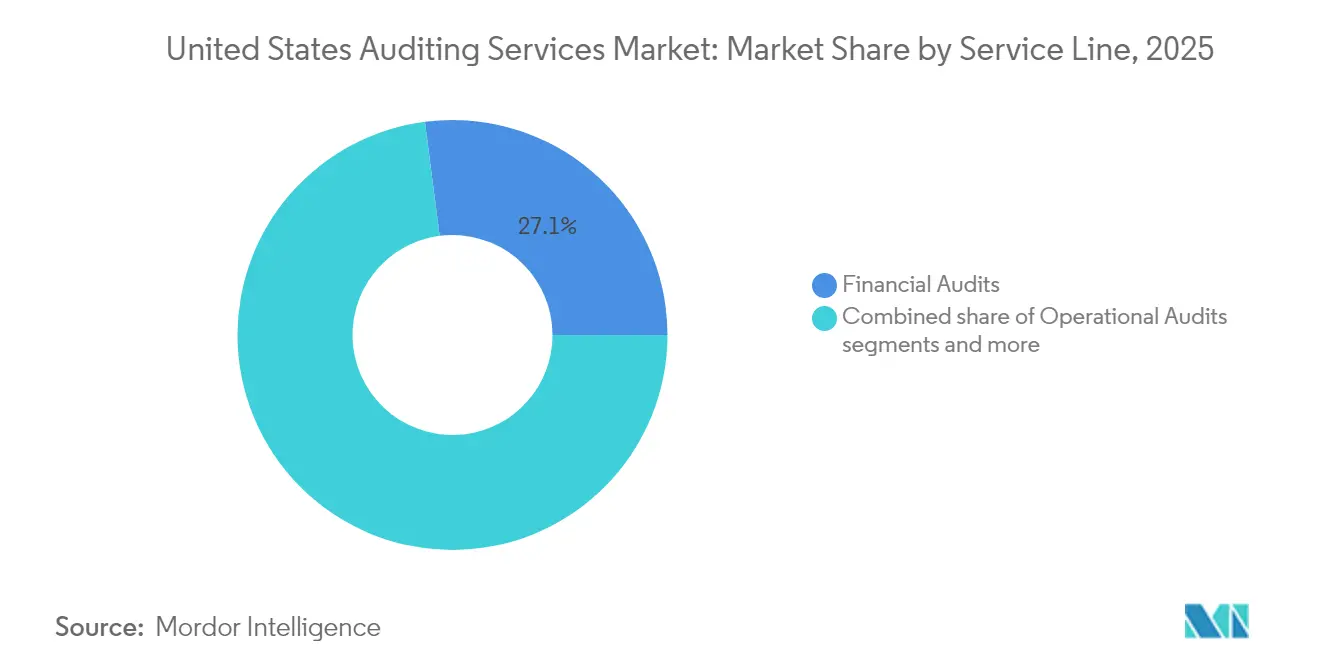
- By service line, financial audits led with 27.05% of the United States auditing services market size in 2025, whereas information-system audits are poised to grow at a 12.18% CAGR to 2031.
- By end-user industry, the BFSI segment commanded 22.10% of the United States auditing services market size in 2025, but IT & telecommunications is projected to register the highest 8.29% CAGR between 2026 and 2031.
- By geography, the South accounted for 29.05% of the United States auditing services market size in 2025, while the West is forecast to record a 6.88% CAGR through 2031.
Note: Market size and forecast figures in this report are generated using Mordor Intelligence’s proprietary estimation framework, updated with the latest available data and insights as of 2026.
United States Auditing Services Market Trends and Insights
Drivers Impact Analysis*
| Driver | (~) % Impact on CAGR Forecast | Geographic Relevance | Impact Timeline |
|---|---|---|---|
| Heightened SEC enforcement of internal-control rules | 0.8% | National, concentrated in major financial centers | Medium term (2-4 years) |
| Rising cyber-risk demanding integrated IT audits | 0.6% | National, with higher impact in tech-heavy regions | Short term (≤ 2 years) |
| Mandatory ESG-related assurance for listed firms | 0.4% | National, with early adoption in California and Northeast | Medium term (2-4 years) |
| Rapid adoption of continuous audit analytics platforms | 0.3% | National, led by large metropolitan areas | Short term (≤ 2 years) |
| SME demand for SOC 2 Type II attestation to win SaaS contracts | 0.2% | West Coast and Northeast technology corridors | Short term (≤ 2 years) |
| Expansion of federal infrastructure spend triggering single-audit requirements | 0.1% | National, with concentration in infrastructure-heavy states | Long term (≥ 4 years) |
| Source: Mordor Intelligence | |||
Heightened SEC Enforcement of Internal-Control Rules
The Securities and Exchange Commission's intensified focus on internal control deficiencies is reshaping audit scope and methodology requirements across public companies. SEC enforcement actions increased 22% in 2024, with particular emphasis on management's assessment of internal control over financial reporting and auditor testing procedures [1]. This regulatory pressure creates sustained demand for external audit services as companies invest in control remediation and enhanced testing protocols. The PCAOB's expanded inspection focus on audit quality indicators and risk assessment procedures forces audit firms to allocate additional resources to control testing, directly impacting billable hours and engagement profitability while strengthening market demand for specialized internal control advisory services.
Rising Cyber-Risk Demanding Integrated IT Audits
Cybersecurity incidents affecting financial reporting systems have prompted regulators and audit committees to demand integrated IT audit procedures within traditional financial audits. The SEC's cybersecurity disclosure rules, effective December 2023, require public companies to disclose material cybersecurity incidents within 4 business days, creating audit implications for subsequent financial reporting periods. Audit firms are rapidly expanding their IT audit capabilities, with KPMG investing over USD 1 billion in audit technology platforms that integrate cybersecurity risk assessment with financial audit procedures. This convergence of financial and IT auditing creates new revenue streams while requiring significant upfront investment in specialized talent and technology platforms.
Mandatory ESG-Related Assurance for Listed Firms
The SEC's climate disclosure rules, adopted in March 2024, establish the first federal mandate for sustainability-related assurance services, fundamentally expanding the addressable audit market beyond traditional financial reporting. Large accelerated filers must obtain limited assurance over Scope 1 and 2 greenhouse gas emissions beginning in 2029, with reasonable assurance required by 2033 [2]. This regulatory shift creates an estimated USD 2-3 billion annual market opportunity for specialized ESG assurance services, though current provider capacity remains severely constrained. The intersection of financial reporting and sustainability metrics requires audit firms to develop new competencies in environmental data verification, carbon accounting methodologies, and climate risk assessment procedures.
Rapid Adoption of Continuous Audit Analytics Platforms
Artificial intelligence and machine learning technologies are enabling real-time audit testing capabilities that expand traditional audit scope while improving efficiency metrics. EY's deployment of its EYQ artificial intelligence platform across 180 countries, with over 75% of staff utilizing the technology for audit procedures, demonstrates the sector's rapid technology adoption. These platforms enable continuous monitoring of financial transactions, automated exception testing, and predictive risk analytics that identify potential misstatements before traditional year-end audit procedures. The technology shift allows audit firms to offer enhanced services while maintaining competitive pricing, though initial implementation costs and training requirements create near-term margin pressure for adopting firms.
Restraints Impact Analysis*
| Restraint | (~) % Impact on CAGR Forecast | Geographic Relevance | Impact Timeline |
|---|---|---|---|
| Talent shortages inflating bill rates | -0.4% | National, acute in metros | Short term (≤ 2 years) |
| Automation reducing repeat audit hours | -0.3% | National, tech-forward firms | Medium term (2-4 years) |
| Growing use of internal shared-service centers | -0.2% | National, more prevalent among large firms | Medium term (2–4 years) |
| Litigation exposure and rising E&O insurance premiums | -0.3% | National, with concentration in litigious sectors | Short term (≤ 2 years) |
| Source: Mordor Intelligence | |||
Talent Shortages Driving Bill-Rate Inflation
The accounting profession faces an unprecedented talent crisis with CPA exam candidates declining 17% between 2020 and 2024, while demand for audit services continues to expand. This supply-demand imbalance has driven audit staff compensation increases of 15-25% annually, forcing firms to raise client billing rates and potentially pricing out smaller clients from professional audit services. The shortage particularly affects experienced senior and manager-level professionals, creating bottlenecks in audit execution and quality review processes. Firms are responding through accelerated offshore delivery models, increased automation, and alternative staffing arrangements, though these solutions require 2-3 years to fully implement and may not fully offset domestic talent constraints.
Automation Reducing Repeat Audit Hours
Advanced audit technologies are systematically eliminating routine testing procedures that historically generated substantial billable hours, creating deflationary pressure on traditional audit engagement economics. Data analytics platforms can now perform comprehensive transaction testing in hours rather than weeks, while artificial intelligence algorithms identify anomalies and risk patterns that previously required extensive manual procedures [3]. This efficiency gain benefits clients through reduced audit fees but pressures firm profitability unless offset by expanded service offerings or premium pricing for specialized expertise. The transition forces audit firms to shift from time-based billing toward value-based pricing models while investing heavily in technology infrastructure and staff retraining programs.
*Our forecasts treat driver/restraint impacts as directional, not additive. The impact forecasts reflect baseline growth, mix effects, and variable interactions.
Segment Analysis
By Type: Internal Audit Transformation Accelerates
Internal audit services are experiencing rapid growth at 8.72% CAGR through 2031, significantly outpacing external audit's more modest expansion, as organizations recognize internal audit's strategic value beyond traditional compliance functions. External audit maintains market dominance with 63.05% share in 2025, reflecting regulatory requirements for public company audits and the substantial revenue base of Big Four firms serving large corporate clients. The internal audit segment's acceleration reflects enterprise demand for continuous risk monitoring, operational efficiency assessments, and integrated governance frameworks that extend beyond financial reporting compliance.
Protiviti's expansion of internal audit services through technology-enabled continuous monitoring platforms exemplifies the segment's evolution toward real-time assurance capabilities. Internal audit functions increasingly incorporate cybersecurity risk assessment, ESG reporting validation, and third-party risk management, creating new revenue streams that command premium pricing compared to traditional compliance-focused procedures. The Institute of Internal Auditors' emphasis on digital transformation and data analytics capabilities reflects the profession's shift toward strategic advisory roles that directly support executive decision-making and board oversight responsibilities.

By Service Line: Information Systems Drive Growth
Information system audits represent the fastest-growing service line at 12.18% CAGR through 2031, reflecting the critical intersection of cybersecurity risks and financial reporting integrity in an increasingly digital business environment. Financial audits command the largest market share at 27.05% in 2025, benefiting from mandatory requirements for public company audits and the substantial engagement fees associated with large corporate clients. Compliance audits maintain a steady demand at 22.00% market share, driven by expanding regulatory requirements across healthcare, financial services, and government contracting sectors.
Advisory and consulting services capture 18.00% market share while growing at 9.72% CAGR, as audit firms leverage client relationships to provide broader business advisory services beyond traditional assurance functions. Operational audits and investigation audits serve specialized market niches, with investigation services particularly benefiting from increased corporate governance scrutiny and whistleblower protection regulations. The ISACA organization's emphasis on IT governance and risk management frameworks supports the information systems audit segment's expansion, as organizations recognize the critical importance of technology controls in maintaining financial reporting reliability and operational resilience.
By End-User Industry: Technology Sector Leads Growth
The IT and telecommunications sector demonstrates the highest growth trajectory at 8.29% CAGR through 2031, driven by rapid digital transformation, cybersecurity threats, and venture capital due diligence requirements that demand specialized audit expertise. Banking, financial services, and insurance maintain the largest market share at 22.10% in 2025, reflecting the sector's regulatory complexity, systemic risk considerations, and mandatory audit requirements for financial institutions. Healthcare and life sciences represent a significant portion of the auditing market and are experiencing strong growth, fueled by strict FDA regulations, oversight of clinical trials, and mandates around healthcare data privacy. The government and public sector also hold a large share, driven by federal single audit requirements and increasing demands for transparency at the state and local levels. Manufacturing remains a key vertical, with demand for audits focused on supply chain risk, environmental compliance, and operational efficiency. The energy and utilities sector is expanding steadily, supported by ongoing infrastructure investments and evolving environmental regulations. Across these industries, the blending of traditional financial audits with sector-specific compliance needs is creating opportunities for firms to offer specialized services at premium rates.
Geography Analysis
The South region dominates the United States auditing services market with a 29.05% share in 2025, benefiting from robust manufacturing growth, energy sector investments, and favorable business climates that attract corporate relocations requiring audit services. The region's growth trajectory at 6.18% CAGR through 2031 reflects continued economic expansion in Texas, Florida, and North Carolina, where technology companies and financial services firms establish major operations . Federal infrastructure spending through the Infrastructure Investment and Jobs Act particularly benefits Southern states with major transportation and energy projects requiring single audit compliance procedures for federal grant recipients.
The Northeast region captures a significant market share in 2025, leveraging its concentration of financial services firms, pharmaceutical companies, and established corporate headquarters that require sophisticated audit services. Despite mature market conditions, the region maintains good CAGR growth through 2031, supported by ESG reporting mandates that particularly affect large public companies concentrated in New York and Massachusetts. The region's regulatory expertise and proximity to SEC headquarters create competitive advantages for audit firms serving complex public company clients with specialized compliance requirements.
The West region demonstrates the highest growth potential at 6.88% CAGR through 2031, driven by technology sector expansion, venture capital activity, and California's leadership in environmental regulation that creates demand for specialized assurance services. The West region leads the auditing market in 2025, driven by the presence of high-growth companies in Silicon Valley that demand SOC 2 attestations, cybersecurity audits, and IPO readiness services. Meanwhile, the Midwest plays a major role as well, with strong demand stemming from its manufacturing base and agricultural commodity trading firms. These organizations often require specialized audit procedures focused on derivative instruments and commodity price risk management, making the region a key hub for industry-specific audit expertise.
Regulatory Landscape
The United States auditing services market is supported by a dual standard-setting and oversight structure. For issuer audits, the Public Company Accounting Oversight Board (PCAOB), under SEC oversight, sets auditing and quality control standards and inspects registered firms. Recent rulemaking tightens practice requirements: PCAOB Auditing Standard AS 1000 became effective for audits of financial statements for fiscal years beginning on or after December 15, 2024, and the PCAOB adopted the QC 1000 quality control framework in May 2024, later postponing its effective date to December 15, 2026, which resets implementation timelines for registered firms.
Alongside PCAOB standards for public-company audits, the AICPA Auditing Standards Board sets U.S. GAAS for non-issuer audits, while broader accountability is reinforced by SEC attention to auditor independence. In June 2026, SEC Chief Accountant Kurt Hohl reiterated the agency focus on auditor independence as investor-protection priorities persist amid evolving audit delivery models, including expanded use of technology and new ownership structures. In parallel, PCAOB amendments adopted in December 2024 increased transparency requirements for registered firms by expanding governance and network information disclosures through PCAOB reporting forms, adding compliance effort for multi-office and networked practices.
Value Chain Analysis
Demand comes from public companies, private enterprises, and government and grant-funded entities that need statutory audits, internal audit support, and specialized assurance, including IT controls and compliance attestations. Engagements are typically initiated through audit committees, finance leadership, and procurement processes, with scope shaped by applicable standards (PCAOB for issuers, U.S. GAAS for non-issuers) and by inspection and enforcement expectations. Upstream inputs include skilled audit labor (CPAs, IT auditors, specialists), audit methodologies and templates, and a growing layer of audit technology, such as data ingestion, analytics, and documentation platforms, that supports risk assessment, evidence gathering, and workpaper assembly.
Service delivery runs from planning and risk assessment through fieldwork and testing to reporting and post-issuance documentation. Regulatory deadlines and standards changes are operational nodes that influence resourcing and tool adoption across the chain: AS 1000 is now embedded for applicable audits beginning with fiscal years starting December 15, 2024, and the PCAOB QC 1000 system-of-quality-control framework becomes effective December 15, 2026, requiring firms to formalize and evidence quality systems at scale. In the non-issuer segment, the AICPA Auditing Standards Board updated standards related to external confirmations in July 2026, shaping how firms coordinate with banks, customers, and other third parties that provide audit evidence.
Competitive Landscape
The U.S. auditing services market shows moderate concentration, with the Big Four firms collectively dominating the majority of market share. This oligopolistic structure enables them to command premium pricing for complex engagements while facing limited competition in more standardized audits. Their scale allows for global methodology standardization and over a billion dollars in annual technology investments, reinforcing their competitive edge. Regulatory expertise also provides a significant barrier that smaller firms struggle to overcome cost-effectively. These advantages create high entry barriers, allowing the leading firms to continually reinvest in AI, offshore delivery models, and specialized sector knowledge.
Despite the dominance of the Big Four, new growth avenues are emerging in niche audit services such as cybersecurity, ESG assurance, and support for technology startups. In these specialized areas, traditional Big Four approaches may be unnecessarily complex and costly for clients. Mid-tier firms like BDO, RSM, and Grant Thornton are capitalizing on this gap by offering tailored services, competitive pricing, and flexible delivery. Their deep industry expertise and responsiveness appeal to mid-market clients seeking more personalized audit experiences. These dynamics are enabling smaller firms to gradually gain ground in specific high-growth segments.
Regulatory pressure is also shaping the competitive landscape, with PCAOB inspections highlighting quality control issues across both large and small firms. This has intensified the focus on strong internal quality management and ongoing improvement efforts. Firms with robust systems in place are better positioned to withstand regulatory scrutiny and deliver consistent audit quality. As regulators prioritize effectiveness over firm size, the playing field is subtly shifting in favor of firms that can demonstrate operational excellence. In this evolving environment, audit quality and innovation are becoming as important as scale.
United States Auditing Services Industry Leaders
-
Deloitte
-
PwC
-
EY
-
KPMG
-
BDO USA
- *Disclaimer: Major Players sorted in no particular order
Market Opportunities and Future Outlook
Audit delivery platforms and AI-enabled workflows are creating room for differentiated offerings that combine traditional assurance with continuous testing, cyber and IT control coverage, and faster close support. In 2026, large firms have advanced platform-led audit modernization, including EY rolling out enterprise-scale agentic AI in Assurance through the EY Canvas environment, integrating with Microsoft Azure and data platforms, and Grant Thornton launching its cloud-based Grant Thornton Analytics and Automation Platform (GTAP) to embed analytics, automation, and AI across the audit lifecycle. These initiatives support opportunities for firms to package managed, always-on assurance for cloud environments and to standardize evidence collection and exception handling across multi-entity clients.
Near-term opportunity is also linked to compliance infrastructure work driven by PCAOB standard changes and strategic priorities. The December 15, 2026 effective date for QC 1000 accelerates demand for quality management design, monitoring, and documentation capabilities that firms can scale across networks and offshore delivery models. Separately, the PCAOB's 2026-2030 strategic planning process, including its July 2026 open-meeting agenda to solicit public comment on draft goals and objectives, offers a visible channel for firms and buyers to align investments in audit quality, technology, and talent models with the oversight roadmap, supporting expanded advisory, implementation, and assurance services connected to inspection readiness and audit transformation.
Recent Industry Developments
- May 2026: KPMG announced a global alliance with Anthropic and introduced KPMG Digital Gateway Powered by Claude, initially aimed at tax and private equity workflows. The announcement signals deeper integration of third-party foundation models into professional-services delivery, with implications for how audit-adjacent work is standardized, documented, and controlled across engagements.
- October 2025: KPMG entered a definitive agreement to acquire the intellectual property and technology assets of YData Labs Inc. to strengthen AI-enabled delivery across Audit and Assurance, Tax, and Advisory. Adding synthetic data and privacy-oriented tooling supports scaled analytics and model development while addressing constraints around sensitive client data used in assurance-related testing.
- December 2024: The PCAOB adopted amendments that require registered firms to report additional governance and network information in Form 2 and the annual reporting form. Expanded disclosures increase transparency for investors and audit committees and raise the importance of centralized compliance operations for firms with complex structures.
Research Methodology Framework and Report Scope
Market Definition and Coverage
This market covers revenues earned in the United States from providing auditing work, where evidence is gathered and tested so an assurance conclusion can be issued on financial reporting, controls, systems, or compliance.
Scope exclusions: It does not count general accounting, bookkeeping, or tax-only engagements that are delivered without an audit, attestation, or audit-like assurance outcome.
Segmentation Overview
- By Type
- Internal Audit
- External Audit
- By Service Line
- Operational Audits
- Financial Audits
- Advisory and Consulting
- Investigation Audits
- Information System Audits
- Compliance Audits
- Other Service Lines
- By End-User Industry
- BFSI
- Manufacturing
- Government & Public Sector
- Healthcare & Life Sciences
- IT & Telecom
- Energy & Utilities
- Other Industries
- By Geography
- Northeast
- Midwest
- South
- West
Data Sources, Market Sizing, and Validation
Desk Research
Desk research starts by setting a clear US audit services definition and then collecting public signals that explain audit demand and pricing. We rely on non-paywalled sources such as SEC filings and issuer statistics, PCAOB inspection reports and standards updates, AICPA guidance, and Bureau of Labor Statistics data for employment and wage trends in accounting and auditing. Depending on the topic being checked, additional public inputs are pulled from U.S. Census Bureau business patterns, GAO and federal audit compliance publications (including single-audit related guidance), and peer-reviewed accounting and assurance journals.
To make the data usable for sizing, company annual reports, 10-Ks, and investor presentations are reviewed to understand how audit versus advisory revenues are described and where firms place service emphasis. The narrative is then cross-checked with reputed press coverage to confirm that the described revenue split matches what is seen in the market. In parallel, our analysts use paid subscriptions for company financials and news, plus patent databases to track audit analytics and automation themes that can affect productivity and fee pressure. These examples are not exhaustive, and many other sources were used for data collection, validation, and clarification during the research process.
Primary Interviews and Surveys
Primary work is used to confirm what is being billed as audit versus advisory, and to sanity-check fee movement, staffing constraints, and engagement mix across client types. We speak with partners, practice leaders, managers, and finance or procurement stakeholders across the United States so assumptions on audit cycles, compliance intensity, and outsourcing patterns can be tightened before finalizing the model.
Distribution of primary research fieldwork respondents
| Company type | Respondent position |
|---|---|
| Top tier: 37% | CXOs: 15% |
| Mid tier: 48% | Functional/Unit leaders: 25% |
| Smaller Players: 15% | Managers: 60% |
Market-Sizing & Forecasting
Sizing starts from a top-down build where the US audit demand pool is reconstructed using public-company coverage, regulated-entity footprints, and common statutory audit requirements by sector, then translated into service revenue using typical engagement frequency and fee ranges. The results are corroborated with selective bottom-up approximations, including sampled audit fee disclosures where available, channel checks from interviews on billing-rate direction, and a reasonableness roll-up using provider revenue mix commentary.
Inputs that materially move the totals include issuer counts and filing activity, inspection pressure and remediation cycles, audit labor availability and wage inflation, the mix shift toward information system and compliance audits, and the share of work delivered as recurring internal audit support versus one-time investigations. For forecasting, scenario analysis is applied around fee-rate progression and staffing capacity, and then the selected path is aligned to expert expectations for regulation, client risk appetite, and productivity gains from automation. When smaller-firm detail is limited, gaps are handled by applying validated fee bands to an estimated engagement base, followed by checks against staffing levels and utilization patterns.
Data Validation & Update Cycle
Validation is done through repeated checks, where model outputs are compared against independent signals such as audit staffing levels, the direction of billing rates reported by practitioners, and observed shifts in audit versus advisory mix. Large movements are flagged and traced to a driver, and when the reason is not clear, re-contact is triggered to confirm whether the assumption and timing still hold.
Before sign-off, another analyst reviews the calculations, definitions, and year-to-year continuity so the same scope is applied consistently. Reports are refreshed annually, and interim updates are made when major regulatory changes or market events are likely to shift audit volumes or pricing. Right before delivery, a final pass is completed so clients receive the latest updated view.
Mordor Intelligence's US Auditing Services Market Sizing Compared With Other Published Estimates
Published market sizes for US auditing services can look far apart even when the label sounds similar. The included services are usually defined differently, and update timing is rarely aligned. The spread is also influenced by the base year used, how fee-rate change is applied, and whether totals include audit-adjacent consulting that is not always delivered as assurance work.
Some published figures bundle broader professional services revenue, which can include accounting support and non-audit advisory fees tied to risk programs. For Mordor Intelligence, only defined auditing services (including internal and external audits plus information system and compliance audits) are counted, while tax-only and general accounting work stays outside scope so the revenue pool matches audit delivery patterns.
Benchmark comparison
| Source | Market Size | Gaps in Research Methodology |
|---|---|---|
| Mordor Intelligence | USD 51.88 B (2025) | |
| Industry Database A | USD 56.30 B (2026) | Uses an industry-revenue view tied to CPA audit industry definitions and classification, which can shift totals based on how firms are coded and how revenue timing is captured, and it is also stated for a different year than the baseline. |
| Market Blog B | USD 23.80 B (2026) | Appears to focus on a narrower audit subset and may exclude service lines often billed under audit programs (such as information system and broader compliance audits), which lowers the total even if growth assumptions are stronger. |
The main takeaways are that year alignment and service-line inclusion explain most of the difference, and then pricing and staffing assumptions widen the gap. When the scope is pinned to audit delivery and checked against filing activity, inspection intensity, and labor signals, the final number becomes easier to replicate and to track over time.
Key Questions Answered in the Report
What is the projected value of the United States auditing services market by 2031?
The market is forecast to reach USD 62.81 billion by 2031.
Which audit service line is growing fastest through 2031?
Information-system audits are projected to expand at a 12.18% CAGR.
Which U.S. region shows the highest growth for audit services?
The West region is expected to record the quickest 6.88% CAGR.
What key regulation is expanding ESG assurance demand?
The SEC’s 2024 climate-disclosure rule introduces phased assurance over greenhouse-gas emissions.