
Smartphones Market Analysis by Mordor Intelligence
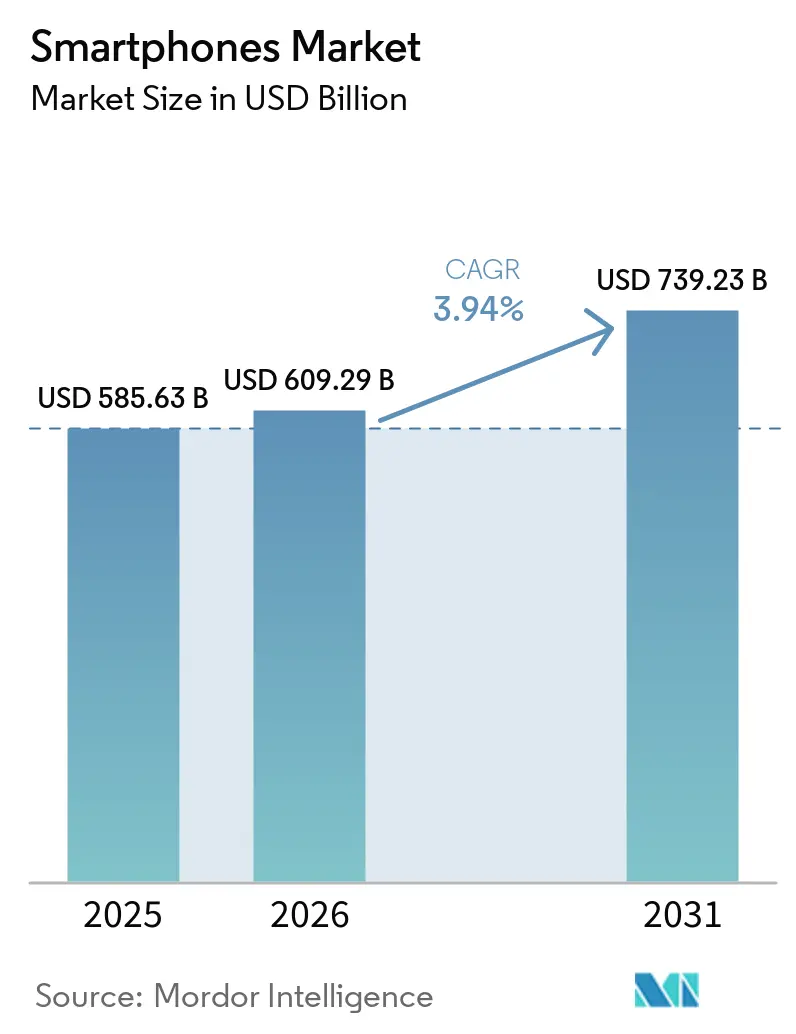
The smartphones market size was valued at USD 609.3 billion in 2026 and estimated to grow from USD 633.3 billion in 2027 to reach USD 756.5 billion by 2032, at a CAGR of 3.62% during the forecast period (2027-2032). Smartphone volume was 1.18 billion units in 2026 and estimated to grow from 1.2 billion units in 2027 to reach 1.33 billion units by 2032, at a CAGR of 2.1% during the forecast period (2027-2032).
Affordable 5G devices in India and hardware-specific AI give buyers a stronger reason to replace a working handset. Trade-ins and continued software support can help buyers justify higher-value handsets. More portable foldable designs can strengthen the case for a larger working display. Memory costs, longer hold times and refurbished alternatives constrain the available new-device opportunity. With value forecast to outgrow volume, suppliers can use trade-ins to pursue higher-value upgrades, making handset price and mix central to revenue growth.
Key Report Takeaways
- Overall estimates show total market value forecast to grow faster than total market volume during 2027-2032.
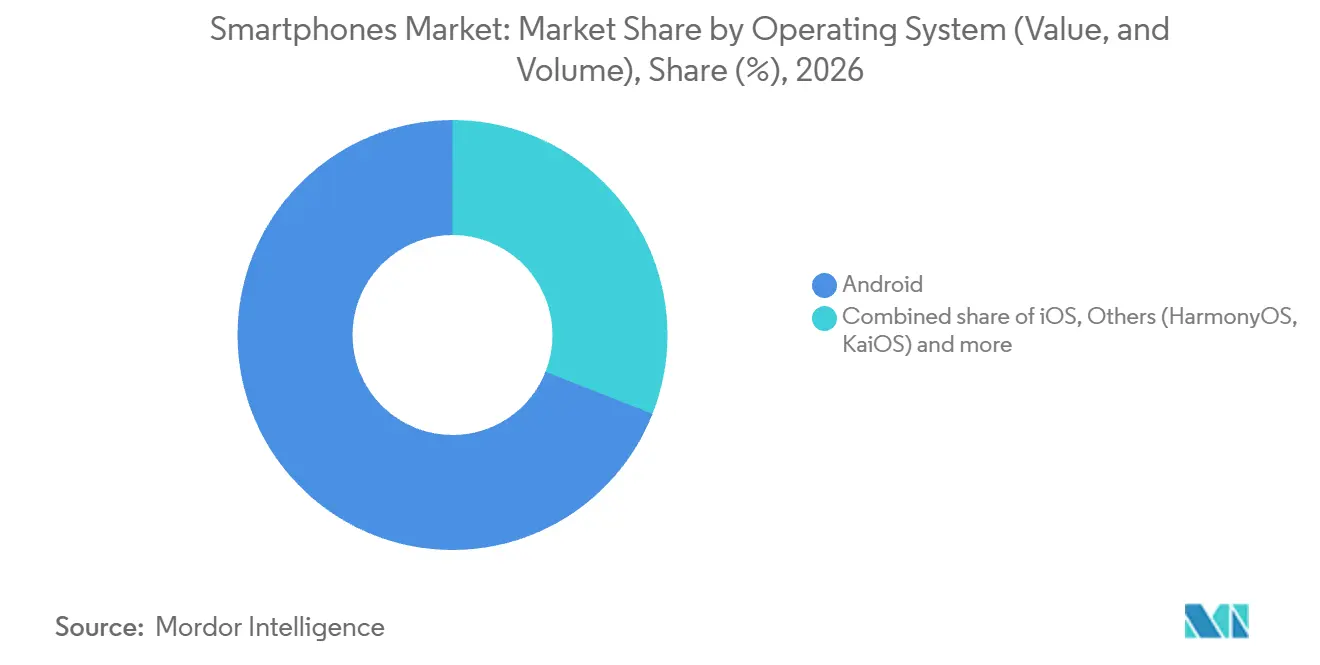
- By operating system, Android held a 69.02% smartphones market share in 2026, while Others (HarmonyOS, KaiOS) is forecast to be the fastest-growing segment at a CAGR of 5% during 2027-2032.
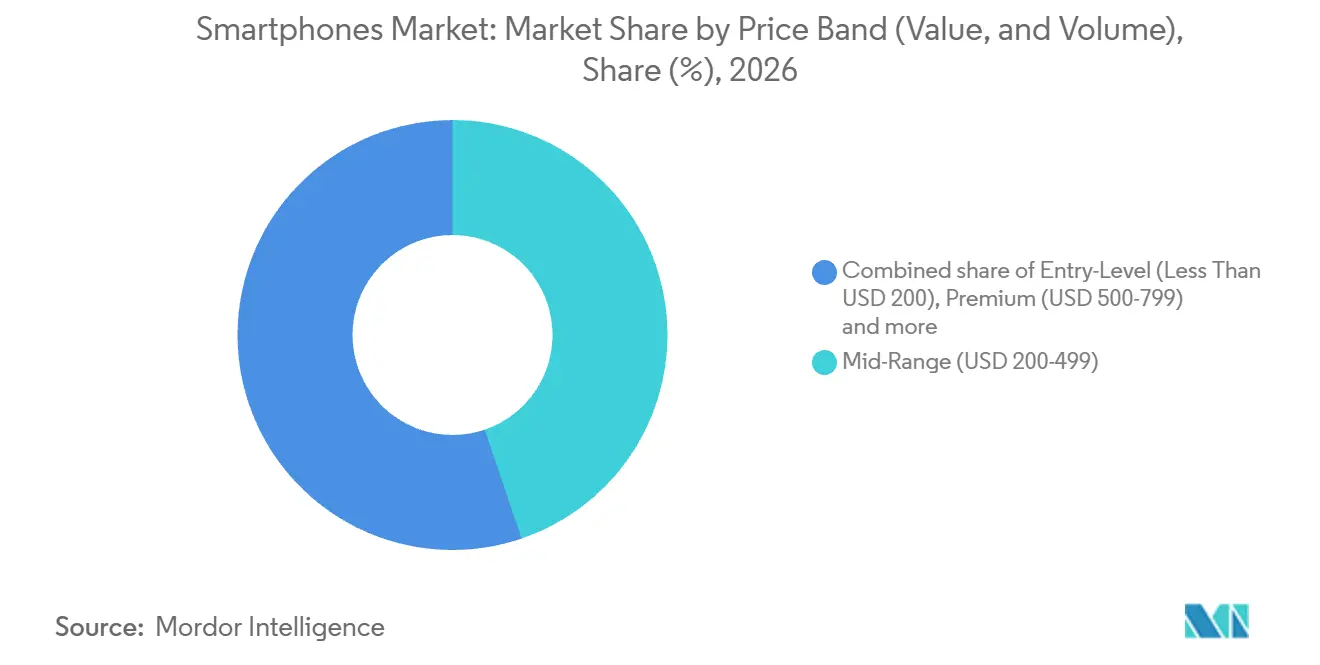
- Across price bands, mid-range smartphones held a 44.79% share of the smartphones market size in 2026, and ultra-premium smartphones are forecast to grow fastest at a CAGR of 6.1% during 2027-2032.
- Network technology was led by 5G with 57.76% of handset sales value in 2026, and the same segment is forecast to grow fastest at a CAGR of 4.2% during 2027-2032.
- Form factor was led by bar smartphones with 89.98% of handset sales value in 2026, while foldable or flip smartphones are forecast to grow fastest at a CAGR of 4.8% during 2027-2032.
- Online direct-to-consumer led distribution with 36.91% of handset sales value in 2026 and is forecast to be the fastest-growing segment at a CAGR of 5.3% during 2027-2032.
- Among end users, consumer or individual buyers held 79.79% of handset sales value in 2026, while enterprise or SME buyers are forecast to grow fastest at a CAGR of 4.4% during 2027-2032.
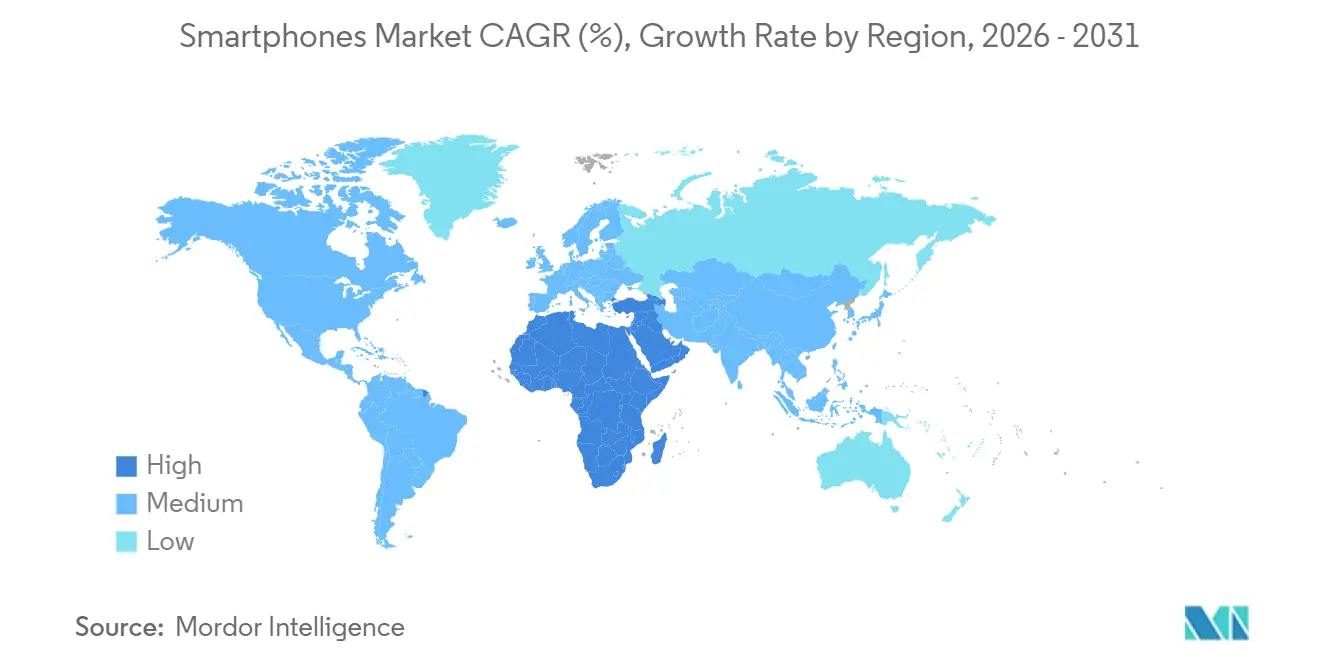
- Asia-Pacific led geography with 43.09% of handset sales value in 2026, while the Middle East is forecast to grow fastest at a CAGR of 10.4% during 2027-2032.
Note: Market numbers in this report are based on Mordor Intelligence's proprietary estimation framework, which combines nine months of actuals with Q4 projections for base year 2026.
Market Trends and Insights
Drivers Impact Analysis of Smartphones Market*
| Driver | (~) % Impact on CAGR Forecast | Geographic Relevance | Impact Timeline |
|---|---|---|---|
| AI-Enabled Upgrade Cycle Could Accelerate Replacements (On-Device GenAI, Multimodal Assistants) | +1.8% | North America, Europe, Asia-Pacific | Medium term (2-4 years) |
| Premiumization Sustained by Financing, Trade-Ins, and Extended Software Support | +2.1% | United States, European Union | Short term (≤ 2 years) |
| Entry-Level 5G Proliferation in Emerging Markets | +1.4% | India and Sri Lanka | Medium term (2-4 years) |
| Foldable Maturation Expands High-Value Niches | +0.6% | Japan | Medium term (2-4 years) |
| Carrier-Led Promotions and Device Financing in Mature Markets | +0.4% | United States | Short term (≤ 2 years) |
| Regional Manufacturing Localization Incentives (India, Vietnam, Middle East, and Africa) Reduce Costs and Lead Times | +0.3% | India | Long term (≥ 4 years) |
| Source: Mordor Intelligence | |||
AI-Enabled Upgrade Cycle Could Accelerate Replacements (On-Device GenAI, Multimodal Assistants)
On-device AI gives owners a hardware-based reason to upgrade when a new chip enables a newer model to run locally. Google said in August 2025 that Tensor G5 was the first chip to run the newest Gemini Nano model, enabling fully on-device generative AI on Pixel 10 at launch.[1] GSMA Intelligence’s 2025 Global Consumer Survey found that AI capabilities influenced purchasing decisions and upgrade cycles, with strong adoption intent across North America, Europe, and Asia-Pacific. In August 2026, Google announced Pixel 11, Pixel 11 Pro and Pixel 11 Pro XL with Tensor G6 running its latest Gemini Nano model. The pairing recurred across 2 generations, giving Google an upgrade argument grounded in what each new chip could run locally.
Premiumization Sustained by Financing, Trade-Ins, and Extended Software Support
Premiumization depends on making a higher-value handset affordable to acquire and useful to retain. Assurant reported that US mobile trade-in programs returned USD 1.43 billion to consumers in Q2 2026 to offset upgrade costs, with value extending beyond smartphones. For covered EU smartphones, manufacturers, importers, or authorized representatives that provide security, corrective, or functionality operating-system updates must make them free to all model units using the same operating system. This requirement applies from June 20, 2025 and lasts at least 5 years after model placement ends. Smartphones for high-security communication, roll-up flexible-display devices, and products for explosive atmospheres under Directive 2014/34/EU are excluded. Trade-in value at the point of upgrade and no-cost updates for covered models that receive them can lower the net cost of moving to a higher-value handset and of keeping it longer.
Entry-Level 5G Proliferation in Emerging Markets
A low handset price makes a network-generation upgrade relevant to buyers choosing an entry-level replacement. Samsung announced the 4GB+128GB Galaxy F06 5G in India in February 2025 at an introductory INR 9,499 (USD 109.1), including INR 500 (USD 5.74) in bank cashback. Dialog introduced the affordable Blackview Shark 6 5G smartphone in Sri Lanka in January 2026, with availability across more than 600 outlets. India’s Ministry of Communications reported that 398 million mobile subscribers had started using 5G services by December 31, 2025. The handset price puts compatible hardware within the entry-level tier, while the subscriber count establishes a substantial service-user environment. Selling a network-generation upgrade through an affordable new device reaches buyers below the higher-priced tiers.
Foldable Maturation Expands High-Value Niches
Foldable maturation can expand demand when a larger working display entails less bulk to carry between uses. Samsung Electronics Japan said the Galaxy Z Fold7 was the thinnest and lightest horizontal-fold smartphone model released in Japan as of July 1, 2025, based on Samsung research. The company began selling it through Docomo stores, retailers and online channels in Japan on August 1, 2025. For a buyer considering a folding handset, the carrying burden can matter alongside the usefulness of the unfolded screen. Reducing that burden gives the folding design a way to compete for everyday use, rather than relying on screen area alone to justify a specialized purchase.
Restraints Impact Analysis of Smartphones Market*
| Restraint | (~) % Impact on CAGR Forecast | Geographic Relevance | Impact Timeline |
|---|---|---|---|
| Memory Supply Tightness Lifts BoM Costs, Pressuring Low-End Android | -1.3% | Asia-Pacific, North America, Europe | Short term (≤ 2 years) |
| Used or Refurbished Smartphone Growth Cannibalizes New Device Demand | -0.9% | France, Germany, Spain, Sweden, United Kingdom | Medium term (2-4 years) |
| Slower Refresh Cycles from Durability and Incremental Innovation | -0.5% | United States | Long term (≥ 4 years) |
| Geopolitics and Tariffs Shifting SKUs, Raising Logistics Complexity | -0.3% | United States | Short term (≤ 2 years) |
| Source: Mordor Intelligence | |||
Memory Supply Tightness Lifts BoM Costs, Pressuring Low-End Android
Memory costs constrain affordable smartphones by making a fixed selling price harder to reconcile with the intended specification. Xiaomi reported significant memory-cost increases as a broad headwind for the global smartphone industry in the first half of 2026.[2] For low-end Android suppliers, absorbing such input pressure would reduce the earnings available at an unchanged device price. Passing it through instead would weaken the affordability that defines this tier. In July, Samsung Electronics expected server-led demand to leave the broader memory market undersupplied in H2 2026 despite partial moderation in mobile and PC demand, extending the pricing risk into the second half.
Used or Refurbished Smartphone Growth Cannibalizes New Device Demand
Refurbished alternatives can divert a handset purchase from a factory-new device when buyers accept a previously owned phone. In Vodafone Institute’s March 2025 survey across France, Germany, Spain, Sweden, and the United Kingdom, 40% of all surveyed consumers definitely or probably planned to buy a refurbished smartphone for their next purchase. For new-device manufacturers, this places the source of the handset inside the competitive decision alongside the device itself. A new-device offer must establish why a newly manufactured phone adds enough value to win that choice. Because the survey question concerns the next purchase, the exposure falls on replacement demand in these 5 countries, where a refurbished phone is the alternative to a newly manufactured one.
*Our forecasts treat driver/restraint impacts as directional, not additive. The impact forecasts reflect baseline growth, mix effects, and variable interactions.
Smartphones Market Segment Analysis
By Overall Market Estimates:
Unit Delivery and Device Revenue Create Different Commercial TasksUnit volume measures the number of complete smartphones shipped, setting the physical scale of handset production. Xiaomi Corporation reported 65 million global smartphone shipments in the first half of 2026. Unit demand is forecast to grow more slowly than sales value during 2027-2032. A manufacturer expanding output in line with revenue would risk planning more physical capacity than the unit outlook calls for.
Handset revenue depends on realized selling prices and model mix as well as the number of phones sold. Apple reported worldwide iPhone net sales of USD 54.25 billion in fiscal Q3 2026, compared with USD 44.58 billion in fiscal Q3 2025. At that revenue scale, choosing which models to sell affects the monetary return from the production program. Suppliers therefore have to separate spending on a higher-value model mix from spending on added handset output.
By Operating System (Value, and Volume):
Platform Choice Leaves Room for Handset DifferentiationAndroid accounted for a 69.02% share of the smartphones market size in 2026, making it the largest operating-system segment. Samsung Electronics Japan reported first place in Japan’s Android smartphone category by 2025 unit sales, based on BCN POS data from 2,350 electronics, computer-specialty, and online retailers. The measured retail network spans physical stores and online sellers, connecting the platform to more than one route to handset purchases. Within Android, a manufacturer can pursue handset purchases through those retail channels without making an operating-system switch a condition of the sale.
Others (HarmonyOS, KaiOS) is forecast to be the fastest-growing operating-system segment at a CAGR of 5% during 2027-2032. Huawei reported more than 36 million devices across its product ecosystem running HarmonyOS 5 or HarmonyOS 6 by the end of 2025. AppGallery offered more than 350,000 apps and services by the same date. For a smartphone maker backing HarmonyOS, the handset can provide access to a broader environment of software and devices. App and service availability gives that maker a basis for retaining users beyond the next hardware purchase, making software participation part of the handset’s competitive appeal.

By Price Band (Value, and Volume):
Mid-Range Scale and Ultra-Premium Flagship DemandMid-range smartphones priced USD 200-499 represented a 44.79% smartphones market share in 2026, making them the largest price-band segment. This tier gives an entry-level owner a higher-spending replacement route while keeping the purchase below the premium band’s USD 500 starting point. A manufacturer can seek more revenue from that owner without requiring a premium purchase, provided the replacement offers a useful gain. The same tier can also accommodate a premium buyer seeking a lower-priced replacement. Serving both routes into mid-range creates a design tension, because features that justify trading up may differ from those a buyer trading down will relinquish.
Ultra-premium smartphones priced above USD 800 are forecast to be the fastest-growing price-band segment at a CAGR of 6.1% during 2027-2032. In March 2026, Samsung said more than 70% of worldwide Galaxy S26 series preorder customers selected the Galaxy S26 Ultra. Samsung’s US listing placed its 256GB unlocked Galaxy S26 Ultra configuration above USD 800. Concentrated early selection of that model gives the manufacturer a demand signal around which to build its flagship offer. With more than 70% of preorder customers choosing the Ultra, Samsung’s S26 preorder demand rests largely on one model with a US configuration in the above-USD 800 tier.
By Technology (Network Generation) (Value):
Network Adoption and Legacy Retirement Shape Demand5G was the largest segment with a 57.76% share of handset sales value in 2026 and is forecast to be the fastest-growing segment at a CAGR of 4.2% during 2027-2032. ITU reported that 5G accounted for 36% of global mobile broadband subscriptions in 2025, a population that includes connected devices.[3] That network base gives compatible smartphones an established service environment in which to provide 5G connectivity. ITU also linked uptake closely to network availability, making coverage a practical condition for the handset opportunity. This favors aligning a 5G handset launch with local service availability, so connectivity offers a usable upgrade benefit at purchase.
The 3G and below segment is forecast to contract, making network-retirement requirements a risk for handsets tied to legacy services. Qatar’s Communications Regulatory Authority ordered Ooredoo Qatar and Vodafone Qatar in August 2024 to cease 3G services by December 31, 2025. This dated requirement shows how a network decision can end the usefulness of a handset that depends on that generation. For buyers considering a replacement, network continuity therefore becomes a separate consideration from whether an older phone still functions. A supplier serving such a transition can make continued network access the reason to replace an otherwise functioning device.
By Form Factor (Value):
Bar-Format Scale Coexists with Specialized Device ChoicesBar smartphones were the largest form-factor segment, accounting for 89.98% of handset sales value in 2026. In February 2025, Samsung reported more than 430,000 Galaxy S25 series preorders in India, 20% more than for the Galaxy S24 series. These advance orders put fulfillment of a named device generation at the center of the launch opportunity. That demand offered Samsung’s bar-format line a route to replacement sales without making a folding design a condition of the upgrade.
Foldable or flip smartphones are forecast to be the fastest-growing form-factor segment at a CAGR of 4.8% during 2027-2032. One month after the August 2026 launch, Samsung Electronics America reported combined US purchases of Galaxy Z Fold8 Ultra and Galaxy Z Fold8 tracking 30% ahead of Galaxy Z Fold7. Rugged or industrial smartphones include Kyocera’s DuraForce PRO 3, which achieved Verizon Frontline Verified status in December 2025 after testing against public-safety standards for first responders and agencies using Verizon’s network. For Samsung, the commercial opening lies in the combined Fold offer, so allocating additional production to either model requires a model-specific demand signal.
By Distribution Channel (Value):
Direct Digital Reach Complements Physical Brand RetailOnline direct-to-consumer was the largest distribution segment with a 36.91% value share in 2026 and is forecast to be the fastest-growing segment at a CAGR of 5.3% during 2027-2032. Google opened direct Pixel phone purchases across India through the official online Google Store on May 29, 2025, complementing its existing online and offline partner channels. For a device maker, a direct storefront creates its own place to present the handset offer and complete the sale. Because the Google Store complements partner channels, Pixel buyers gain a direct purchase route while resellers retain a place in Google’s distribution.
Brand-owned retail provides a physical counterpart to direct online selling. Apple reopened its Ginza store in Tokyo on September 26, 2025, in a reimagined 4-story design where customers could shop the iPhone 17 lineup. The store originally opened in 2003. The reopening paired a changed store design with a new device range at the same location. Renewing an established site can support a product launch without adding another store, separating investment in the selling environment from expansion of physical reach.
By End User (Value):
Consumer Ownership and Institutional Provision Create Distinct NeedsConsumer or individual users were the largest end-user segment with a 79.79% share of handset sales value in 2026. In low- and middle-income countries, the 2025 smartphone-ownership gender gap was 13%, equivalent to about 210 million fewer women than men owning smartphones. For personal-device suppliers, closing an ownership gap involves reaching a buyer who lacks a handset, a different task from persuading an owner to upgrade. An offer requiring an existing smartphone as a trade-in would leave these first-time buyers outside its reach.
Enterprise or SME users are forecast to be the fastest-growing end-user segment at a CAGR of 4.4% during 2027-2032. NOK Corporation used a health management app on employee smartphones to disseminate health information every day. Such a workflow makes the handset an endpoint for employer communication, connecting device usefulness to an organizational task. Public sector procurement included Brazil’s Ministry of Justice and Public Security, which contracted through its National Public Security Secretariat for 5G smartphones from December 30, 2025 through December 30, 2026. Because the Brazilian contract runs for a fixed term ending December 30, 2026, that public-sector handset purchase is tied to one procurement term rather than to a continuing consumer upgrade cycle.
Geography Analysis
Asia-Pacific Smartphones Market
Asia-Pacific held a 43.09% smartphones market share in 2026, making it the largest geography. China shipped 126 million smartphones from January to June 2026, down 3% year over year. Suppliers selling into China face a shrinking shipment pool. Expanding deliveries there requires taking shipment share rather than relying on overall volume growth.
Middle East Smartphones Market
The Middle East is forecast to be the fastest-growing geography at a CAGR of 10.4% during 2027-2032. Zain KSA commercially launched 5G-Advanced (5G+) for individual customers in Riyadh and Jeddah, Saudi Arabia, on July 23, 2026, with performance benefits for compatible devices. In the UAE, du’s mobile base reached 9.3 million prepaid and postpaid subscribers in Q2 2026, up 1.6% from Q2 2025. Zain KSA’s 5G-Advanced service gives compatible devices improved performance in Riyadh and Jeddah, so network capability becomes a selling point only where the rollout has reached. Because Zain KSA began in 2 cities and its benefits apply only to compatible devices, suppliers can target 5G-Advanced-ready models at buyers in those service areas.
In North America, US prepaid provider Total Wireless announced Edge device financing through Glow Services Corp in December 2025, with in-store applications for qualifying customers on its Verizon-network service. South America has Brazil’s 2025 telecommunications-product rule making marketplaces and other involved digital platforms, including advertising-only participants, jointly responsible with sellers for approval-code disclosure and checks. In Europe, Bitkom found employer-provided work-phone access among German employees needing mobile communication reached 56% in 2026, up from 46% in 2023. In Africa, GSMA reported smartphone adoption of 33% and unique mobile internet penetration of 12.5% in Malawi in 2025. In the United States, Brazil and Germany the supplier reaches the buyer through a lender, a marketplace or an employer, while Malawi’s low smartphone adoption makes the first handset purchase the gating step.
Regulatory Framework and Outlook
Selected jurisdictions are compared from the perspective of an international manufacturer seeking technical market access for new smartphones. The comparison separates operative product duties from scheduled or proposed technical changes. The FCC’s 85% manufacturer benchmark applied to the July 2025-June 2026 reporting period, while the 100% benchmark for future wireless handset models takes effect on December 15, 2026. Such transitions can affect a model’s compliance program alongside the approvals needed before the device can be offered.
Regulatory Table of Smartphones Market
| Decision factor | United States | Brazil | Germany | China | Saudi Arabia | South Africa |
|---|---|---|---|---|---|---|
| Primary authority | Federal Communications Commission | Anatel | Bundesnetzagentur for radio equipment; national authorities for ecodesign | Ministry of Industry and Information Technology | Communications, Space and Technology Commission | Independent Communications Authority of South Africa |
| Key instruments or direction | Manufacturer hearing-aid compatibility transition | Resolutions 715/2019 and 777/2025; proposed 2026 approval-identification procedure | EU 2023/1670 and 2023/1669 for covered models; roll-up and high-security exclusions; review by September 2027 | Network-access licensing; GB/Z 177—2026 framework with phone-specific work planned | Article 89 device approval; October 2025 satellite consultation with November 27, 2025 comment deadline | Electronic Communications Act section 35(1), subject to exceptions; finalized 2026 frequency plan |
| Commercial effect | Future-model accessibility compliance at the manufacturer transition | Covered SIM/chip devices need certification before use or sale; providers may decline activation or suspend service | Covered-model design and energy-label duties from June 20, 2025 | Covered equipment needs a permit before public-network use or domestic sale | Applicants fund testing through approved laboratories or entities inside or outside the country | Certificates only for South African-registered companies; accredited test reports required for mobile-phone applications |
| Current policy attractiveness | Medium | Medium | Medium | Medium | Medium | Low |
| Future direction of policy attractiveness | Hardening | No change | No change | No change | No change | No change |
| Source: Mordor Intelligence | ||||||
Germany’s Medium rating reflects covered-model design and labeling duties, with a review deadline that sets no predetermined new requirement, while the US manufacturer transition warrants Hardening. China’s network-access licensing and Saudi Arabia’s applicant-funded CST testing support Medium ratings and No change because the Chinese phone-specific standards under GB/Z 177—2026 were planned work, while the Saudi consultation with a November 27, 2025 deadline concerned satellite connectivity rather than general device approval. Brazil’s Medium rating reflects mandatory certification and provider discretion over uncertified devices, with No change because the proposed identification procedure would take effect only after a further technical act. South Africa’s Low rating reflects its local-company certificate-holder requirement and accredited testing, with No change because the National Radio Frequency Plan 2026 published on July 24 concerns spectrum allocation, leaving the ICASA approval route separate.
Value Chain Stages
Component suppliers, manufacturing-service providers and integrated handset brands capture value through different parts of smartphone production and selling. MediaTek supplies Dimensity smartphone chipsets, while Samsung Semiconductor supplies LPDDR5X mobile memory. Hon Hai provides electronics manufacturing services to brands within a broader consumer-electronics business that includes smartphones. Contract manufacturing and brand-owned production offer different routes for building handsets, with different relationships between production-service earnings and the final device sale.
Value Chain Analysis Table of Smartphones Market
| Primary activity | Key participants | Value capture | Bottleneck | Resilience response |
|---|---|---|---|---|
| Smartphone component supply | Chipset suppliers such as MediaTek; memory suppliers such as Samsung Semiconductor | Chip and memory supply revenue | Coordinating chipset and memory specifications | Qualify component combinations before handset integration |
| Handset manufacturing services | Electronics manufacturing-service providers such as Hon Hai (Foxconn) | Manufacturing-service revenue | Translating device designs into repeatable builds | Validate the build process before scaling production |
| Branded device sales | Integrated smartphone manufacturers such as Samsung Electronics | Handset device-sale revenue | Maintaining device economics as specifications and costs change | Review component choices before fixing model pricing |
| Source: Mordor Intelligence | ||||
Samsung’s mobile-phone factories in Bac Ninh and Thai Nguyen produced 2 billion handsets cumulatively through June 2025, following the start of operations in April 2009. Its Galaxy Z Fold7 was produced in Vietnam and launched in July 2025. Operating its own plants leaves Samsung’s device business exposed to factory utilization, while Hon Hai’s manufacturing-service business depends on securing production work from brand customers.
Competitive Landscape
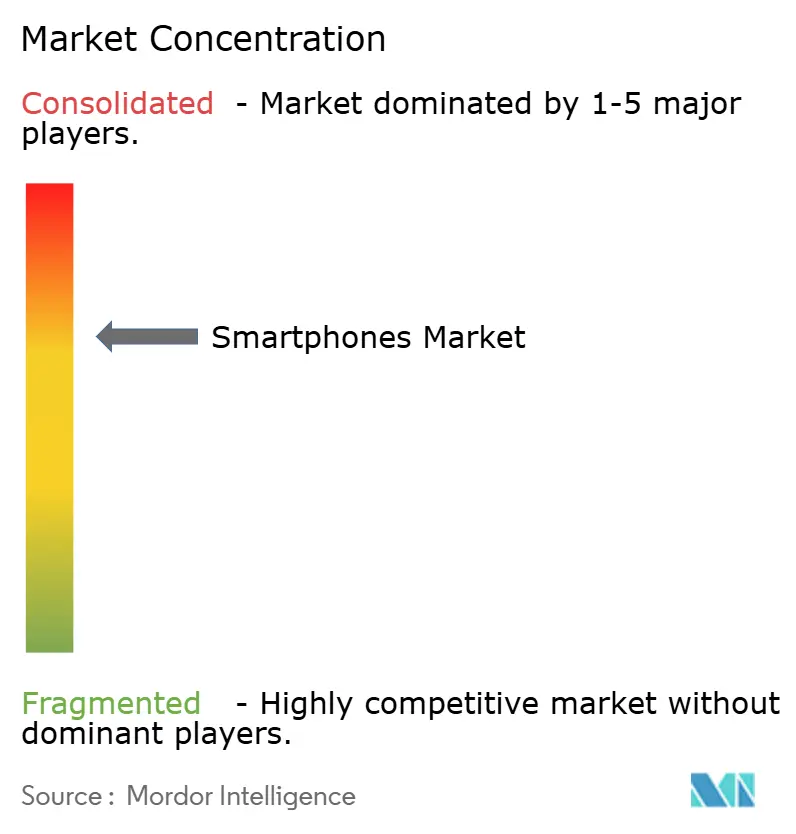
The field includes smartphone producers Samsung Electronics Co. Ltd, Apple Inc., Xiaomi Corporation, OPPO (including OnePlus), and Vivo Communication Technology Co., Ltd. The competitive field includes large-scale producers, illustrated by Xiaomi’s 165.2 million global smartphone shipments in 2025, down 2% year over year. Samsung reported solid Galaxy S26 sales and strong Galaxy A series momentum in Q2 2026, although its combined Mobile eXperience and Networks businesses recorded an operating loss amid elevated component costs. Samsung’s result points challengers competing on device price to a barrier beyond attracting customers, namely preserving earnings when industry component costs rise.
Technology partnerships can change a handset’s software capabilities after its initial sale. Samsung began rolling out Google’s Gemini Live camera and screen-sharing capabilities to Galaxy S25 users on April 7, 2025, at no additional cost. The feature required an internet connection and was available in select countries to users aged 18 or older. For a buyer with access, such a rollout can add a new way to use the smartphone already owned. A rival seeking to match this user experience would need software delivery and partner integration, extending competition beyond the specifications fixed when a phone launches.
Regulatory positioning shapes how Apple’s platform connects EU developers and users. Since 2024, Apple has updated iOS, iPadOS, Safari, and the App Store in the EU for Digital Markets Act compliance, including distribution of notarized iOS and iPadOS apps through alternative marketplaces. For website distribution of notarized iOS and iPadOS apps, Apple requires developer authorization, developer ownership of the website and domain registration in App Store Connect. These requirements make a direct distribution route conditional on an Apple-controlled authorization process, even when the developer operates the customer-facing website. An EU iPhone buyer can choose an alternative app source without changing handset ecosystems, although the available route depends on the developer meeting Apple’s conditions.
Smartphones Industry Leaders
-
Samsung Electronics Co. Ltd
-
Apple Inc.
-
Xiaomi Corporation
-
OPPO (incl. OnePlus)
-
Vivo Communication Technology Co., Ltd.
- *Disclaimer: Major Players sorted in no particular order
Smartphones Market Companies Covered in this Report
- Apple Inc.
- Samsung Electronics Co. Ltd
- Xiaomi Corporation
- OPPO (incl. OnePlus)
- Vivo Communication Technology Co., Ltd.
- Transsion Holdings Co., Ltd. (TECNO, Infinix, itel)
- Huawei Technologies Co., Ltd
- Honor Device Co., Ltd.
- Google LLC
- Motorola Mobility LLC (Lenovo Group Ltd)
- Realme Chongqing Mobile Telecommunications Corp., Ltd.
- HMD Global Oy (Nokia)
- Sony Corp.
- ASUSTeK Computer Inc.
- ZTE Corp.
- TCL Communication Technology Holdings Limited (Alcatel)
- Nothing Technology Ltd
- Kyocera Corporation
- Sharp Corporation
- Fairphone B.V.
Key Opportunities for Market Participants
The opportunities compare new handset propositions for travel connectivity, eligible Indian production and repairable devices for EU buyers. In March 2026, KDDI and Okinawa Cellular announced US satellite roaming for au Starlink Direct, initially for updated Google Pixel 9 and 10 series phones with roaming enabled in T-Mobile’s specified Starlink coverage areas. India’s July 2026 approval of a 5-year mobile-phone manufacturing scheme for fiscal 2026-27 through 2030-31 created an eligibility-dependent opening for local production, domestic sourcing and Indian-brand design and R&D. These openings connect changes in connectivity or policy to device sales when the handset offer meets the relevant technical or production conditions.
Market Opportunities Table of Smartphones Market
| Opportunity | Why now | Buyer / lead segment | Recommended play | Main barrier | Likely beneficiaries |
|---|---|---|---|---|---|
| Satellite-compatible new handsets | Announced cross-border satellite roaming | au subscribers choosing new phones for US travel | Sell verified compatibility with clear setup instructions | Device compatibility and coverage limits | Compatible-phone makers such as Google |
| India-made smartphone programs | New manufacturing-incentive approval | Eligible smartphone manufacturers and Indian brands | Link handset production to qualifying local sourcing and design | Coordinating local component sourcing with handset assembly | Eligible manufacturers and Indian-brand designers |
| Repairable new-smartphone offers | In-force smartphone spare-parts duties | EU buyers choosing covered new models | Integrate parts availability into handset design and support | Long support obligation after final model placement | Manufacturers able to sustain model-specific parts support |
| Source: Mordor Intelligence | |||||
EU rules require manufacturers, importers, or authorized representatives to make specified parts, when present, available to professional repairers for covered smartphones. Availability starts on June 20, 2025 or one month after market placement, whichever is later, and continues until at least 7 years after the model’s final EU market placement. The commercial commitment therefore extends beyond the period in which additional units of that model enter the market. For EU-focused suppliers, the opening is a new handset backed by a repair system designed to outlast the model’s final market placement.
Recent Industry Developments in Smartphones Market
- Sep 2026: Samsung Electronics America reported combined US purchases of the Galaxy Z Fold8 Ultra and Galaxy Z Fold8 tracking 30% ahead of the Galaxy Z Fold7 one month after the August 2026 launch.
- Aug 2026: Google unveiled Pixel 11, Pixel 11 Pro, and Pixel 11 Pro XL, scheduling availability through the Google Store and retail partners for August 20.
- Jul 2026: India’s Union Cabinet approved the Mobile Phone Manufacturing Scheme for FY 2026-27 through FY 2030-31, with incentives on eligible sales of phones made in India.
Smartphones Market Report Scope and Research Methodology
Market Definition and Coverage
The global smartphones market measures annual spending and units sold for brand-new, factory-assembled cellular handsets with voice, advanced mobile operating systems, internet-enabled multimedia, integrated app stores, and over-the-air software updates. It covers device sales worldwide across price bands, network generations, form factors, sales channels, and end-user groups.
Scope exclusions: Used or refurbished smartphones, feature phones, tablets and other connected computing devices, separately sold smartphone accessories and replacement parts, and separately billed mobile connectivity and other services are excluded.
Segments Covered in This Report
- By Overall Market Estimates
- Total Market Value (USD)
- Total Market Volume (Units)
- By Operating System (Value, and Volume)
- Android
- iOS
- Others (HarmonyOS, KaiOS)
- By Price Band (Value, and Volume)
- Entry-Level (Less Than USD 200)
- Mid-Range (USD 200-499)
- Premium (USD 500-799)
- Ultra-Premium (More Than USD 800)
- By Technology (Network Generation) (Value)
- 5G
- 4G or LTE
- 3G and Below
- By Form Factor (Value)
- Bar
- Foldable or Flip
- Rugged or Industrial
- By Distribution Channel (Value)
- Operator or Carrier Stores
- Brand-Owned Retail
- Multi-Brand Physical Retail
- Online Direct-to-Consumer
- By End User (Value)
- Consumer or Individual
- Enterprise or SME
- Public Sector or Government
- By Geography
- North America
- United States
- Canada
- Mexico
- South America
- Brazil
- Argentina
- Chile
- Colombia
- Rest of South America
- Europe
- Germany
- France
- United Kingdom
- Italy
- Spain
- Russia
- Rest of Europe
- Asia-Pacific
- China
- India
- Japan
- South Korea
- Southeast Asia (Singapore, Thailand, Indonesia, Vietnam, Philippines, Malaysia)
- Australia
- Rest of Asia-Pacific
- Middle East
- Saudi Arabia
- United Arab Emirates
- Rest of the Middle East
- Africa
- South Africa
- Nigeria
- Rest of Africa
- North America
Data Sources, Market Sizing, and Validation
Desk Research
Desk research draws on public sources such as International Telecommunication Union indicators, World Bank work on affordable connected devices, national communications authorities, and customs authorities to frame connectivity, device affordability, and country market conditions. Public customs classifications and trade data, patent records, and peer-reviewed studies can add evidence on handset flows, technology changes, and adoption drivers, with each source used only for the measure it covers.
Company annual reports, regulatory filings, investor materials, and reputable business press provide cross-checks on handset revenues, shipments, pricing, product mix, and manufacturing activity. Company results are not treated as a direct market total. These sources are not exhaustive, and further sources inform collection, validation and clarification.
Primary Interviews and Surveys
The primary-research approach covers smartphone manufacturers, component and assembly specialists, carriers, distributors, retailers, and enterprise or public-sector buyers across APAC, EMEA, and the Americas. Interview and survey questions check secondary-source definitions, sales timing, device price treatment, shipment-to-sale differences, price-band and channel splits, and regional demand indicators. Where shipment evidence conflicts with company sales disclosures, analysts test whether timing, inventory or product coverage explains the difference, record unresolved assumptions, seek another independent indicator and triangulate before using the input.
Distribution of primary research fieldwork respondents
| Company type | Respondent position | Region |
|---|---|---|
| Top tier: 25% | CXOs: 20% | APAC: 42% |
| Mid tier: 55% | Functional/Unit leaders: 35% | EMEA: 28% |
| Smaller Players: 20% | Managers: 45% | Americas: 30% |
Market-Sizing & Forecasting
The model uses a top-down estimate of global first-sale handset revenue and new-device units, then checks selected totals with manufacturer or supplier roll-ups, channel evidence, and sampled average selling price times volume. Where device prices and unit growth diverge, separate value and volume series preserve that difference. Units respond to replacement timing, network-generation availability, affordability, and population or subscriber trends, while revenue also reflects price-band mix and average selling prices. Segment shares are built from reported operating-system, price-band, technology, form-factor, channel, end-user, and regional evidence, then checked against the corresponding total. Shipment indicators support unit movement, while first-sale revenue estimates draw on handset transaction values. A multivariate regression can relate historical revenue or unit movement to indicators such as 5G adoption, handset affordability, replacement cycles, and premium mix, with scenario analysis used when the direction or timing of a driver is uncertain. Analysts compare variable-level forecasts with manufacturer, carrier, retailer, and buyer evidence. Missing observations are bounded with the nearest comparable public data and explicit assumptions, while selective bottom-up checks are retained as ranges and reconciled to the overall total.
Data Validation & Update Cycle
Analysts triangulate market totals and segment estimates across public statistics, filings, shipment and channel indicators, and respondent evidence, then investigate material variances and outliers against prior periods and related segments. A second review checks definitions, units, geography, arithmetic, and source dates, and analysts re-contact relevant source types when a conflict, unexplained change, or material input gap could alter the estimate. The dataset is refreshed annually, reviewed between cycles after material market events, and given a fresh pre-delivery check for source updates and consistency.
Mordor Intelligence's Smartphones Market Size Measured Against Other Published Estimates
Published estimates can differ in the transactions and products they count and the inputs used to model demand. The global smartphones market measures annual spending and units sold for brand-new, factory-assembled cellular handsets with voice, advanced mobile operating systems, internet-enabled multimedia, integrated app stores, and over-the-air software updates.
Key Gap Drivers include the study's defined coverage and market-specific modeling choices. A multivariate regression can relate historical revenue or unit movement to indicators such as 5G adoption, handset affordability, replacement cycles, and premium mix, with scenario analysis used when the direction or timing of a driver is uncertain.
Benchmark comparison
| Source | Market Size | Gaps in Research Methodology |
|---|---|---|
| Mordor Intelligence | Value: USD 633.3 B (2027) / Volume: 1.2 billion units (2027) | |
| Global Consultancy A | USD 556.4 B (2026) | The estimate measures 2026 revenue, one year before the comparison year, and its published forecast projects continued growth through 2033. |
| Industry Data Provider B | USD 485.3 B (2025) | The source measures 2025 revenue and reports positive growth for that year, leaving later market movement outside its stated estimate. |
Mordor Intelligence's analysts triangulate market totals and segment estimates across public statistics, filings, shipment and channel indicators, and respondent evidence, then investigate material variances and outliers against prior periods and related segments.
Key Questions Answered in the Report
What is the smartphones market size and growth outlook?
The market is estimated at USD 633.3 billion in 2027 and forecast to reach USD 756.5 billion by 2032, at a CAGR of 3.62% during 2027-2032.
What drives demand for new smartphones?
Affordable 5G handsets and on-device AI give owners reasons to upgrade. Dialog introduced the Blackview Shark 6 5G in Sri Lanka in January 2026, while Google paired Pixel 10 with Tensor G5 in 2025.
Which operating system leads smartphone sales value?
Android held the largest segment share at 69.02% of smartphone sales value in 2026.
Which companies are major smartphone competitors?
Major competitors include Samsung Electronics Co. Ltd, Apple Inc., Xiaomi Corporation, OPPO including OnePlus, and Vivo Communication Technology Co., Ltd.
What cost challenge affects smartphone suppliers?
Xiaomi reported significant memory-cost increases as a global industry headwind in the first half of 2026. This pressure can constrain the price and specification combination offered by affordable-device suppliers.
Which regions lead smartphone sales value and growth?
Asia-Pacific held 43.09% of smartphone sales value in 2026. The Middle East is forecast to grow fastest at a CAGR of 10.4% during 2027-2032.