Used and Refurbished Smartphone Market Size and Share
Market Overview
| Study Period | 2020 - 2031 |
|---|---|
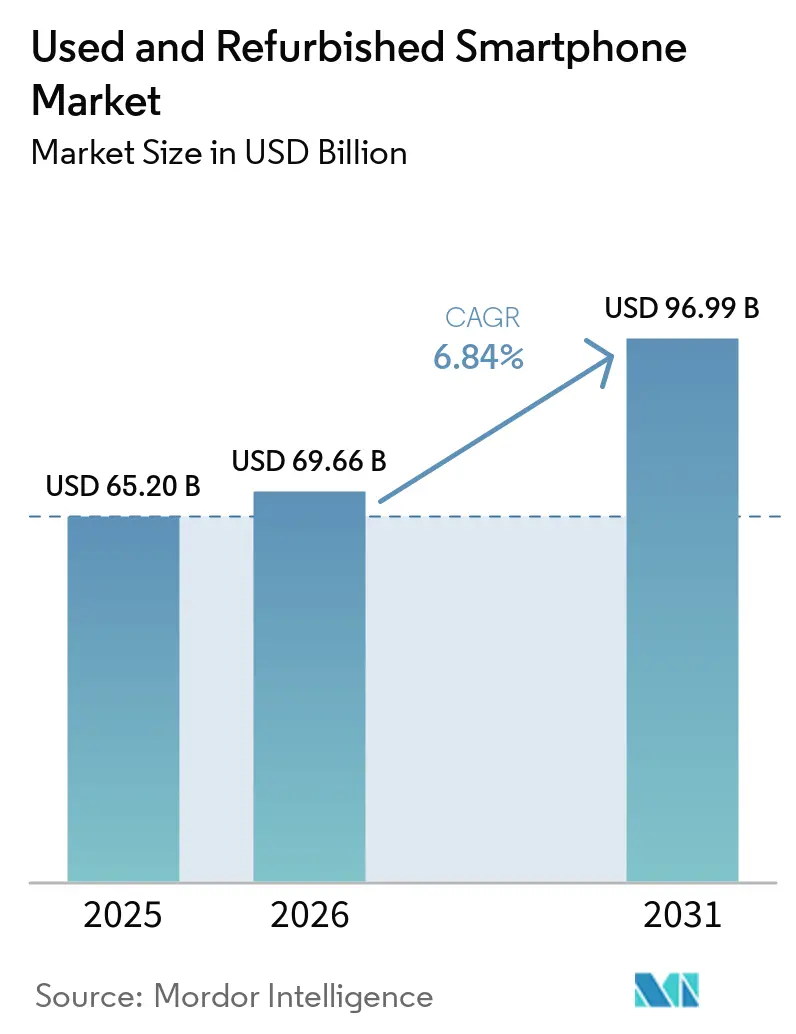
| Market Size (2026) | USD 69.66 Billion |
| Market Size (2031) | USD 96.99 Billion |
| Growth Rate (2026 - 2031) | 6.84% CAGR |
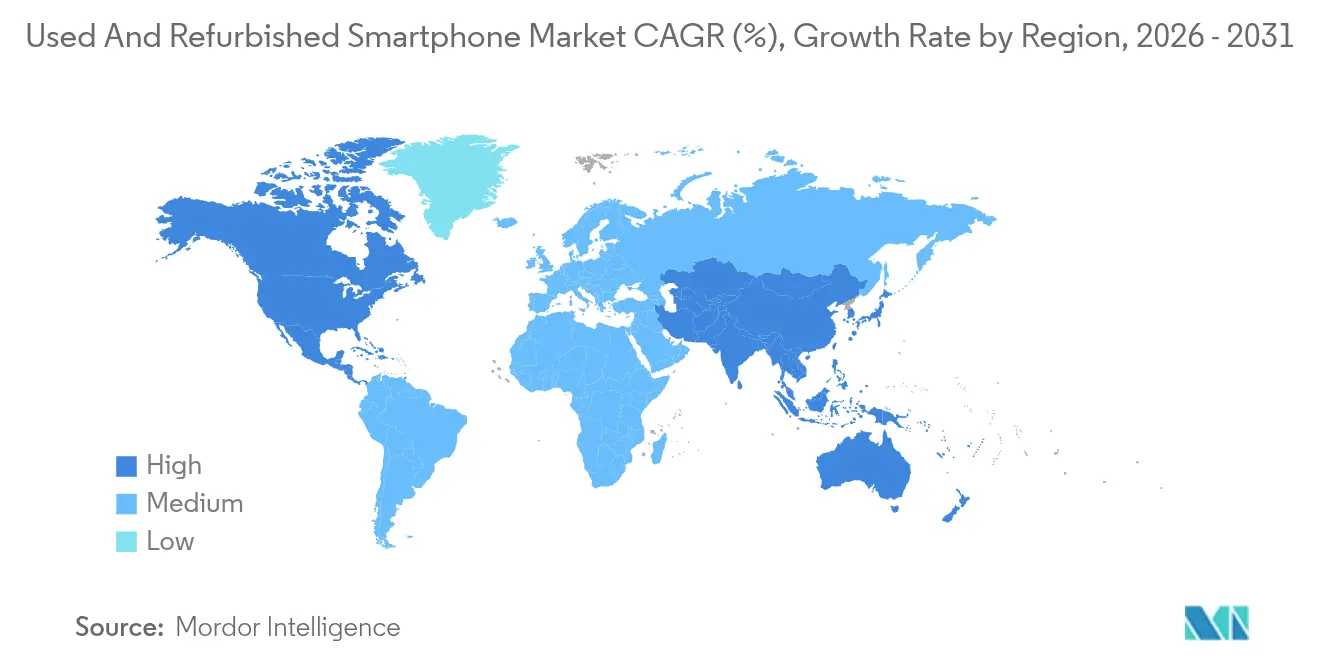
| Fastest Growing Market | Asia Pacific |
| Largest Market | Asia Pacific |
| Market Concentration | Medium |
Major Players
*Disclaimer: Major Players sorted in no particular order Image © Mordor Intelligence. Reuse requires attribution under CC BY 4.0. |
|
Used and Refurbished Smartphone Market Analysis by Mordor Intelligence
The Used And Refurbished Smartphone market size is expected to grow from USD 65.20 billion in 2025 to USD 69.66 billion in 2026 and is forecast to reach USD 96.99 billion by 2031 at 6.84% CAGR over 2026-2031. In terms of shipment volume, the market is expected to grow from 315 million units in 2025 to 430 million units by 2030, at a CAGR of 6.42% during the forecast period (2025-2030). Asia-Pacific region buoyed by high new-device prices, growing OEM trade-in programs, and regulatory pressure to curb e-waste. Flagship devices priced above USD 1,300 push price-sensitive buyers toward certified alternatives, while 5G upgrade cycles recycle a steady flow of near-new handsets into the secondary channel. Online marketplaces have streamlined grading, warranty, and returns, shrinking the trust gap that once limited growth. Enterprises are joining consumers in device reuse to hit emissions goals and trim hardware budgets. Collectively, these forces position the used and refurbished smartphones market for resilient, broad-based expansion.
Key Report Takeaways
- By device condition, used phones held 60.85% of the used and refurbished smartphones market share in 2025; certified pre-owned units are on track for a 7.28% CAGR to 2031.
- By sales channel, online marketplaces captured 38.22% revenue in 2025, whereas OEM-run refurbished stores are advancing at a 8.88% CAGR to 2031.
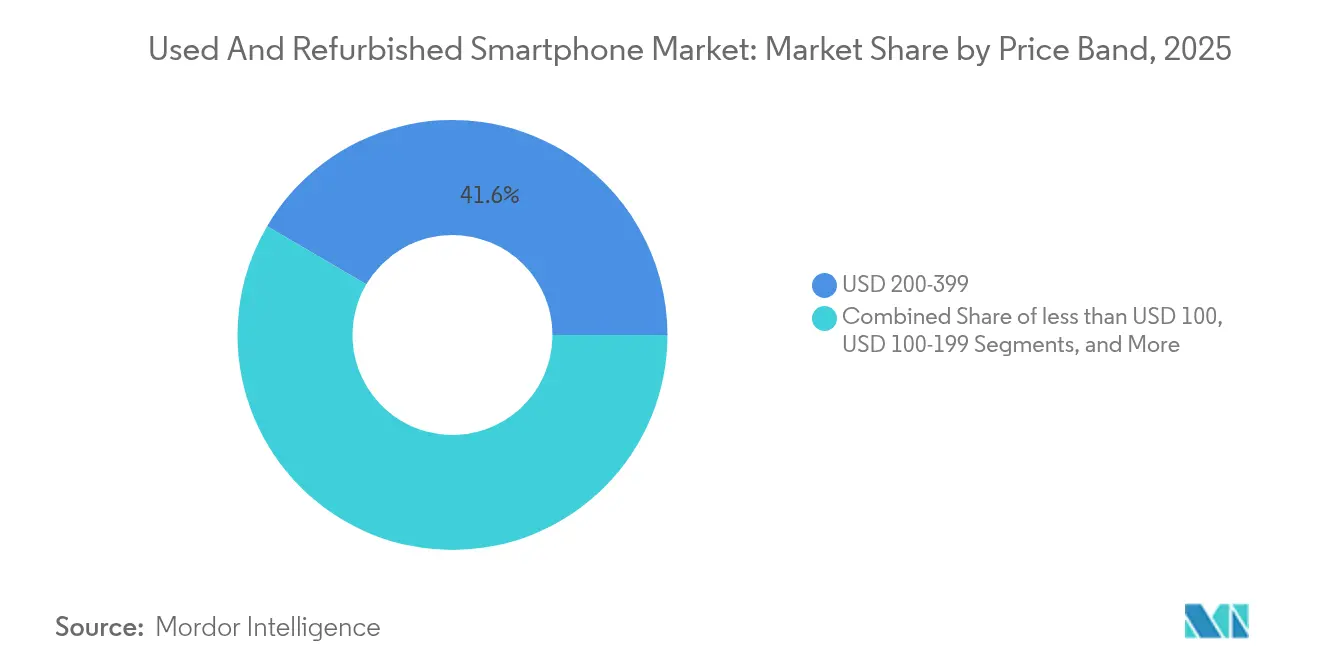
- By price band, the USD 200–399 tier accounted for 41.55% of the used and refurbished smartphones market size in 2025, yet models priced above USD 600 are growing at a 10.08% CAGR to 2031.
- By end user, consumer buyers commanded 65.90% of 2025 revenue, while enterprise demand is climbing 8.52% annually due to lease-back programs.
- By geography, Asia-Pacific led with 41.05% revenue share in 2025 and is forecast to log the fastest 8.66% CAGR through 2031.
Note: Market size and forecast figures in this report are generated using Mordor Intelligence’s proprietary estimation framework, updated with the latest available data and insights as of 2026.
Global Used and Refurbished Smartphone Market Trends and Insights
Drivers Impact Analysis*
| Driver | (~) % Impact on CAGR Forecast | Geographic Relevance | Impact Timeline |
|---|---|---|---|
| Rising smartphone retail prices driving secondary-market demand | +1.8% | Global, with strongest impact in North America and Europe | Medium term (2-4 years) |
| Expansion of online marketplaces enabling convenient transactions | +1.2% | Global, led by Asia Pacific and North America | Short term (≤ 2 years) |
| OEM-led trade-in and certified refurbishment programs | +1.5% | North America and Europe core, expanding to APAC | Medium term (2-4 years) |
| Sustainability regulations and consumer eco-consciousness | +1.1% | Europe leading, North America following, APAC emerging | Long term (≥ 4 years) |
| 5G-driven device replacement cycles increasing used-phone supply | +0.9% | Global, with early gains in developed markets | Short term (≤ 2 years) |
| Enterprise device-leasing models feeding high-grade inventory | +0.4% | North America and Europe, expanding globally | Long term (≥ 4 years) |
| Source: Mordor Intelligence | |||


Rising Smartphone Prices Narrow the Affordability Window
Flagship devices such as the iPhone 16 Pro Max list at USD 1,399.99, placing premium hardware beyond reach for many buyers [1]AT&T, “Apple iPhone 16 Pro Max – Price, Specs, Colors, Size & Reviews,” att.com. Certified units of the same model sell 30-40% lower, widening the value gap that fuels the used and refurbished smartphones market. In emerging economies, refurbished imports often represent the only financially viable path to 5G connectivity, turning price inflation into a structural growth catalyst.
OEM Certification Programs Reset Quality Expectations
Apple, Samsung, and other OEMs guarantee new batteries, cosmetic refurbishing, and full-year warranties, lifting consumer confidence and standardizing device grades. Financing from the European Investment Bank, EUR 17 million to Swappie in 2024, underscores investor belief in scale refurbishment models [2]European Investment Bank, “EIB signs €17 million loan to iPhone refurbisher Swappie,” eib.org.
5G Upgrade Waves Boost Supply Quality
Shorter refresh cycles tied to 5G and AI features push one-to-two-year-old phones into trade-in streams. Assurant processed 22 million devices in 2023, returning USD 3 billion to owners and diverting 1.16 million t CO₂e, evidence that higher-spec units now enter resale channels quickly.
Online Marketplaces Remove Transaction Friction
Platforms such as Amazon Renewed require 130-plus functional tests, while Back Market reported EUR 320 million revenue in 2023 by providing warranties and no-question returns. Trust mechanisms close the historic information gap between buyers and sellers, allowing the used and refurbished smartphones market to scale globally within mainstream e-commerce norms.
Restraints Impact Analysis*
| Restraint | (~) % Impact on CAGR Forecast | Geographic Relevance | Impact Timeline |
|---|---|---|---|
| Consumer concerns around quality and warranties | -0.8% | Global, strongest in emerging markets | Medium term (2-4 years) |
| Proliferation of counterfeit parts and grey-market sellers | -0.6% | Asia Pacific and emerging markets primarily | Short term (≤ 2 years) |
| Software security locks limiting refurb viability | -0.4% | Global, with strongest impact in North America and Europe | Medium term (2-4 years) |
| Tightening e-waste import/export regulations | -0.3% | Global, led by Europe and North America | Long term (≥ 4 years) |
| Source: Mordor Intelligence | |||
Consumer Concerns About Reliability Persist
Even with OEM guarantees, 65% of prospective buyers cite battery degradation and waterproofing loss as top worries, dampening adoption in first-time refurb markets [3]Hindustan Times, “As refurbished tech makes its case, scout a good deal but be wary of red flags,” hindustantimes.com . Educational campaigns and extended warranties remain essential to lower perceived risk.
Counterfeit Components Undercut Trust
Grey-market refurbishers sometimes install non-certified batteries and displays, leading to performance issues and rare safety incidents. Such practices reduce overall market credibility, particularly for budget devices sold in informal channels without verifiable diagnostics.
*Our forecasts treat driver/restraint impacts as directional, not additive. The impact forecasts reflect baseline growth, mix effects, and variable interactions.
Segment Analysis
By Device Condition: Certified Programs Move Upscale
Certified pre-owned units are accelerating at a 7.28% CAGR, while standard used phones still dominate volume at 60.85%. The used and refurbished smartphones market size for certified devices is lifted by automated testing solutions such as Phonecheck that complete diagnostics in two minutes. Increasingly, buyers equate OEM certification with near-new quality, enabling premium pricing.
Peer-to-peer resales remain popular for low-value handsets, yet stringent import laws and upcoming EU right-to-repair mandates are expected to push more trade through professional refurbishers. This structural shift narrows the quality gap and pushes value toward branded, warrantied inventory.


By Sales Channel: Digital Platforms Lead, OEM Stores Surge
Online portals accounted for 38.22% of 2025 turnover, reflecting consumer preference for click-to-door convenience and transparent return policies. Carrier trade-in desks feed inventory pipelines; AT&T alone collected 12.5 million devices in 2024. OEM storefronts, though smaller, are the fastest-growing channel at 8.88% CAGR as brands monetize secondary demand directly while safeguarding user experience.
Physical retailers retain relevance for shoppers who value in-hand inspection, especially in emerging markets where digital payment penetration lags. Blended online-offline strategies, including kiosk-based instant payment options, are gaining traction to ease the transition.
By Price Band: Premium Devices Outpace Volume Leaders
The USD 200-399 bracket delivered 41.55% of units in 2025. Yet phones priced above USD 600 advanced 10.08% annually as warranties and strict grading bolster buyer confidence in secondary ticket purchases. The market share of used and refurbished smartphones in the premium tiers is forecast to double by 2031, driven by a steady influx of recent flagship 5G models.
Sub-USD 100 phones target first-time smartphone adopters but suffer from limited parts availability and higher failure rates, forcing refurbishers to balance affordability against brand reputation.
By End User: Enterprises Turn Sustainability Into Savings
Enterprise buyers represented 34.10% of 2025 revenue and will grow 8.52% annually through 2031. Lease-return fleets provide uniform, high-grade stock and allow companies to hit emissions targets, given that reusing one smartphone avoids 55 kg CO₂e on average. Cashify’s move into B2B services underpins the commercial upside of aligning refurbishment with ESG reporting.
Government agencies, especially in the EU, are piloting refurbished provisioning to support circular-economy mandates. Such institutional adoption further normalizes pre-owned devices and enlarges addressable demand.
Geography Analysis
Asia-Pacific generated the largest share at 41.05% in 2025, reflecting deep mobile penetration and rapid 5G rollouts. Japan logged 3.15 million secondary sales in fiscal year 2024, up 15.5% year on year, aided by wide retail distribution and aggressive marketing of certified stock. China’s e-commerce giants have added dedicated refurbished sections, accelerating mainstream acceptance.
India shows unmet demand constrained by supply gaps; unit volumes dipped 5-7% in 2025 despite Cashify posting INR 955 crore (USD 118 million) revenue, underscoring the importance of collection networks. Southeast Asia, with 20% annual smartphone growth, combines young demographics with rising data consumption, positioning the region for outsized share gains within the used and refurbished smartphones market.
North America leverages mature carrier programs, yet 70% of owners still retain retired devices, signaling latent supply. Corporate take-back schemes and right-to-repair laws could unlock additional flow. Europe benefits from the Ecodesign Directive, effective June 2025, which requires spare-parts availability for seven years, lowering refurbishment costs and enhancing device lifetimes.

Competitive Landscape
The marketplace is moderately concentrated. Apple and Samsung anchor the premium tier with factory-certified offerings that capitalize on ecosystem loyalty. Amazon Renewed, operating at a global scale, provides an all-in-one funnel from diagnostics to fulfillment, leveraging its logistics backbone.
Back Market’s EUR 320 million turnover in 2023 validated a pure-play marketplace model centered on strict vetting and buyer protection. Swappie specializes in iPhones and uses robotics to lift throughput, assisted by its EIB loan to automate refurb lines. Assurant’s AI-enabled grading handles 22 million units yearly, exemplifying how technology reduces per-device processing cost and raises consistency.
Entry barriers arise from R2/RIOS certifications covering data security and environmental protocols. These standards demand capital-intensive testing labs and closed-loop waste handling, favoring incumbents with deep refurb expertise.
Used and Refurbished Smartphone Industry Leaders
-
Samsung Electronics Co., Ltd.
-
Amazon.com, Inc.
-
Recommerce Group
-
Verizon Communications Inc.
-
AT&T Inc.
- *Disclaimer: Major Players sorted in no particular order


Recent Industry Developments
- February 2025: AT&T began accepting broken iPhones for trade-in toward iPhone 16 upgrades, broadening device intake eligibility.
- December 2024: UAE-based Revibe secured USD 7 million Series A to expand Middle-East processing hubs.
- October 2024: Mobile Klinik partnered with Apkudo to deploy automated diagnostics across Canadian service centers.
- May 2024: European Investment Bank extended a EUR 17 million loan to Swappie to fund robotics-enhanced refurbishment capacity.


Global Used and Refurbished Smartphone Market Report Scope
A refurbished phone generally refers to a pre-owned handset that has been returned due to a fault and repaired for resale. Refurbished smartphones are a cost-effective solution for customers looking to save money while purchasing a smartphone.
The scope of the study covers both officially used and refurbished smartphone markets, where trade-in for upgrades in the mature market is also considered as part of the study. OEMs use it to push the adoption of premium devices by making upfront costs affordable, whereas telcos are using it to offer bundled services.
The used and refurbished smartphone market is segmented by geography (North America, Europe, Asia-Pacific, and the Rest of the World). The report offers market sizes in volume (shipment units) for all the above segments.
| Used |
| Refurbished/Certified Pre-Owned |
| Online Marketplaces |
| Offline Retailers |
| Carrier/Operator Trade-In Programs |
| OEM Certified Refurbished Stores |
| Wholesale/B2B |
| < USD 100 |
| USD 100–199 |
| USD 200–399 |
| USD 400–599 |
| ≥ USD 600 |
| Consumer/Individual |
| Business/Enterprise |
| Government/Institutional |
| North America | United States |
| Canada | |
| Mexico | |
| South America | Brazil |
| Argentina | |
| Rest of South America | |
| Europe | Germany |
| United Kingdom | |
| France | |
| Italy | |
| Spain | |
| Russia | |
| Rest of Europe | |
| Asia Pacific | China |
| India | |
| Japan | |
| South Korea | |
| Southeast Asia | |
| Rest of Asia Pacific | |
| Middle East | Saudi Arabia |
| United Arab Emirates | |
| Turkey | |
| Rest of Middle East | |
| Africa | South Africa |
| Nigeria | |
| Egypt | |
| Rest of Africa |
| By Device Condition | Used | |
| Refurbished/Certified Pre-Owned | ||
| By Sales Channel | Online Marketplaces | |
| Offline Retailers | ||
| Carrier/Operator Trade-In Programs | ||
| OEM Certified Refurbished Stores | ||
| Wholesale/B2B | ||
| By Price Band | < USD 100 | |
| USD 100–199 | ||
| USD 200–399 | ||
| USD 400–599 | ||
| ≥ USD 600 | ||
| By End User | Consumer/Individual | |
| Business/Enterprise | ||
| Government/Institutional | ||
| By Geography | North America | United States |
| Canada | ||
| Mexico | ||
| South America | Brazil | |
| Argentina | ||
| Rest of South America | ||
| Europe | Germany | |
| United Kingdom | ||
| France | ||
| Italy | ||
| Spain | ||
| Russia | ||
| Rest of Europe | ||
| Asia Pacific | China | |
| India | ||
| Japan | ||
| South Korea | ||
| Southeast Asia | ||
| Rest of Asia Pacific | ||
| Middle East | Saudi Arabia | |
| United Arab Emirates | ||
| Turkey | ||
| Rest of Middle East | ||
| Africa | South Africa | |
| Nigeria | ||
| Egypt | ||
| Rest of Africa | ||


Key Questions Answered in the Report
What is the current value of the used and refurbished smartphones market?
The market size reached USD 69.66 billion in 2026 and is projected to hit USD 96.99 billion by 2031.
How fast is Asia-Pacific growing?
Asia-Pacific leads with an 8.66% CAGR, backed by robust device trade-in programs and rising 5G adoption.
Why are certified pre-owned phones gaining traction?
OEM warranties, new batteries, and rigorous testing elevate trust, driving a 7.28% CAGR for certified units.
Which price tier is expanding the quickest?
Models priced above USD 600 show the fastest 10.08% CAGR as buyers seek premium features at lower cost.
How do enterprises benefit from refurbished devices?
Organizations cut hardware expense and lower emissions; reusing one phone can avoid 55 kg CO₂e on average.
What limits market growth today?
Consumer doubts about component quality and counterfeit parts in informal channels remain primary headwinds.
Page last updated on:


