Foldable Smartphone Market Size and Share
Market Overview
| Study Period | 2020 - 2031 |
|---|---|
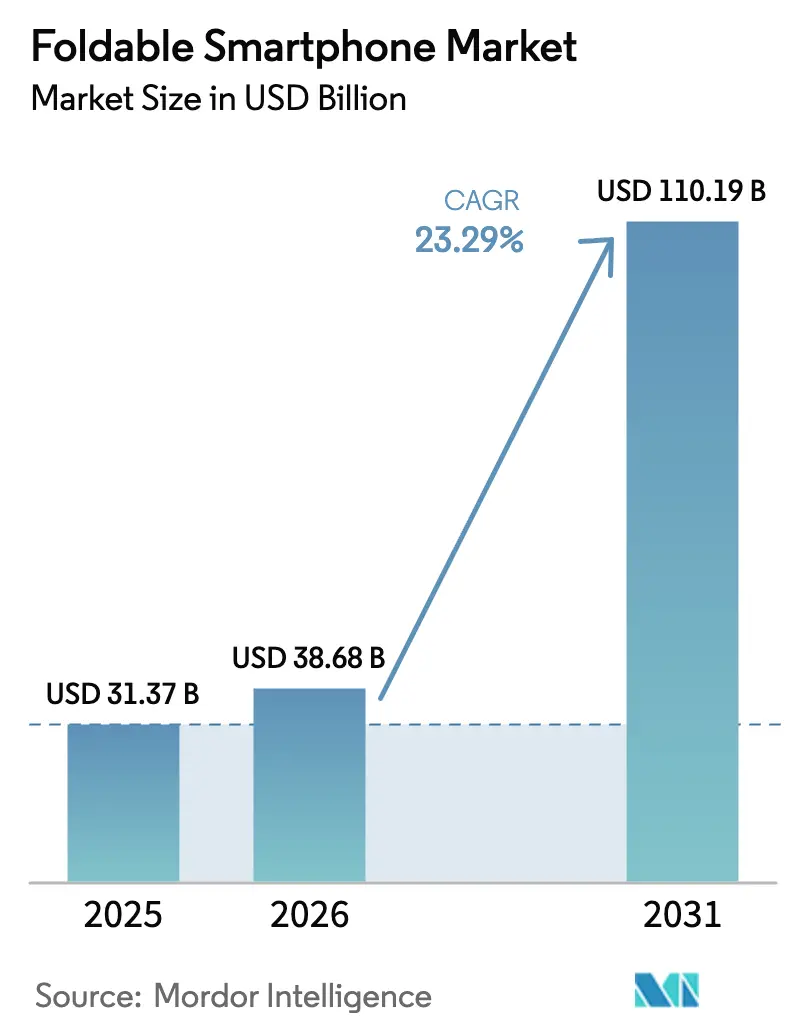
| Market Size (2026) | USD 38.68 Billion |
| Market Size (2031) | USD 110.19 Billion |
| Growth Rate (2026 - 2031) | 23.29% CAGR |
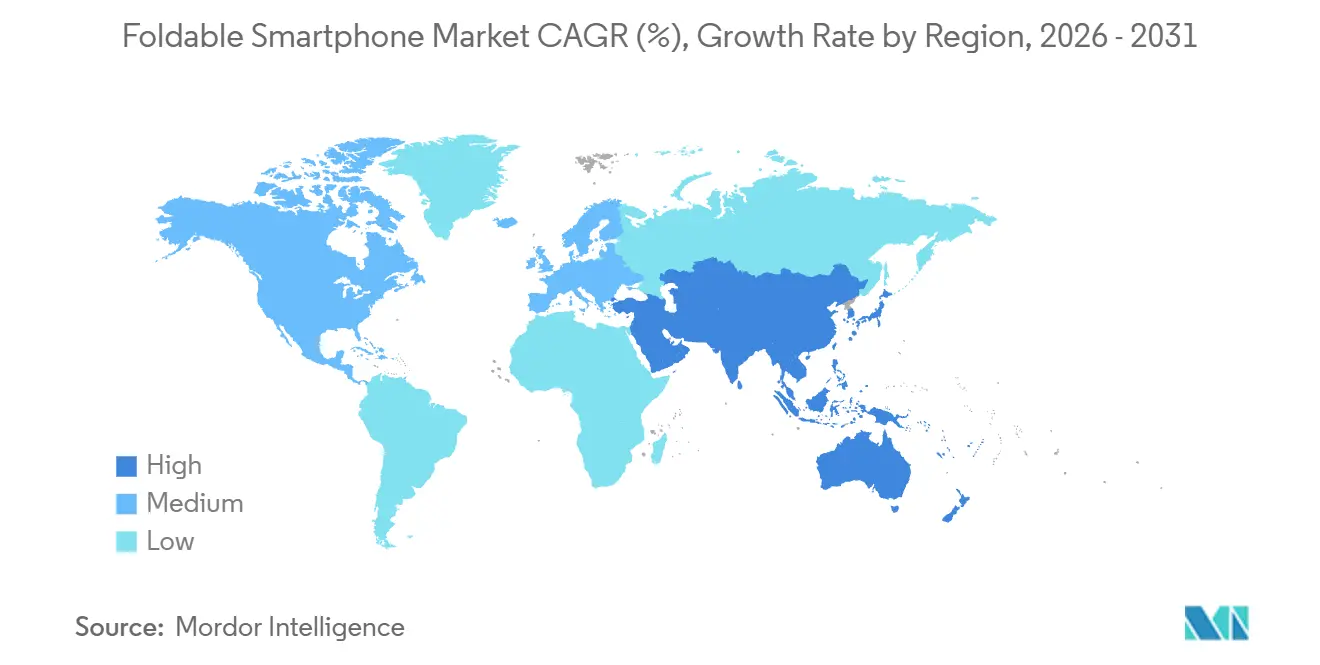
| Fastest Growing Market | Middle East |
| Largest Market | Asia Pacific |
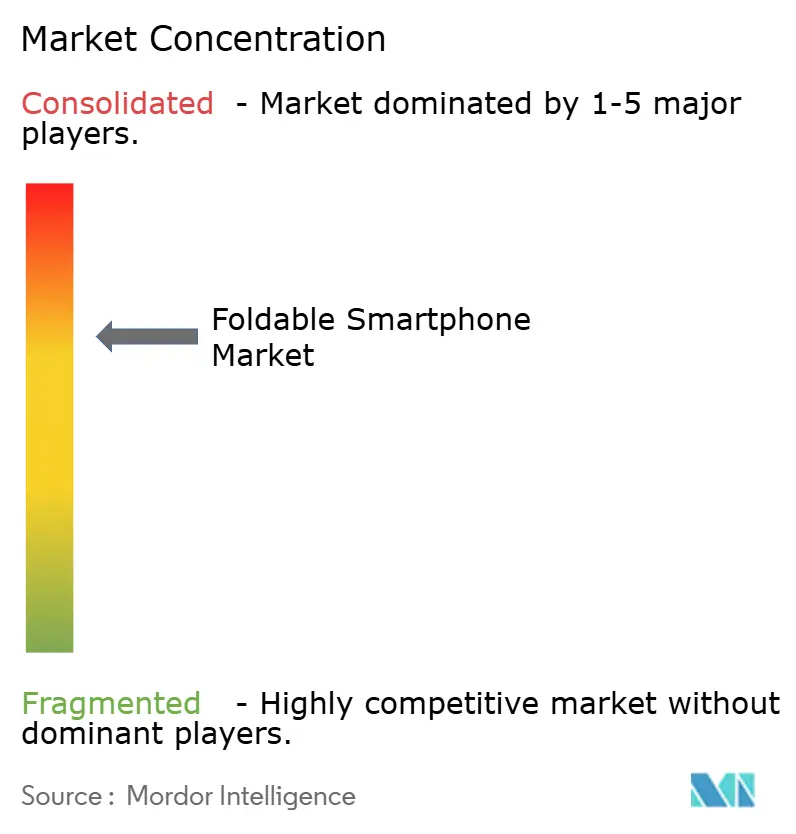
| Market Concentration | Medium |
Major Players *Disclaimer: Major Players sorted in no particular order Image © Mordor Intelligence. Reuse requires attribution under CC BY 4.0. | |
Foldable Smartphone Market Analysis by Mordor Intelligence
The Foldable Smartphone Market size is expected to increase from USD 31.37 billion in 2025 to USD 38.68 billion in 2026 and reach USD 110.19 billion by 2031, growing at a CAGR of 23.29% over 2026-2031. Ultra-thin-glass (UTG) yields surpassed 85% in 2025, panel prices declined by 30% between 2024 and 2025, and carrier subsidies paired with 5G unlimited-data plans pulled premium devices below the USD 1,500 threshold, lowering adoption friction across consumer and enterprise segments. Enterprise deployments doubled in logistics and field-service verticals, while book-style models captured 62.31% of 2025 revenue and 7-8 inch screens secured 44.34% share as users replaced tablets with split-screen workflows. Asia-Pacific led with 54.84% of global revenue, Middle East demand rose fastest at a 23.43% CAGR, and North America plus Europe remained premium strongholds for Samsung’s Galaxy Z series even as Chinese challengers expanded via e-commerce. Form-factor innovation now spans rollable and slide-out concepts, and enterprise uptake at 26.19% CAGR signals that productivity gains, not just consumer enthusiasm, will shape the next replacement cycle.
Key Report Takeaways
- By form factor, book-style devices led with 62.31% revenue share in 2025; rollable and slide-out designs are set to post the fastest 24.21% CAGR through 2031.
- By screen size, the 7-8 inch category contributed 44.34% of 2025 revenue, whereas displays above 8 inches are forecast to expand at 25.76% CAGR to 2031.
- By price range, units priced between USD 1,500-1,999 are advancing at the quickest 26.52% CAGR even though models priced USD 1,000-1,499 accounted for 48.51% of 2025 revenue.
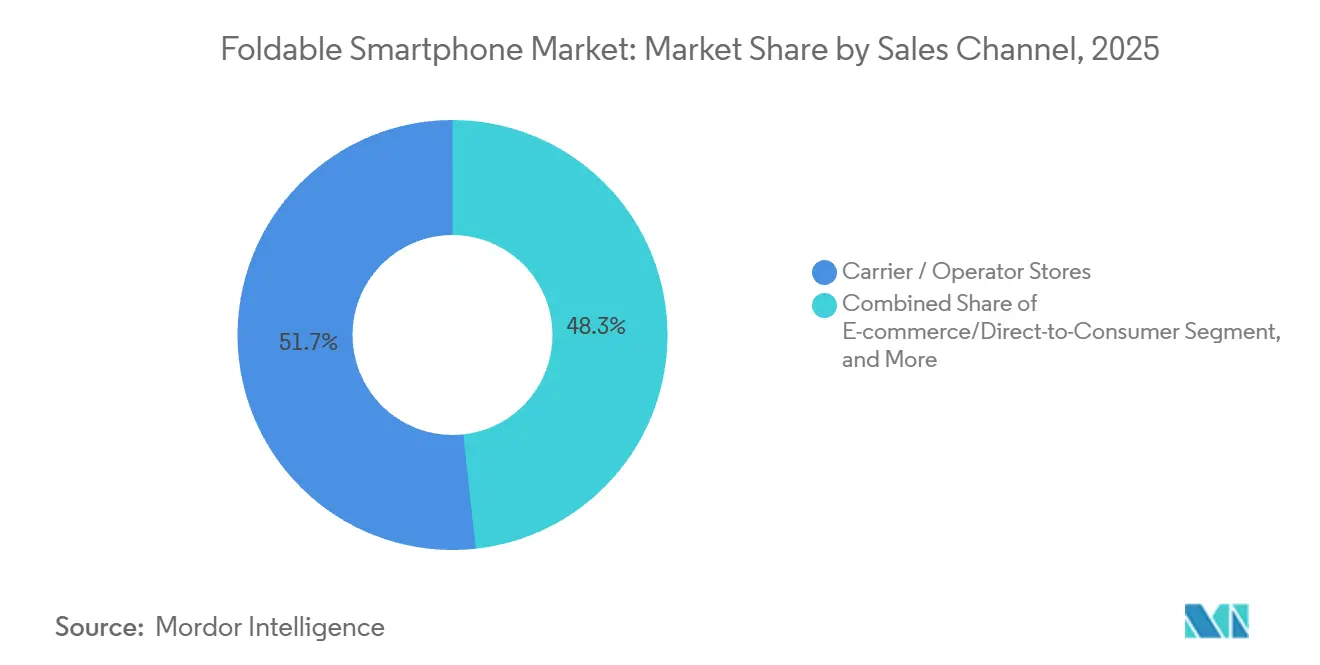
- By sales channel, carrier and operator stores commanded 51.73% of 2025 sales, yet e-commerce and direct-to-consumer channels are growing at 24.32% CAGR through 2031.
- By end user, consumers delivered 72.46% of 2025 revenue, but enterprise purchases are accelerating at a 26.19% CAGR on demonstrated 22% productivity gains in pilot programs.
- By geography, Asia-Pacific controlled 54.84% of 2025 revenue, while the Middle East is the fastest-growing region at 23.43% CAGR for the forecast horizon.
Note: Market size and forecast figures in this report are generated using Mordor Intelligence’s proprietary estimation framework, updated with the latest available data and insights as of January 2026.
Global Foldable Smartphone Market Trends and Insights
Drivers Impact Analysis*
| Driver | (~) % Impact on CAGR Forecast | Geographic Relevance | Impact Timeline |
|---|---|---|---|
| Rapid Advancements in Ultra-Thin Glass Yield Rates | +4.2% | Global, with manufacturing concentrated in South Korea, China | Medium term (2-4 years) |
| Carrier Subsidization Strategies for Premium 5G Plans | +3.8% | North America, Europe, Middle East | Short term (≤ 2 years) |
| Enterprise Demand for Foldables to Support Field-Productivity Apps in Logistics Sector | +3.5% | Global, early adoption in North America, Asia-Pacific logistics hubs | Medium term (2-4 years) |
| Content-Streaming Partnerships Requiring Wider Aspect Ratios | +2.1% | Global, led by North America and Europe content consumption | Medium term (2-4 years) |
| Declining Per-Unit Cost of Flexible AMOLED Panels | +4.9% | Global, supply concentrated in South Korea, China | Short term (≤ 2 years) |
| Emergence of Foldable-Specific Mobile Gaming Titles Monetized via In-App Purchases | +2.3% | Asia-Pacific core, spill-over to North America, Europe | Long term (≥ 4 years) |
| Source: Mordor Intelligence | |||
Rapid Advancements in Ultra-Thin Glass Yield Rates
Ultra-thin-glass yield improvements from 60% in 2023 to 85% in 2025 cut scrap costs and enabled sub-USD 1,000 models for emerging markets without eroding gross margins. Samsung Display and Corning achieved 30 micrometer substrates via precision chemical etching, reducing dependence on polyimide films that scratch easily. As yields approach 90% by 2027, the cost gap between foldable and conventional flagship displays is projected to shrink below 15%, paving the path for broader adoption.
Declining Per-Unit Cost of Flexible AMOLED Panels
A 30% price drop between 2024 and 2025 followed BOE and Visionox capacity expansions that added 50,000 m² of Gen-6 OLED lines and Samsung Display’s low-temperature polycrystalline oxide licensing program. Cheaper panels now support 120 Hz and HDR10+ on mid-tier devices, absorb tariff volatility, and align with EU energy directives, as OLED manufacturing consumes 40% less energy than LCD.[1]International Energy Agency, “Energy Efficiency in Electronics Manufacturing,” iea.org
Carrier Subsidization Strategies for Premium 5G Plans
North American and European operators embed foldables into unlimited-data bundles, offering as much as USD 1,000 in trade-in credits that halve upfront costs. Middle East carriers mirror the model to attract high-income subscribers, although sustained subsidy spending strains margins and is expected to taper after 2027.
Enterprise Demand for Foldables to Support Field-Productivity Apps in Logistics Sector
Deployments doubled in 2025; DHL reported 22% faster inventory audits using 5,000 Galaxy Z Fold5 units, and Microsoft built Dynamics 365 features that exploit dual-screen workflows. Recurring managed-service contracts boost OEM revenue beyond hardware sales, though cost-sensitive industries still balk at USD 1,500 price tags.
Restraints Impact Analysis*
| Restraint | (~) % Impact on CAGR Forecast | Geographic Relevance | Impact Timeline |
|---|---|---|---|
| Sub-200k Cycle Hinge Durability Concerns in Humid Tropics | -2.8% | Southeast Asia, South Asia, Sub-Saharan Africa, Latin America | Short term (≤ 2 years) |
| Limited App Optimization for Multi-Window Foldable UI | -2.3% | Global, most acute in markets with fragmented app ecosystems | Medium term (2-4 years) |
| Supply-Chain Bottlenecks for UTG and Hinge Components (Post-2023 Taiwan Quake) | -1.9% | Global, manufacturing concentrated in Taiwan, South Korea | Short term (≤ 2 years) |
| Volatile Import Tariffs on Flexible OLED Components in Key Emerging Markets | -1.6% | India, Brazil, Southeast Asia, Middle East and Africa | Medium term (2-4 years) |
| Source: Mordor Intelligence | |||
Sub-200k Cycle Hinge Durability Concerns in Humid Tropics
Field reports from Indonesia and coastal India show hinges failing within 18 months, three times the claim-rate of temperate markets, due to corrosion from sustained 80% humidity. OEMs face elevated warranty costs and explore sealed or coated mechanisms that increase weight and bill-of-materials.
Volatile Import Tariffs on Flexible OLED Components in Key Emerging Markets
India’s 2025 duty exemptions on batteries and displays dropped component costs 12%, but Brazil’s 60% electronics import levy and Nigeria’s FX caps still constrain retail affordability.[2]Government of India Ministry of Finance, “Import Duty Exemptions Notification,” finmin.nic.in
*Our forecasts treat driver/restraint impacts as directional, not additive. The impact forecasts reflect baseline growth, mix effects, and variable interactions.
Segment Analysis
By Form Factor: Rollables Challenge Book-Style Dominance
Book-style units held 62.31% of 2025 foldable smartphone market share, anchored by Samsung’s Galaxy Z Fold line and Huawei’s Mate X series. Rollable displays from OPPO and Motorola, growing at 24.21% CAGR, promise crease-free expansion from 6.7 inches to 7.4 inches without added thickness, positioning the foldable smartphone market for another wave of form-factor disruption.
Folding clamshells, prized for pocketability, sustain demand among fashion-forward buyers, while outward-fold designs remain niche due to screen-protection challenges. Tri-fold prototypes hint at future 10-inch displays that could further enlarge the foldable smartphone market size for productivity-oriented professionals.


By Screen Size: Larger Displays Drive Tablet Replacement
The 7-8 inch bracket generated 44.34% of 2025 revenue as customers used single devices to replace tablets, and models exceeding 8 inches are slated for a 25.76% CAGR to 2031. These gains underline a strategic pivot within the foldable smartphone market toward bigger canvases that accommodate side-by-side applications.
Clamshells below 6.9 inches endure for portability, but enterprise buyers gravitate to 7-8 inch devices where foldable smartphone market size expansion aligns with ERP and video-conferencing use cases. Screen-ratio experimentation, such as 21:9 unfolded versus 25:9 folded, aims to balance usability and thickness.
By Price Range: Mid-Premium Segment Expands Fastest
Units priced USD 1,000-1,499 delivered 48.51% of 2025 revenue, yet the USD 1,500-1,999 tier is advancing at 26.52% CAGR as OEMs integrate periscope lenses, titanium frames, and IP68 sealing without breaching USD 2,000. This “premiumization with accessibility” tightens the gap between foldables and slate flagships within the foldable smartphone market.
Devices above USD 2,000 remain limited to Samsung’s and Huawei’s highest-end entries, while sub-USD 1,000 concepts from TECNO and OnePlus indicate looming price compression that could broaden foldable smartphone market penetration.
By Sales Channel: E-Commerce Erodes Carrier Dominance
Carrier stores still accounted for 51.73% of 2025 sales, but direct-to-consumer websites and marketplaces are scaling at 24.32% CAGR as brands leverage online trade-ins, extended warranties, and virtual try-on tools.
Carrier lock-ins dominate in regions with heavy subsidies like North America, whereas price transparency and flash sales drive Asia-Pacific’s e-commerce leadership, reshaping revenue streams inside the foldable smartphone market.
By End User: Enterprise Adoption Accelerates
Consumers generated 72.46% of 2025 revenue, but business deployments are climbing at a 26.19% CAGR after documented 22% efficiency gains in warehouse audits, steering the foldable smartphone market toward recurring service models.
Government pilots in Singapore and the U.S. Veterans Affairs hint at future public-sector demand once security certifications mature, gradually shifting foldable smartphone market size contributions from pure hardware to managed mobility.
Geography Analysis
Asia-Pacific captured 54.84% of 2025 revenue, as Huawei, Honor, Xiaomi, and Oppo shipped over 8 million units in three quarters despite chipset supply constraints, underscoring how local ecosystems power foldable smartphone market leadership. China’s Mate XT tri-fold sold out at CNY 19,999 (USD 2870.78), South Korea enjoys high per-capita uptake, and India’s tariff relief in March 2025 trimmed costs, though price remains a hurdle for mass buyers. Southeast Asia’s rising incomes and carrier subsidies are widening the foldable smartphone market, yet hinge failures in humid climates are tempering momentum.
The Middle East exhibits the highest CAGR of 23.43%, propelled by Vision 2030 digitization targets and zero-down carrier bundles that place USD 1,800 devices within the reach of affluent consumers. Saudi Arabia’s Public Investment Fund earmarked USD 500 million for digital government services, creating procurement opportunities that will expand the foldable smartphone market across the enterprise and public sectors.[3]Saudi Arabia Public Investment Fund, “Annual Report 2025,” pif.gov.sa
North America accounts for roughly 22% of 2025 revenue; Samsung’s 64% share is maintained through partnerships with Verizon, AT&T, and T-Mobile, though Google’s Pixel 9 Pro Fold launches at USD 1,799 with limited channel reach. Europe mirrors this premium profile, while Latin America and Africa collectively stay below 5% share because of tariffs and currency risk, suggesting future growth will depend on local assembly and enterprise seeding.

Competitive Landscape
Foldable smartphone market concentration is moderate. Samsung, Huawei, and Motorola shipped 80% of 2025 units, yet shares are fragmenting as Honor, Xiaomi, Oppo, and vivo expand abroad. Samsung’s vertical integration secures 40% gross margins, Huawei’s domestic resurgence leverages tri-fold innovation and nationalism, and Motorola’s sub-USD 1,000 Razr targets style-centric buyers.
Patent portfolios diverge: Samsung files for under-display cameras plus S Pen-ready hinges, OPPO pursues rollable technology, and Apple’s out-fold concepts signal future disruption once display reliability meets Cupertino’s tolerances. White-space opportunities lie under USD 800 and in enterprise-grade devices with enhanced stylus and desktop modes.
BOE’s USD 2.8 billion OLED expansion prepares a shift from component supplier to white-label OEM, potentially reshaping supply dynamics. Meanwhile, TECNO and OnePlus aim at emerging markets, and Google’s second-generation Pixel Fold deepens the Android tight-integration play. Competitive intensity will hinge on hinge durability, software optimization, and AI-powered multitasking that maximizes foldable real estate.
Foldable Smartphone Industry Leaders
Samsung Electronics Co. Ltd.
Huawei Technologies Co. Ltd.
Motorola Mobility LLC (Lenovo Group Limited)
Xiaomi Corp.
Oppo Co. Ltd.
- *Disclaimer: Major Players sorted in no particular order

Recent Industry Developments
- September 2025: Huawei released the tri-fold Mate XT Ultimate Design at CNY 19,999 (USD 2,800); stock sold out in hours in China.
- August 2025: Google unveiled Pixel 9 Pro Fold with an 8-inch display and Tensor G4 SoC across 15 markets at USD 1,799.
- July 2025: Samsung launched Galaxy Z Fold6 and Flip6 with hinges rated for 500,000 folds, maintaining USD 1,799 pricing.
- June 2025: Motorola took Razr 50 Ultra global at USD 999, positioning beneath the Flip6.


Research Methodology Framework and Report Scope
Market Definitions and Key Coverage
Our study defines the foldable smartphone market as all factory-built handheld phones whose principal display bends, folds, or rolls while maintaining full touchscreen and mobile-OS functionality. Coverage spans book-style, clamshell, outward-fold, rollable, and dual-rigid-screen designs that reach consumer or enterprise channels worldwide.
Scope exclusion: larger foldable tablets, laptops, and rugged industrial handhelds are outside this assessment.
Segmentation Overview
- By Form Factor
- Clamshell (Vertical Fold)
- Book-Style (Horizontal Fold)
- Outward Fold
- Rollable/Slide-out
- By Screen Size
- Less than Equal 6.9 inch
- 7 - 8 inch
- Greater than to 8 inch
- By Price Range
- Less than USD 1,000
- USD 1,000 - 1,499
- USD 1,500 - 1,999
- Greater than equal USD 2,000
- By Sales Channel
- Carrier/Operator Stores
- Consumer Electronics and Specialty Retail
- E-commerce/Direct-to-Consumer
- By End User
- Consumer
- Enterprise/Corporate
- Government and Defense
- By Geography
- North America
- United States
- Canada
- Mexico
- Europe
- Germany
- United Kingdom
- France
- Italy
- Spain
- Russia
- Rest of Europe
- Asia Pacific
- China
- Japan
- India
- South Korea
- ASEAN
- Australia and New Zealand
- Rest of Asia Pacific
- South America
- Brazil
- Argentina
- Rest of South America
- Middle East
- Saudi Arabia
- UAE
- Turkey
- Rest of Middle East
- Africa
- South Africa
- Nigeria
- Rest of Africa
- North America
Detailed Research Methodology and Data Validation
Primary Research
Mordor's team held structured interviews and short surveys with display fabs, tier-1 carriers, component makers, and distributors across Asia-Pacific, North America, and Europe. These conversations validated shipment splits, average selling prices, hinge-failure returns, and enterprise adoption intentions, letting us fine-tune assumptions surfaced during desk work.
Desk Research
We first map global supply-and-demand signals from trusted, non-paywalled outlets such as UN Comtrade shipment codes, GSMA Intelligence connection trackers, ITU digital-adoption dashboards, and device bulletins from regional trade groups. Corporate filings, carrier procurement notices, patent grants, and reputable press flesh out hinge cycles, display yields, and subsidy trends. Mordor analysts then enrich these public inputs with paid intelligence drawn selectively from D&B Hoovers and Dow Jones Factiva. The sources listed illustrate the broader pool; many others underpin every estimate.
Market-Sizing & Forecasting
A top-down model converts reported unit shipments and channel sell-through into revenue using region-specific ASP curves, then cross-checks results through selective bottom-up supplier roll-ups. Key drivers embedded in our multivariate regression include ultra-thin-glass yield gains, carrier premium-plan penetration, hinge-durability certifications, panel ASP trajectories, subsidy depth, and replacement-cycle length. Scenario analysis stress-tests shocks such as tariff shifts or a delayed Apple entry, and data gaps are bridged with analog ratios from matched geographies.
Data Validation & Update Cycle
Outputs pass analyst peer review, senior domain checks, and variance alerts against external indicators. We refresh models yearly and reopen them mid-cycle if material events occur, ensuring clients receive the latest calibrated view.
Why Mordor's Foldable Smartphone Baseline Stands Firm
Published figures differ because firms mix scopes, price bases, and refresh timings. The largest gaps stem from whether rollable prototypes count, how fast ASP erosion is modeled, the breadth of channel coverage, and the currency year applied.
According to Mordor Intelligence, our study captures the full device spectrum yet filters out non-phone form factors, aligns ASPs with live subsidy data, and updates annually, giving decision-makers a balanced midpoint.
Benchmark comparison
| Market Size | Anonymized source | Primary gap driver |
|---|---|---|
| USD 31.30 B (2025) | Mordor Intelligence | - |
| USD 34.65 B (2024) | Global Consultancy A | Book & flip only, limited channel visibility, older baseline year |
| USD 30.04 B (2025) | Industry Journal B | Unit × ASP build, omits rollable formats, slower refresh |
| USD 29.64 B (2025) | Regional Consultancy C | Flexible-display proxy, no primary interviews, single-year FX |
Taken together, peer values cluster yet tilt upward or downward when scope narrows or data ages. By grounding our estimate in transparent variables and an annual refresh cycle, Mordor delivers a dependable starting point for strategy, budgeting, and investment planning.


Key Questions Answered in the Report
What CAGR is forecast for the foldable smartphone market through 2031?
The foldable smartphone market is projected to grow at a 23.29% CAGR between 2026 and 2031.
Which form factor currently leads revenue?
Book-style models held 62.31% revenue share in 2025.
Which region is expanding fastest?
The Middle East is poised for the highest 23.43% CAGR through 2031.
How big is enterprise demand relative to consumers?
Enterprises accounted for 27.54% of 2025 revenue and are growing at a 26.19% CAGR, outpacing consumer growth.
What price segment shows the quickest growth?
Devices priced USD 1,500-1,999 are expanding at a 26.52% CAGR.
Which companies dominate shipments?
Samsung, Huawei, and Motorola together shipped 80% of units in 2025.
Page last updated on:


