
Saudi Arabia Entertainment And Amusement Market Size and Share
Market Overview
| Study Period | 2020 - 2031 |
|---|---|
| Forecast Data Period | 2026 - 2031 |
| Base Year Market Size (2025) | USD 2.65 Billion |
| Market Size (2026) | USD 2.98 Billion |
| Market Size (2031) | USD 5.36 Billion |
| Growth Rate (2026 - 2031) | 12.40 % |
| Market Concentration | Medium |
Major Players *Disclaimer: Major Players sorted in no particular order Image © Mordor Intelligence. Reuse requires attribution under CC BY 4.0. | |
Saudi Arabia Entertainment And Amusement Market Analysis by Mordor Intelligence
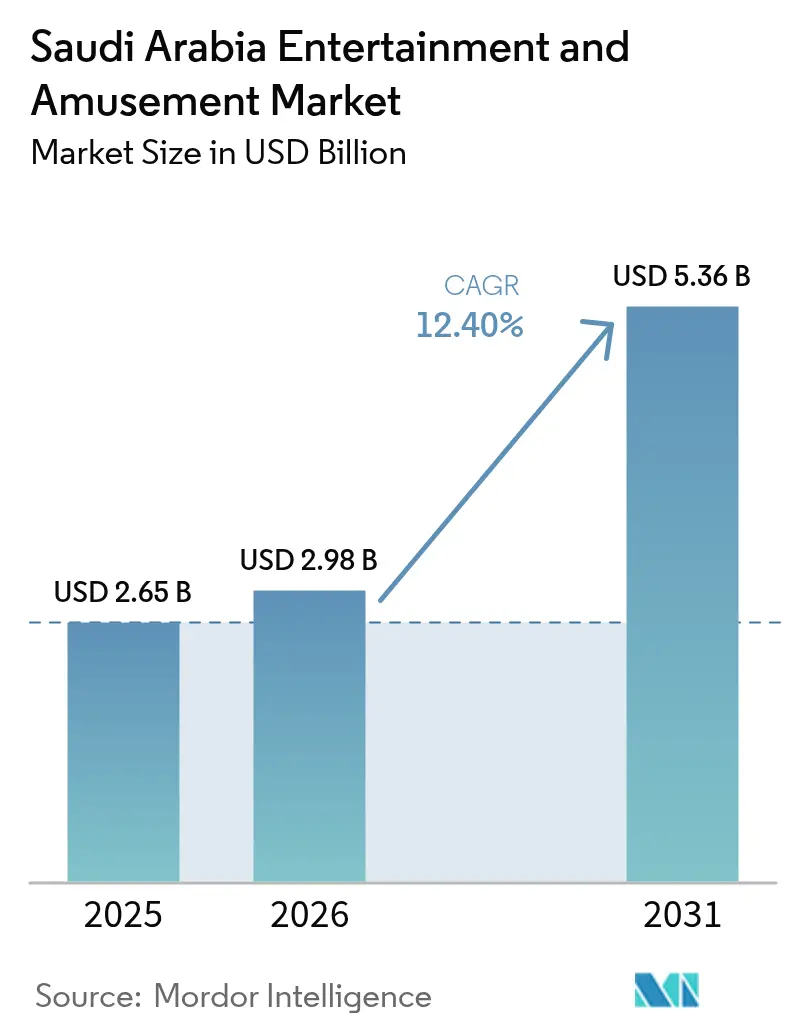
Saudi Arabia Entertainment And Amusement market size in 2026 is estimated at USD 2.98 billion, growing from 2025 value of USD 2.65 billion with 2031 projections showing USD 5.36 billion, growing at 12.4% CAGR over 2026-2031.
The acceleration reflects higher public-sector capital expenditures, a visible pivot toward leisure components inside mixed-use real-estate projects, and a steady normalization of family-oriented out-of-home leisure spending. Intensified PIF-backed funding into giga-projects, rapid rollout of mall-anchored family entertainment centers, and relaxed social norms that broaden mixed-gender visitation continue to push ticket volumes and per-capita spend upward. Domestic tourism campaigns under the “Saudi Summer” banner have lengthened the average stay of local travelers and have redirected weekend footfall toward purpose-built leisure hubs. Meanwhile, international pilgrims increasingly combine cultural excursions with heritage attractions, further lifting seasonal revenues during shoulder months. Competitive pricing by new-generation operators and bundled dining-plus-activity passes are also reshaping revenue mixes toward higher-margin premium experiences.
Key Report Takeaways
- By venue type, family entertainment centers led with 36.02% of the Saudi Arabia entertainment and amusement market share in 2025; mixed reality & VR arcades are projected to expand at a 18.5% CAGR through 2031.
- By revenue stream, ticket sales accounted for 50.10% of the Saudi Arabia entertainment and amusement market share in 2025; premium experiences are forecast to advance at a 20.1% CAGR to 2031.
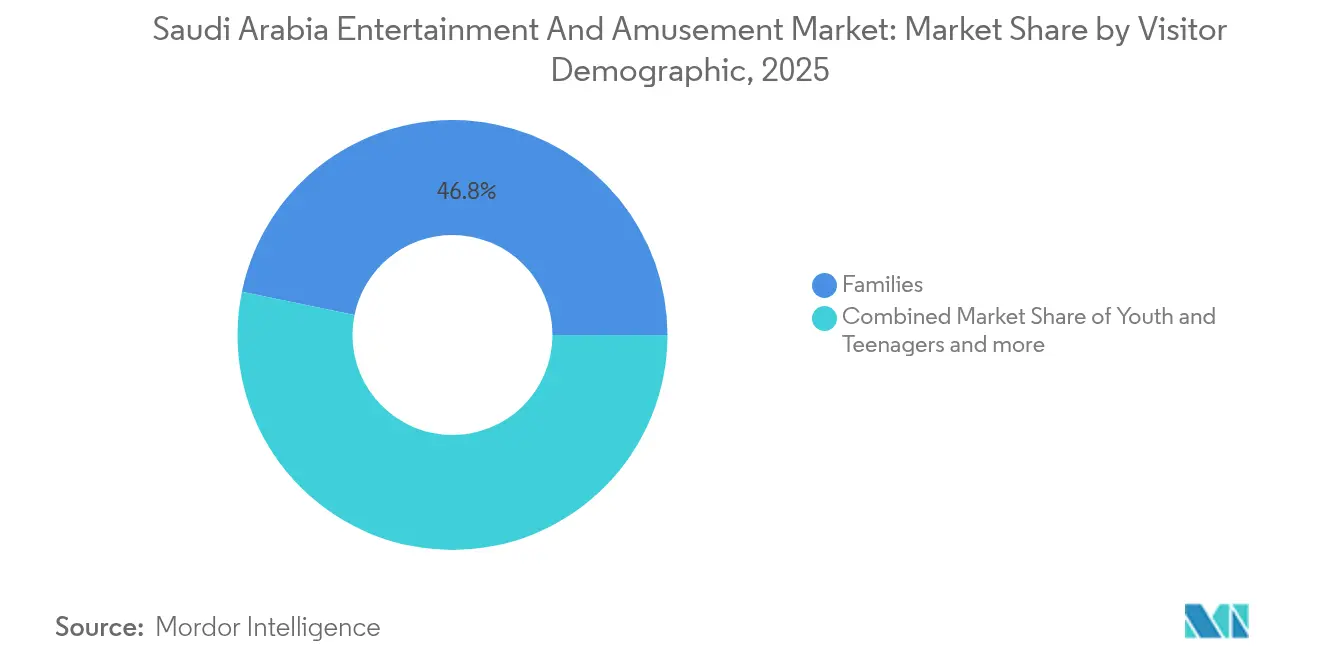
- By visitor demographic, families captured 46.78% of the Saudi Arabia entertainment and amusement market share in 2025, while youth & teenagers are on track for a 13.3% CAGR during the outlook period.
- By region, Riyadh captured 52.10% of the Saudi Arabia entertainment and amusement market share in 2025, while Eastern Province is on track for a 6.8% CAGR during the outlook period.
Note: Market size and forecast figures in this report are generated using Mordor Intelligence’s proprietary estimation framework, updated with the latest available data and insights as of 2026.
Market Trends and Insights
Drivers Impact Analysis of Saudi Arabia Entertainment And Amusement Market*
| Driver | (~) % Impact on CAGR Forecast | Geographic Relevance | Impact Timeline |
|---|---|---|---|
| Intensified Vision 2030 CAPEX | +1.4% | Kingdom-wide, highest in Riyadh & Tabuk | Long term (≥ 4 years) |
| Growing domestic tourism ("Saudi Summer") | +1.1% | All provinces, strongest in coastal Asir | Medium term (2-4 years) |
| Mall-anchored FEC roll-outs | +0.9% | Top-tier retail corridors in Riyadh, Jeddah, and Dammam | Short term (≤ 2 years) |
| Relaxed social norms (female & family visitation) | +0.8% | Kingdom-wide | Short term (≤ 2 years) |
| Gaming and esports infrastructure development | +0.7% | Kingdom-wide, concentrated in Riyadh, NEOM, and Eastern Province | Medium term (2-4 years) |
| Gamified pilgrimage packages | +0.4% | Makkah & Madinah corridors | Medium term (2-4 years) |
| Source: Mordor Intelligence | |||
Intensified Vision 2030 CAPEX
Government entities channeled more than SAR 50 billion (USD 13.33 billion) into leisure infrastructure between 2024 and 2025, anchoring 21 Saudi Entertainment Ventures (SEVEN) destinations, the Qiddiya mega-theme-park cluster, and mixed-reality zones inside NEOM. The steady funding pipeline reduces developer risk perceptions, shortens payback periods, and attracts global IP partners to license ride technologies. Higher-quality supply, in turn, elevates domestic staycation retention and curbs outbound leisure leakage. The clear policy alignment with Vision 2030 tourism metrics has also accelerated municipal permit approvals in priority corridors. As phased openings ramp up, ticketing systems integrate dynamic pricing, ultimately widening both weekday utilization and off-peak yield[1].
Growing Domestic Tourism Under “Saudi Summer” Campaigns
The Ministry of Tourism reported a 17% year-on-year rise in intra-kingdom leisure trips in the 2025 summer window, propelled by bundled packages that pair hotel vouchers with attraction passes. Partnerships with regional airlines and ride-hailing platforms have trimmed average transport costs, making weekend getaways feasible for middle-income households. Event calendars now include co-branded concerts and culinary festivals that prolong visitor dwell times. During campaign periods, retail landlords witness an 11% increase in foot traffic, underscoring the harmonious relationship between entertainment anchors and discretionary shopping. Incremental demand stabilizes cash flows for operators that historically relied on peak religious seasons[2].
Mall-Anchored FEC Roll-outs by Local Conglomerates
Retail REITs and hypermarket chains increasingly position family entertainment centers as core traffic drivers inside new-build malls. Medium-format indoor rides, redemption arcades, and kid-centric edutainment zones require lower land envelopes than full-scale theme parks, enabling faster payback. Operators such as Abdul Mohsen Al Hokair Group and Al Othaim Leisure & Tourism report double-digit revenue lifts when FECs launch adjacent to food courts. The clustering of leisure, cinema, and specialty dining promotes longer dwell times and cross-shop conversions. Importantly, the modular design allows periodic re-theming, meeting the Saudi adolescent audience’s appetite for novelty.
Relaxed Social Norms Spurring Female & Family Visitation
Regulatory reforms that have eased guardianship requirements and broadened permissible public activities for women have markedly shifted attendance patterns. Mixed-gender queuing and family-dedicated lanes now dominate weekend throughput at indoor amusement parks. Operators report a 22% rise in mother-initiated online bookings, supported by loyalty apps that reward repeat play sessions. The growth of female labor participation enlarges disposable incomes, thereby lifting per-capita spending on bundled food-and-play packages. Marketing narratives highlighting inclusive, culturally sensitive environments resonate strongly across social media channels, further normalizing leisure outings[3].
Restraints Impact Analysis of Saudi Arabia Entertainment And Amusement Market*
| Restraint | (~) % Impact on CAGR Forecast | Geographic Relevance | Impact Timeline |
|---|---|---|---|
| High seasonality (Hajj & Umrah peaks) | −0.7% | Makkah, Madinah | Short term (≤ 2 years) |
| Fragmented municipal licensing | −0.6% | Secondary cities | Medium term (2-4 years) |
| Talent shortage in themed-entertainment engineering | −0.5% | Kingdom-wide | Long term (≥ 4 years) |
| Peripheral giga-project power deficits | −0.4% | NEOM, AMAALA | Long term (≥ 4 years) |
| Source: Mordor Intelligence | |||
High Seasonality During Hajj & Umrah Peaks
Visitor traffic surges sharply during pilgrimage seasons but drops in the intensely hot midsummer weeks. While cultural attractions near mosque precincts run at near-full capacity in Dhul-Hijjah, coastal water parks in Jeddah report utilization dips below 35% occupancy in the same window. Operators have begun to stagger new-ride debuts to coincide with lull periods and to introduce discounted shoulder-season combo passes. Even so, fixed operating costs for climate-controlled venues weigh on profit margins outside peak quarters. The seasonality issue reinforces the importance of dynamic staffing and energy-management systems.
Fragmented Licensing Across Municipalities
Entertainment developers often navigate overlapping city and provincial permitting frameworks that extend ground-breaking timelines by three to six months. Inconsistent safety-code interpretations across jurisdictions add design-revision costs and delay imported ride installations. Smaller domestic investors face higher compliance spending relative to cash flow, nudging them toward franchising instead of building original concepts. Recent moves to create a unified digital approval portal are still in pilot stages, leaving interim uncertainty for planned secondary-city FECs[4].
*Our forecasts treat driver/restraint impacts as directional, not additive. The impact forecasts reflect baseline growth, mix effects, and variable interactions.
Saudi Arabia Entertainment And Amusement Market Segment Analysis
By Venue Type:
Family-oriented concepts drive volume while mixed-reality formats accelerate valueFamily entertainment centers account for 36.02% of the Saudi Arabia entertainment and amusement market size in 2025, cementing their role as the default anchor inside new-generation malls. The packaged mix of mid-intensity rides, redemption arcades, and birthday-party rooms attracts multi-age groups and delivers predictable weekday school-trip demand. Ticket bundles commonly start at SAR 89 (USD 23.7) for two-hour passes, and operators upsell branded food combos that lift basket value. Competitive space is tightening as SEVEN alone lines up 21 branded destinations across tier-one and tier-two cities, often with long-term operating guarantees that ease landlord fears over vacancy risk.
Mixed reality and VR arcades, while currently below 5% share, showcase the fastest trajectory with a projected 18.5% CAGR through 2031. High-definition headsets, motion platforms, and esports clusters resonate with a digitally native youth cohort whose average disposable gaming budget has risen 14% year on year. Content localization—such as Arabic language storylines and regionally themed zombie shooters—enables deeper engagement. Premium private-pod rentals priced at SAR 150 (USD 40) per hour further elevate yield without expanding the physical footprint. The format’s modularity suits pop-up activations inside seasonal “Boulevard” events in Riyadh, ensuring national exposure before fixed-site rollouts.


By Revenue Stream:
Ticket sales remain dominant, but premium add-ons reshape profitabilityTicket sales contributed 50.10% of Saudi Arabia entertainment and amusement market revenue in 2025, reflecting bundled admission models across most indoor venues. Dynamic pricing tools that adjust rates based on occupancy have improved weekday breakeven thresholds. Kiosks and mobile apps enable visitors to split payments across multiple cards, eliminating queue bottlenecks and increasing average transaction count per visit. In water parks, RFID wristbands streamline locker rentals and micro-transactions for food stalls, further enlarging the ticket-linked revenue bucket.
Premium experiences such as VIP queue-skipping passes, private cabanas, behind-the-scenes tours, and character dining will post a 20.1% CAGR between 2026 and 2031. Operators leverage scarcity to price VIP night parades at SAR 400 (USD 107) per head, with limited-edition merchandise bundles pushing total per-capita spend above SAR 600 (USD 160). The upsell is particularly effective in cultural attractions where heritage-focused augmented-reality overlays enrich storytelling for affluent domestic tourists. The margin differential between premium passes and base admissions exceeds 25 percentage points, driving net operating income without proportionate capital reinvestment.
By Visitor Demographic:
Families dominate footfall; youth segments underpin growthFamilies captured 46.78% of Saudi Arabia's entertainment and amusement market share in 2025, thanks to a mix of stroller-friendly layouts, prayer-room availability, and bundled dining upgrades aligned with multigenerational preferences. Multi-ticket packs that combine soft-play areas with gentle rides reduce per-guest costs and widen inclusion. Operators partner with educational agencies to integrate STEM-themed edutainment zones, reinforcing repeat visitation among school groups.
Youth and teenagers, projected to grow at a 13.3% CAGR, gravitate toward gamified experiences, esports tournaments, and social-shareable ride moments. Snackable content drop-ins—such as seasonal anime character crossovers—sustain interest and extend the marketing reach through user-generated content on TikTok and Snapchat. Loyalty schemes award in-app points redeemable for virtual items, knitting together physical attendance and online engagement.
Geography Analysis
The Saudi Arabia entertainment and amusement market demonstrates clear regional stratification in both supply density and spend profiles. Riyadh, with its cluster of newly opened Boulevard zones and high-end retail complexes, maintains the highest share at 52.10% of the Saudi Arabia entertainment and amusement market share in 2025 and records weekday average occupancy of 68% at FECs. Makkah Province aligns its attraction mix with pilgrimage cycles, drawing international visitor additions through themed heritage shows that resonate with faith-driven tourists. Eastern Province capitalizes on its coastal climate, anchoring water parks that engage youth segments seeking respite from inland heat, with a 6.8% CAGR of the Saudi Arabia entertainment and amusement market share during the outlook period.
Beyond the top three hubs, Asir and Qassim provinces experiment with indoor trampolines and boutique cultural centers that respect conservative social norms while catering to family day-trip demand. Tabuk’s NEOM corridor shifts the geographic narrative westward, promising a testbed for net-zero ride technologies and immersive holographic theater concepts. Supply pipelines in secondary cities increasingly track mall construction timelines; as new retail space comes online, developers lock in long-term leases with brand-managed leisure anchors, thereby minimizing dilution of ticket revenue per square meter.
Labor mobility within the kingdom supports staffing ramp-ups across regions, but talent concentration in Riyadh and Jeddah continues to widen unit-level productivity differentials. Energy-subsidy reforms prompt coastal operators to install solar parking canopies, shaving daytime peak power costs by up to 19%. Cross-province annual passes, valid across multiple brands, encourage repeat visitation and dilute region-specific seasonality effects. Strategic road-and-rail investments, such as the Riyadh–Jeddah high-speed rail link, promise to compress travel times and broaden the catchment areas of flagship parks.
Regulatory Landscape
Saudi Arabia’s entertainment and amusement activity is supervised primarily by the General Entertainment Authority (GEA), which licenses entertainment and supporting activities and sets compliance expectations around venue safety, operating controls, and service standards. In June 2026, the Council of Ministers approved the Entertainment Activities and Supporting Activities Regulation, formalizing a more comprehensive legal framework for licensing, oversight, and quality requirements. In July 2026, the mandate requiring GEA licenses for entertainment and supporting activities was enacted, tightening the operating perimeter for organizers, venue owners, and service providers.
Implementation is increasingly digital. The GEA Entertainment Portal acts as a centralized gateway for investors and operators, integrating workflows with other government bodies and providing a broad menu of services that can reduce administrative friction compared with municipality-by-municipality processing. Adjacent parts of the visitor journey also fall under other regulators, notably the Ministry of Tourism for hospitality facilities under the Tourism Law and Tourism Accommodation Facility Regulations, which can affect amusement operators that bundle stays, tickets, and on-site lodging in destination-led projects.
Value Chain Analysis
The value chain runs from concept development and IP licensing, through master planning and real estate development (often via PIF-backed giga-project platforms), ride and attraction design and manufacturing, fit-out and construction, and systems integration (ticketing, CRM, guest flow). It then moves into operations covering staffing, safety, F&B, and merchandising, and distribution via tourism platforms and bundled campaigns. In Saudi Arabia, large destination developers such as Qiddiya and NEOM, along with PIF-backed operators like Saudi Entertainment Ventures (SEVEN), influence procurement standards and tenant mixes by embedding entertainment within wider retail, hospitality, and transport master plans, which pulls demand through to fit-out contractors, specialist integrators, and content providers.
Time-critical logistics remain a bottleneck for imported equipment, specialized technical talent, and localized creative fabrication for themed environments. Partnerships aimed at reducing these risks are becoming more visible, including arrangements in logistics for high-urgency event and production cargo, and initiatives to localize creative production capabilities for entertainment venues. On the demand capture side, operators increasingly rely on digital guest-management and data tools that link ticketing with on-site spend across FECs, theme parks, and seasonal zones, enabling bundled pricing and premium add-ons while improving control over throughput and queue economics.
Competitive Landscape
The competitive landscape leans toward a government-backed oligopoly, with leading players like Saudi Entertainment Ventures, Qiddiya Investment Company, Abdul Mohsen Al Hokair Group, Al Othaim Leisure & Tourism, and Sela dominating market revenues in 2024. SEVEN deploys a portfolio approach that targets white-space cities, signing multi-IP licensing deals with global brands to diversify ride refresh cycles. Qiddiya positions itself as a giga-park cluster, leveraging its Phase-1 Six Flags anchor to attract hospitality co-investors. Hokair exploits its legacy network of Sparky’s branded FECs across 90 locations, banking on operational know-how to negotiate favorable rent restructurings.
Private operators such as Fakieh Leisure & Entertainment concentrate on coastal Jeddah, bundling aquarium exhibits with outdoor ride zones to balance weather risk. Majid Al Futtaim Entertainment imports proven concepts like indoor ski slopes, adapting temperature-control systems for Riyadh’s climate profile. Global chains, including Merlin Entertainments, engage through JV structures that leave local real-estate risk with Saudi partners while contributing brand IP and operational standards.
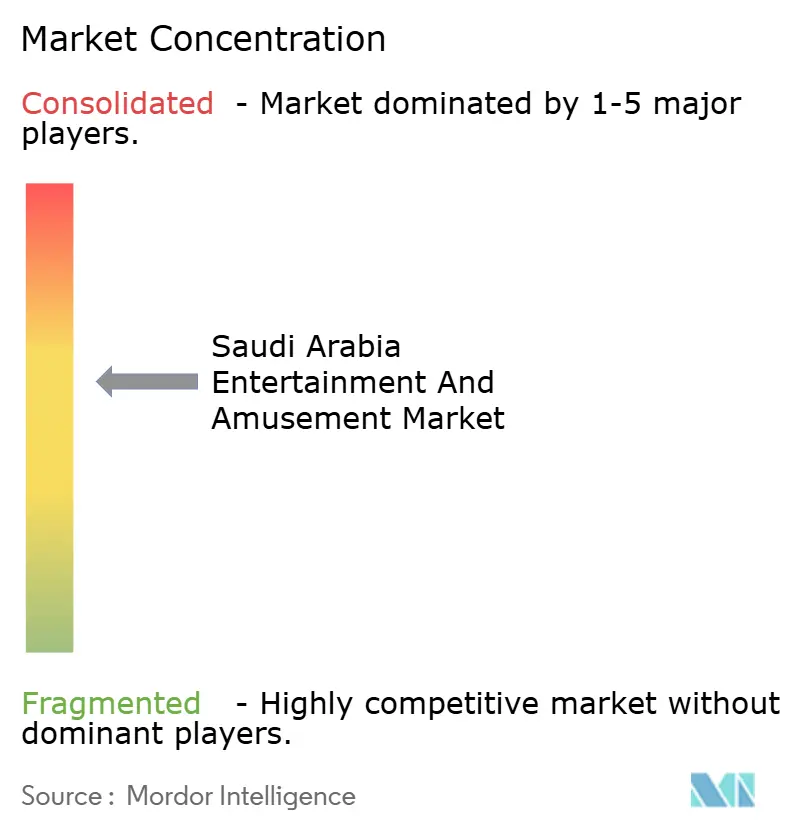
Strategic moves in 2025 revolve around vertical integration and data analytics. SEVEN’s rollout of unified CRM platforms captures cross-park behavior, enabling variable pay-per-ride monetization models. Qiddiya fast-tracked an advanced ride-testing facility to localize maintenance expertise, reducing dependence on foreign engineers. Muvi Cinemas ventured into the esports arena development, cross-advertising events through its existing movie-goer base. Sela expanded seasonal festival musically themed zones, negotiating multi-year artist residencies that enhance merchandising margins. The market’s medium concentration score of 6 reflects a clustered top tier yet leaves room for specialized niche entrants in VR and live-performance segments.
Saudi Arabia Entertainment And Amusement Industry Leaders
-
Qiddiya Investment Company
-
Abdul Mohsen Al Hokair Group
-
Al Othaim Leisure & Tourism
-
Sela
-
Saudi Entertainment Ventures (SEVEN)
- *Disclaimer: Major Players sorted in no particular order
Saudi Arabia Entertainment And Amusement Market Companies Covered in this Report
- Saudi Entertainment Ventures (SEVEN)
- Qiddiya Investment Company
- Abdul Mohsen Al Hokair Group
- Al Othaim Leisure & Tourism
- Sela
- Fakieh Leisure & Entertainment
- Tarfeeh Fakieh
- Al Hokair Funland
- Majid Al Futtaim Entertainment (KSA operations)
- Al-Tayer Group Entertainment (KSA operations)
- Vox Cinemas (KSA)
- AMC Cinemas KSA
- Muvi Cinemas
- Snow City Riyadh
- Jeddah Season Committee
- Riyadh Season Committee
- Saraya Aqaba Waterpark (KSA JV)
- Six Flags Qiddiya (future)
- Merlin Entertainments (LEGOLAND KSA)
- NEOM Entertainment & Culture division
Read Analysis of Saudi Arabia Entertainment And Amusement Companies
Market Opportunities and Future Outlook
Near-term opportunity centers on scaling repeatable indoor formats and improving operational productivity as entertainment supply broadens beyond flagship festivals and single-site anchors. Regulatory formalization in 2026, including the Council of Ministers approval of the Entertainment Activities and Supporting Activities Regulation and the GEA’s licensing mandate, creates clearer pathways for multi-site rollouts of family entertainment centers and mixed-reality formats across tier-two and tier-three cities, where fragmented municipal processing has historically delayed openings. The GEA Entertainment Portal’s integrated service model also supports faster iteration for operators that refresh content frequently, such as VR libraries, seasonal activations, and premium experience overlays, without rebuilding full assets.
Destination-led investment programs add to commercialization lanes where entertainment, hospitality, and events are planned together. PIF’s 2026-2030 strategy targeting 100,000 hotel rooms and 70 tourism experiences expands the addressable base for bundled attraction passes, evening programming, and premium experiences tied to stays, while Ministry of Tourism initiatives that frame tourism as economic infrastructure strengthen demand for standardized, exportable operating models. Technology-enabled operations are another practical opening: the Ministry of Tourism’s 2026 AI Tourism Vision and TourismX platform can support productivity upgrades for operators selling packaged experiences with hotels and tour operators, improving inventory management, pricing, and customer engagement across large parks and mall-anchored venues.
Recent Industry Developments in Saudi Arabia Entertainment And Amusement Market
- July 2026: Saudi Entertainment Ventures (SEVEN) announced the scheduled opening of its first entertainment destination in Abha on 5 August 2026, spanning about 64,000 square meters and organized into eight entertainment zones. The milestone converts SEVEN’s pipeline into operating capacity in a non-Riyadh hub, supporting geographic diversification of family-oriented out-of-home leisure demand.
- June 2026: Qiddiya Investment Company announced the National Tennis Centre at Qiddiya City, designed with 30 courts to ATP, WTA, and ITF standards, including a 15,000-capacity centre court. Adding elite sports infrastructure alongside rides and attractions broadens Qiddiya’s year-round visitation drivers and creates new event-linked revenue streams for hospitality and on-site entertainment.
- July 2024: IMAX partnered with Muvi Cinemas to add four new IMAX auditoriums across Riyadh, Jeddah, Hofuf, and Dhahran, supplementing the existing IMAX footprint in the Kingdom. The expansion strengthens premium-screen supply in key cities, supporting higher per-visit spend and reinforcing cinemas as complementary anchors within mixed-use leisure destinations.
Saudi Arabia Entertainment And Amusement Market Report Scope and Research Methodology
Market Definition and Coverage
This market is defined as the revenue generated from paid entertainment and amusement venues in Saudi Arabia, where consumers visit for leisure experiences and on-site activities. It covers admission and in-venue spending that is directly linked to these destinations.
Scope exclusions: Excludes at-home entertainment subscriptions and devices, as well as general hospitality revenue that is not tied to visitor activity inside entertainment and amusement venues.
Segments Covered in This Report
- By Venue Type
- Theme Parks
- Amusement Parks
- Family Entertainment Centers (FECs)
- Water Parks
- Cultural / Heritage Attractions
- Live Performance Venues
- Mixed Reality & VR Arcades
- By Revenue Stream
- Ticket Sales
- Food & Beverage
- Merchandise & Retail
- Sponsorship & Advertising
- Premium Experiences
- Ancillary Services (parking, rentals)
- By Visitor Demographic
- Families
- Youth & Teenagers
- Tourists (International)
- Corporate & Events
- Children (<12 yrs)
- By Geography
- Riyadh Province
- Makkah Province
- Eastern Province
- Madinah Province
- Asir Province
- Qassim Province
- Tabuk Province
- Rest of Saudi Arabia
Data Sources, Market Sizing, and Validation
Desk Research
Desk research was used to build the basic fact base for Saudi leisure demand and venue economics before modeling starts. We refer to public sources such as the General Authority for Statistics (household spending and population), Saudi Central Bank (consumer trends and inflation), Ministry of Tourism releases (visitor volumes and tourism targets), and General Entertainment Authority updates (licensing activity and event pipeline). Industry context was also taken from selected peer-reviewed tourism and leisure studies, along with venue announcements covered by reputed press.
To pressure-test the supply side, we also reviewed company filings and investor presentations where available, and we used paid subscriptions for company financials and news screening so key project milestones and openings were not missed. For larger venues, we checked import and customs indicators at a directional level to understand the timing of rides, equipment, and fit-outs. The sources listed above are illustrative only, and we also used other public documents and datasets for data collection, validation, and clarification.
Primary Interviews and Surveys
Primary discussions were run with venue operators, mall and destination managers, event organizers, and ecosystem participants such as equipment providers and service partners. We also spoke with city-level stakeholders across Riyadh, Jeddah, Makkah, Dammam, and other areas so local footfall patterns and pricing realities could be confirmed. These inputs help tighten assumptions around utilization, seasonality (including holiday peaks), and revenue mix that are hard to infer from public sources alone.
Distribution of primary research fieldwork respondents
| Company type | Respondent position |
|---|---|
| Top tier: 37% | CXOs: 15% |
| Mid tier: 43% | Functional/Unit leaders: 31% |
| Smaller Players: 20% | Managers: 54% |
Market-Sizing & Forecasting
Sizing starts with a top-down build where the addressable leisure spend pool is reconstructed from population, disposable income signals, tourism arrivals, and the expected share of out-of-home entertainment spending in major cities. Once the demand pool is set, we translate it into venue revenue using practical operating drivers, and the final market value comes after aggregation.
Key inputs used in the model include estimated annual footfalls by venue type, average ticket price ranges, in-venue spend per visitor (food, merchandise, and add-ons), venue capacity and typical utilization, and the split between local residents and tourists. Seasonality was reflected using peak periods such as school holidays and major festivals, and then we adjusted those peaks using expert feedback on how quickly new destinations ramp up.
Forecasting relies on scenario analysis supported by a light multivariate regression lens for variables with consistent history, such as population growth, tourism volumes, and inflation-adjusted pricing. Selective bottom-up approximations were used as a cross-check, including sampled venue counts by city, typical throughput per site, and price bands. Where data gaps existed, we used conservative proxying from comparable venues and then rechecked the assumptions in interviews before finalizing.
Data Validation & Update Cycle
Outputs are validated through multiple checks so the numbers stay aligned with real-world signals. Analysts compare modeled totals against independent indicators such as announced openings, observed pricing, and city-level visitor activity, then re-review any large variances with refreshed assumptions. When a number looks off, re-contact is triggered with the relevant experts to confirm whether it is a timing issue, a scope mismatch, or a shift in pricing and utilization.
A second analyst review is completed before sign-off so formula logic, units, and currency timing are consistent across years. The report is refreshed annually, and interim updates are made when material events occur, including major project delays, new licensing steps, or sudden demand shocks. Before delivery, we do a final pass so clients receive the latest updated view.
Mordor Intelligence's Saudi Arabia Entertainment and Amusement Market Sizing Compared With Other Published Estimates
Published estimates for this market can look different because each publisher chooses its own venue coverage, revenue components, and timing for what counts as a given year. Differences also show up when some studies mix consumer spending with government and developer spending, or when they treat new destination ramp-ups as immediate.
The benchmark table shows a tight cluster around the mid-USD 2 billion range, and in the Mordor Intelligence model the value reflects revenue earned at entertainment and amusement destinations, including on-site streams like food, merchandise, and advertising, rather than broader leisure categories that sit outside venue-level capture. Gaps also come from how forecasts handle ticket price progression under inflation, currency conversion timing, and whether city expansion beyond Riyadh and Jeddah is phased in gradually or assumed to be front-loaded.
Benchmark comparison
| Source | Market Size | Gaps in Research Methodology |
|---|---|---|
| Mordor Intelligence | USD 2.98 B (2026) | |
| Industry Advisory A | USD 2.60 B (2024) | Uses an earlier base year and appears to apply a broader entertainment spending view, which can understate near-term venue openings while also mixing categories that are not earned inside destinations. |
| Analytics Firm B | USD 2.08 B (2024) | Likely reflects a narrower captured revenue set and more conservative ramp-up assumptions for new parks and large destinations, which reduces the starting value versus models that include wider on-site revenue streams. |
Looking across the three figures, the spread is mainly explained by year selection and what is counted as venue revenue versus wider leisure activity. By keeping the model tied to footfalls, ticket pricing, and in-venue spend drivers that can be validated with operators, the resulting number stays traceable and repeatable for planning decisions.
Key Questions Answered in the Report
How large is the Saudi Arabia entertainment and amusement market in 2026?
The sector is valued at USD 2.98 billion in 2026, with a 12.4% CAGR outlook to 2031.
Which venue format is currently dominant?
Family entertainment centers lead, holding 36.02% of 2025 spending.
What is the fastest-growing revenue stream?
Premium experiences are projected to rise at a 20.1% CAGR between 2026 and 2031.
Which province offers the highest growth runway?
The NEOM Zone in Tabuk is set for a 15.5% CAGR through 2031.
How concentrated is the competitive landscape?
The combined share of the top five operators indicates moderate concentration.
Which demographic segment drives future ticket growth?
Youth and teenagers will post the quickest gains, advancing at a 13.3% CAGR.