
Middle East Amusement Park Market Size and Share
Market Overview
| Study Period | 2020 - 2031 |
|---|---|
| Forecast Data Period | 2026 - 2031 |
| Base Year Market Size (2025) | USD 3.35 Billion |
| Market Size (2026) | USD 3.68 Billion |
| Market Size (2031) | USD 5.84 Billion |
| Growth Rate (2026 - 2031) | 9.72 % |
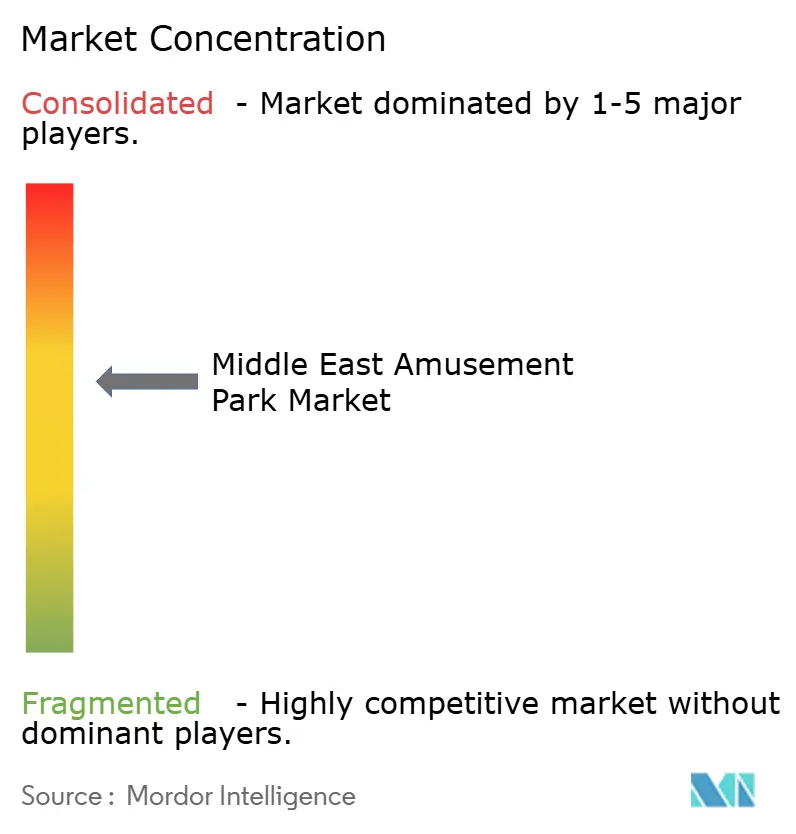
| Market Concentration | Medium |
Major Players *Disclaimer: Major Players sorted in no particular order Image © Mordor Intelligence. Reuse requires attribution under CC BY 4.0. | |
Middle East Amusement Park Market Analysis by Mordor Intelligence
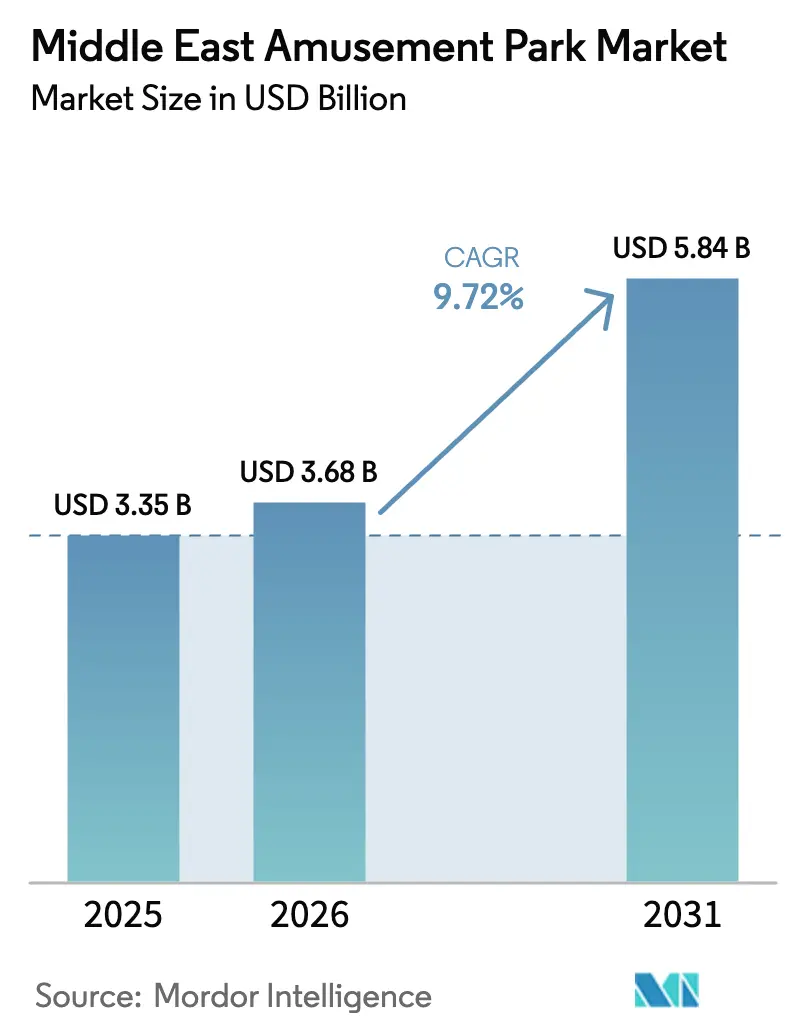
The Middle East amusement park market size is expected to grow from USD 3.35 billion in 2025 to USD 3.68 billion in 2026 and is forecast to reach USD 5.84 billion by 2031 at 9.72% CAGR over 2026-2031. Strong sovereign wealth funding, tourism-centric national visions, and a growing preference for experience-based leisure underpin this expansion. Saudi Arabia’s Vision 2030 and the UAE Tourism Strategy 2030 anchor multi-billion-dollar destination districts that raise visitor capacity and extend the length of stay. GCC governments also support the sector through streamlined permitting and infrastructure development, which reduces project risk for private operators. Operators are responding with integrated resort models that combine rides, hotels, dining, and retail to lift per-capita spending and stabilize cash flow over longer visitor stays. Technology adoption, such as AI queue optimization and contactless entry, improves guest throughput without large capital outlays, while sophisticated cooling systems mitigate climate constraints and sustain year-round operations[1].
Key Report Takeaways
- By rides, mechanical attractions led with 49.88% of Middle East amusement park market share in 2025; water rides are forecast to expand at an 11.58% CAGR through 2031.
- By age, the 19-35 year cohort accounted for 43.11% of the Middle East amusement park market size in 2025, while visitors under 18 are projected to grow at a 9.87% CAGR to 2031.
- By revenue source, tickets supplied 61.14% of total receipts in 2025, but hotels and resorts are poised to climb at a 14.95% CAGR, capturing a rising share of the Middle East amusement park market size.
- By geography, GCC countries held 76.84% revenue share of the Middle East amusement park market in 2025, and Saudi Arabia is set to post the fastest 12.74% CAGR through 2031.
Note: Market size and forecast figures in this report are generated using Mordor Intelligence’s proprietary estimation framework, updated with the latest available data and insights as of 2026.
Proportional positioning is established by comparing regional contributions against the global total, including that of Middle east. The amusement parks market share in our global report expresses these relative weights.
Market Trends and Insights
Drivers Impact Analysis of Middle East Amusement Park Market*
| Driver | (~) % Impact on CAGR Forecast | Geographic Relevance | Impact Timeline |
|---|---|---|---|
| Rapid tourism-led footfall growth in GCC | +2.8% | GCC Countries, with spillover to Turkey | Medium term (2-4 years) |
| Heavy sovereign wealth investment into integrated leisure districts | +3.2% | Saudi Arabia, UAE, Qatar | Long term (≥ 4 years) |
| Post-COVID "revenge leisure" spending surge | +1.9% | Global, with highest impact in GCC | Short term (≤ 2 years) |
| Regulatory push for family-centric entertainment to diversify oil economies | +2.1% | Saudi Arabia, UAE, Kuwait, Oman | Long term (≥ 4 years) |
| AI-driven queue & capacity optimization boosting per-capita spend | +0.8% | UAE, Saudi Arabia, Qatar | Medium term (2-4 years) |
| Indoor micro-theme-park format inside malls driving off-season traffic | +1.4% | GCC Countries, with early adoption in UAE | Medium term (2-4 years) |
| Source: Mordor Intelligence | |||
Rapid Tourism-Led Footfall Growth in GCC
Dubai welcomed 18.7 million overnight visitors in 2024, up 9.1% year on year, giving regional parks a broader catchment and greater load factor. New air routes from China and Southeast Asia raised arrivals from those regions by 24.2% in 2024, diversifying visitor origin and insulating footfall from single-market shocks. Dubai International Airport handled 92.3 million passengers in 2024, offering unrivaled access to long-haul travelers[2]. Tourism delivered AED 236 billion (USD 64.3 billion) to the UAE economy in 2024, equal to 12% of GDP, and governments continue to fund marketing to sustain this contribution. Rising visitor flows support premium pricing, longer stays, and bundled resort packages that boost yield per guest. Operators increasingly craft culturally adaptive shows and ride narratives to satisfy new visitor tastes. The outcome is a durable lift in attendance that feeds directly into top-line growth for the Middle East amusement park market.
Heavy Sovereign Wealth Investment into Integrated Leisure Districts
Saudi Arabia’s Public Investment Fund alone targets a USD 70 billion slice of global park revenue, backing mega-projects such as Qiddiya and NEOM. Individual assets like Aquarabia and Land of Legends Qatar each carry about USD 3 billion in capital, creating multi-day entertainment districts instead of standalone parks. Large-scale funding enables shared infrastructure, centralized merchandising, and cohesive branding that lift marketing efficiency. Extended investment horizons allow time for destination brand building and gradual ramp-up of international visitation. Clustering of hotels, retail, and housing around attractions accelerates breakeven by spreading risk across complementary revenue streams. These integrated models also expand the Middle East amusement park market by positioning the region as a global leisure destination rather than a series of isolated parks. The depth of sovereign wallets assures continuous project financing even through oil price cycles.
Post-COVID “Revenge Leisure” Spending Surge
Household surveys show UAE travelers spending AED 7,000 (USD 1,890) or more on high-end stays and experiences in 2025, favoring memorable activities over material goods[3]. Latent demand after lockdowns sparked a jump in per-capita outlay on fast-track passes, VIP tours, and bespoke events. Multi-generation family groups are booking premium suites and private cabanas that command higher margins than gate tickets. Operators exploit this willingness to pay through tiered admission, dynamic pricing, and bundled “stay-and-play” packages. Yet sustaining momentum depends on labor market stability for expatriates, whose discretionary spend tracks regional economic cycles. Loyalty apps, cashback offers, and flexible payment plans help retain footfall if macro conditions soften. The surge has set a new pricing benchmark that supports continued revenue expansion across the Middle East amusement park market.
Regulatory Push for Family-Centric Entertainment to Diversify Oil Economies
GCC governments grant tax perks, land concessions, and simplified licensing to fast-track entertainment projects. Saudi Arabia’s General Entertainment Authority centralizes approvals and offers event-hosting subsidies, encouraging foreign operators to enter. Liberalized visa rules, such as the UAE’s multiple-entry tourist visa, open access to frequent regional travelers. Authorities mandate inclusive content that respects cultural norms, compelling operators to design family-friendly storylines and modest dress codes. Environmental regulations require ISO 14001 compliance and district cooling hookups, shaping park layouts and technology choices. Clear and predictable frameworks shrink development risk and attract private capital. The regulatory stance, therefore, functions as a growth accelerant for the Middle East amusement park market by de-risking large projects.
Restraints Impact Analysis of Middle East Amusement Park Market*
| Restraint | (~) % Impact on CAGR Forecast | Geographic Relevance | Impact Timeline |
|---|---|---|---|
| High water-energy intensity amid regional sustainability mandates | -1.8% | GCC Countries, particularly UAE and Saudi Arabia | Medium term (2-4 years) |
| Fluctuating disposable income of expatriate population | -2.3% | UAE, Qatar, Kuwait | Short term (≤ 2 years) |
| Visa & geopolitical uncertainty dampening cross-border tourism flows (under-reported) | -1.5% | GCC-wide, especially Saudi Arabia and Bahrain | Short to Medium term (1–3 years) |
| Scarcity of skilled ride-maintenance technicians | -1.2% | UAE, Saudi Arabia, Qatar | Medium to Long term (2–5 years) |
| Source: Mordor Intelligence | |||
High Water-Energy Intensity Amid Regional Sustainability Mandates
District cooling provider Empower recorded a 10% rise in consumption from hospitality and entertainment users in 2024, reflecting the resource-heavy nature of theme parks. Governments are phasing out utility subsidies and introducing carbon pricing that will raise operating costs. Water parks rely on desalinated supply, which has double the energy footprint of conventional sources. Operators invest in variable-speed pumps, heat-reflective materials, and closed-loop filtration to cut usage, but payback can stretch beyond five years. Peak summer days pose tough trade-offs between visitor comfort and sustainability compliance. Long-term, achieving national net-zero goals may require caps on new water attractions unless they incorporate on-site solar or waste-heat recovery. Resource intensity, therefore, trims profitability and tempers growth within the Middle East amusement park market.
Fluctuating Disposable Income of Expatriate Population
Expatriates make up 88.5% of the UAE population and a significant share in Qatar and Kuwait. Oil price swings affect hiring and wages in sectors like construction and finance, feeding directly into leisure budgets. Visa reforms can also trigger sudden exits, as seen when some Gulf nations tightened residency rules in 2024. Operators counter volatility through loyalty tiers, off-peak discounts, and region-wide annual passes that spread risk across multiple parks. Marketing targets tourists to backfill any dip in resident spend, but airfare costs and geopolitical tensions can hinder quick substitution. The income instability of expatriates injects forecast uncertainty into the Middle East amusement park market, especially for operators whose attendance mix skews toward residents.
*Our forecasts treat driver/restraint impacts as directional, not additive. The impact forecasts reflect baseline growth, mix effects, and variable interactions.
Middle East Amusement Park Market Segment Analysis
By Rides:
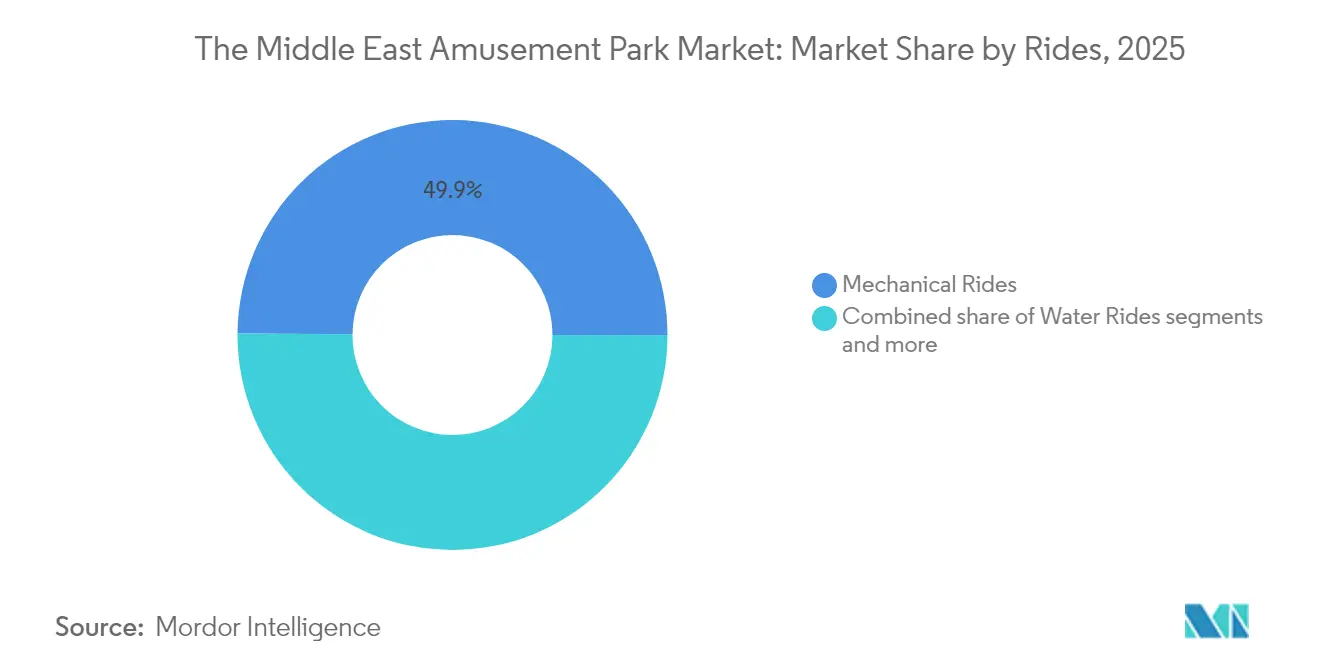
Water Attractions Drive InnovationMechanical rides claimed 49.88% of the Middle East amusement park market share in 2025, underscoring their strong cross-age appeal and established supplier networks. Water rides, however, are on track for an 11.58% CAGR to 2031, outpacing other categories as indoor wave pools and cooled slides lengthen the profitable season. Yas Waterworld’s upgrades and Aquaventure’s premium cabanas illustrate how water venues draw high-spend visitors and repeat traffic. AI queue management tools boost throughput during peak hours, pushing daily capacity higher without major expansions. Mechanical rides still enjoy lower operating costs, but face higher content refresh demands to stay relevant. Hybrid XR coasters that blend screens and motion control are emerging as a bridge between classic attractions and fully digital experiences. Water-ride growth enlarges the Middle East amusement park market size for operators that can master energy-efficient cooling and rapid ride-turnaround maintenance. Climate-controlled domes further reduce weather risk, making water concepts bankable assets in project finance models.
The “other rides” category spans VR arenas, esports lounges, and interactive dark rides, each offering modular footprints ideal for malls and cruise-line partnerships. Smaller assets need less capex and can be rethemed quickly in response to pop-culture trends, giving operators a hedge against the long design-build cycles of coasters. Revenue per square meter often exceeds that of traditional steel attractions once sponsorships and branded IP licensing are layered in. Supply chains for headsets and software updates remain a constraint, yet falling hardware costs should narrow the gap. Cross-sell bundles that attach VR tokens to gate tickets help drive trial. Successful operators position the mix as a portfolio, balancing high-volume crowd-pleasers with high-margin pay-per-play add-ons that lift overall yield in the Middle East amusement park market.

By Age:
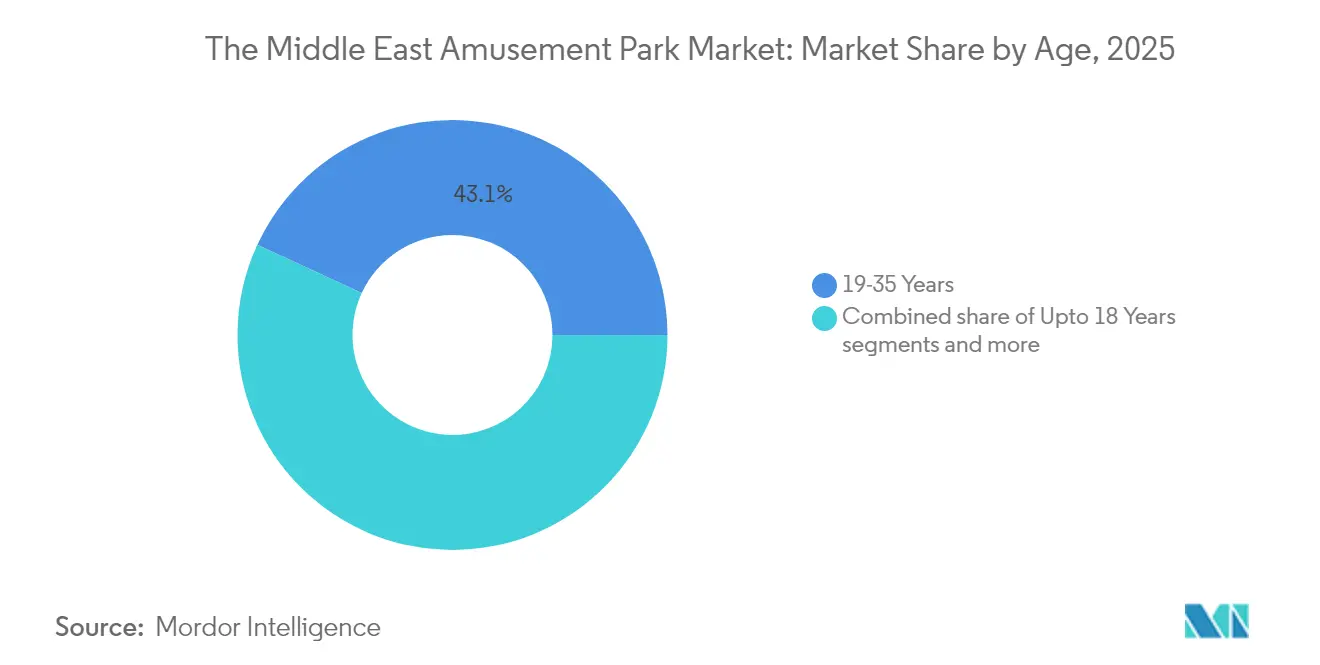
Youth Demographics Fuel GrowthVisitors aged 19-35 owned a 43.11% slice of the Middle East amusement park market size in 2025, driven by mobile-first lifestyles and strong social media influence. This group posts ride clips and reviews that extend organic reach far beyond paid advertising. Parks designs photo-ready zones and gamified loyalty apps to capture and monetize that digital engagement. Under-18 visitors will rise at a 9.87% CAGR through 2031, supported by school vacation calendars and family-friendly promotions. Educational shows and STEAM-aligned exhibits meet parental demand for “edutainment,” adding new revenue lines like curriculum-linked workshops. Ages 36-50 remain a stable base thanks to higher disposable income and willingness to upgrade to VIP access. Parents in this bracket also book adjacent hotels and restaurants, lifting ancillary sales.
Segments above 51 watch mobility and comfort options, prompting operators to invest in shaded paths, rest zones, and concierge services. Though small today, this cohort grows as healthcare advances extend active lifestyles. Accessible ride vehicles and lower-intensity experiences could unlock incremental traffic without heavy asset rebuilds. Multi-generation travel packages bundle child tickets with senior discounts, smoothing demand across age peaks. The demographic layering ensures that the Middle East amusement park market keeps a broad appeal while tailoring programs to extract optimum spend from each group.
By Revenue Source:
Integrated Experiences Drive DiversificationTicketing contributed 61.14% of receipts in 2025, yet hotels and resorts are projected to compound at 14.95% annually, making them the fastest-growing slice of the Middle East amusement park market size. Operators maximize on-site lodging to lengthen average stays and capture breakfast-through-dinner spending. Celebrity chef tie-ups and region-specific cuisine broaden food and beverage revenue to 18% of sales, pushing margins above those on entry tickets. Exclusive IP-branded merchandise delivers a 12% share and remains a high-margin pillar when stock-keeping units are refreshed alongside movie releases or seasonal events. Subscription passes, underpinned by digital IDs and facial recognition, flatten demand spikes and secure recurring revenue.
Dynamic bundling platforms tailor ticket, hotel, and dining offers on mobile apps in real time, raising upsell conversion. Operators mine behavioral data to funnel visitors toward higher-margin products and premium experiences, such as after-hours tours or backstage safaris. The migration to diversified top lines shields cash flow from weather swings and competitive discounting, anchoring long-term growth for the Middle East amusement park market.
Geography Analysis
GCC Amusement Park Market
GCC states collectively supplied 76.84% of regional revenue in 2025, with the UAE in the lead thanks to marquee brands like IMG Worlds of Adventure and Ferrari World. Saudi Arabia registers a 12.74% CAGR outlook as Vision 2030 funds mega-resorts that target domestic and religious tourism. Qatar uses FIFA World Cup infrastructure to attract regional visitors, with Land of Legends Qatar as its flagship. Kuwait, Oman, and Bahrain remain smaller but show upside because of population growth and improving land-side transport links. Each country tightens sustainability codes, making district cooling and solar roofs standard during permitting. These measures add upfront costs but reduce lifetime utility bills, favoring operators with strong balance sheets.
Turkey and Iran Amusement Park Market
Turkey stands out among non-GCC markets; its Land of Legends complex demonstrates how integrated resorts can thrive on mixed international and domestic demand. Sanctions and limited cross-border tourism hamper Iran’s Jazeera Adventure World, though local demographics provide latent potential. Improved visa facilitation across the Middle East allows multi-country tour packages that group several parks within a single itinerary, spreading visitor spend. The shared emphasis on family-oriented activities and cultural congruence eases content localization, lowering creative costs. Regional aviation hubs in Dubai and Doha shorten travel times, positioning the Middle East amusement park market as a long-weekend destination for European and Asian travelers.
GCC and Turkey Amusement Park Market
Demand patterns vary by season: Gulf markets peak during cooler months, while Turkey enjoys summer highs. Operators deploy variable pricing and targeted promotions to level occupancy. Cross-marketing among parks under common ownership further smooths traffic, nudging guests from over-crowded flagship venues to emerging sites. The geographic mosaic gives investors multiple entry points, letting them hedge against macro shocks localized to one economy.
Mordor Intelligence examines the amusement parks market across diverse other regional markets as well, including North America, Europe, and Asia.
Regulatory Landscape
Across the Middle East, amusement parks operate within tourism-led diversification agendas that combine facilitation with tighter operational compliance. In Saudi Arabia, the General Entertainment Authority (GEA) serves as a central node for licensing and project approvals for large-scale entertainment developments aligned with Vision 2030, which reduces coordination friction for multi-asset districts.
In the UAE, authorities including Civil Defense apply the Fire and Life Safety Code of Practice, shaping ride safety engineering, emergency response planning, and ongoing facility audits. Sustainability-linked requirements, including ISO 14001-oriented environmental management expectations referenced in permitting, also influence park design choices such as district cooling integration and resource monitoring, which is especially relevant for water-intensive attractions.
Value Chain Analysis
The Middle East amusement park value chain typically starts with concept development and master planning, followed by financing (often supported by sovereign-backed destination programs), IP and brand licensing, ride and system procurement, construction, commissioning, and multi-year operations. Partnerships with global intellectual property holders remain an upstream lever, with operators using brands such as Warner Bros. Discovery and SeaWorld to accelerate demand creation and differentiate new attractions.
Downstream, leading groups are increasingly vertically coordinated to capture more of the visitor wallet via hotels, food and beverage, retail, and digital engagement. Miral reflects this integrated operating model through subsidiaries spanning destination promotion (Miral Destinations), park operations (Miral Experiences), and asset and property management (Yas Asset Management), while DXB Entertainments operates Dubai Parks and Resorts within Meraas Leisure and Entertainment. Utilities and sustainability solutions sit as an enabling layer in the chain, with examples such as solar photovoltaic deployment at SeaWorld Yas Island through Emerge that tie operating economics to regional energy and water constraints.
Competitive Landscape
The Middle East amusement park market is moderately concentrated, with the top five players accounting for a significant majority of industry revenue. DXB Entertainments led the market in 2024, driven by its multi-park cluster in Dubai. Miral Asset Management closely followed, continuing to expand its footprint through strategic joint ventures like SeaWorld Abu Dhabi, which surpassed its first-year attendance expectations. Smaller operators differentiate via niche indoor centers, leveraging lower capex and 12-month climate control. Strategic focus has shifted to technology-enabled efficiency rather than headline-grabbing record-tall coasters. FacePass, for example, now covers every major Yas Island park, slashing entry time and boosting impulse purchases.
Mergers and management contracts are gathering pace as mid-tier owners seek marketing muscle and data analytics platforms. Subscription passes valid across brands entice price-sensitive residents and drive cross-selling. International IP holders view the region as a licensing hotbed, drawn by high spend per guest and supportive regulation. Meanwhile, talk of platform plays where one parent entity manages diverse attractions across several countries suggests a future lineup akin to global hotel franchisors. Consolidation could eventually edge the market toward higher concentration, but current fragmentation still leaves room for agile newcomers with fresh concepts.
White-space opportunities include desert-safari hybrids, wellness-themed adventure parks for older demographics, and esports arenas that tap youthful audiences. Operators also pilot green financing to fund solar canopies and water recycling, aligning with investor ESG mandates. Competitive advantage will hinge on balancing large-scale resort economics with nimble digital engagement, maintaining the resilience and appeal of the Middle East amusement park market.
Middle East Amusement Park Industry Leaders
-
DXB Entertainments
-
Miral Asset Management
-
IMG Worlds of Adventure
-
IMG Worlds of Adventure
-
IMG Worlds of Adventure
- *Disclaimer: Major Players sorted in no particular order
Middle East Amusement Park Market Companies Covered in this Report
- DXB Entertainments (Dubai Parks & Resorts)
- Miral Asset Management (Ferrari World, Warner Bros World, SeaWorld Abu Dhabi)
- IMG Worlds of Adventure
- Global Village Dubai
- Majid Al Futtaim (Magic Planet, VOX indoor parks)
- Qiddiya Investment Co. (Six Flags Qiddiya)
- Al Hokair Group (Sparky’s, Snowy Forest)
- Al Othaim Leisure & Tourism (FabyLand, Snow City)
- Landmark Leisure (Fun City, Fun Ville)
- Loopagoon Water Park
- Yas Waterworld
- Aquaventure Atlantis
- Motiongate Dubai
- Bollywood Parks Dubai
- Wild Wadi Waterpark
- KidZania (Dubai & Abu Dhabi)
- Kidzmondo Doha
- Al Montazah Parks (Sharjah)
- Jazeera Adventure World (Iran)
- Land of Legends (Turkey)
Market Opportunities and Future Outlook
Integrated, multi-day destination clustering continues to create whitespace for offerings that extend length of stay beyond a single park visit, especially when hotels, dining, retail, and adjacent leisure assets can be bundled into one itinerary. Saudi Arabia's Qiddiya and related water-park investments, such as Aquarabia at about USD 3 billion, strengthen the case for operators and suppliers that can deliver climate-adapted water and indoor concepts while meeting tighter resource-use expectations.
Commercialization also looks strongest around frictionless, data-led guest journeys that lift throughput and ancillary spend without proportional capex. Yas Island's FacePass rollout across its parks, along with AI-enabled routing and contactless entry models, shows how operators are standardizing digital identity, payments, and queue management to monetize peak days and reduce bottlenecks. On the content side, Miral's IP-driven expansions at Warner Bros. World on Yas Island and new destination assets under development support repeat visitation and cross-selling across attractions, lodging, and retail within the same entertainment district.
Recent Industry Developments in Middle East Amusement Park Market
- June 2026: Miral announced two new DC-themed attractions for Warner Bros. World Yas Island, Abu Dhabi, extending the park's branded content pipeline. The additions strengthen the indoor theme-park proposition that supports year-round visitation and higher in-park spend through premium and repeat-visit experiences.
- May 2026: IMPACT by Miral announced four conservation priorities for 2026 under its destination sustainability platform. The program supports compliance and brand positioning as regional permitting increasingly emphasizes sustainability performance, particularly for resource-intensive attractions.
- May 2025: The Walt Disney Company and Miral announced plans for a Disney theme park and resort on Yas Island, Abu Dhabi. The project elevates the region's competitive set for global IP-led destinations and reinforces the integrated resort model that ties theme parks to lodging, retail, and multi-day tourism demand.
Middle East Amusement Park Market Report Scope and Research Methodology
Market Definition and Coverage
For this report, we size the Middle East amusement parks market as the total revenue generated by fixed-site amusement and theme parks from tickets and in-park spending within the region.
Scope exclusions: We exclude stand-alone arcades, small indoor family entertainment centers, and temporary fairgrounds unless they operate as a full amusement park venue.
Segments Covered in This Report
- By Rides
- Mechanical Rides
- Water Rides
- Other Rides
- By Age
- Upto 18 Years
- 19-35 Years
- 36-50 Years
- 51-65 Years
- More than 65 Years
- By Revenue Source
- Tickets
- Food & Beverages
- Merchandise
- Hotels / Resorts
- Others
- By Geography
- UAE
- Saudi Arabia
- Qatar
- Kuwait
- Oman
- Rest of Middle East
Data Sources, Market Sizing, and Validation
Desk Research
Desk research was used to set country coverage, anchor visitor and tourism direction, and confirm how parks typically earn money in the region. Public sources such as national tourism ministries and statistics offices, UN tourism datasets, airport passenger statistics, and World Bank macro indicators helped us build consistent demand context by country.
We also reviewed park operator annual reports and investor presentations, press releases on new openings and expansions, and reputable media coverage for timelines and capacity cues. Where available, we checked trade association releases for leisure and attractions activity, and used patent databases to understand rides and attraction technology adoption patterns at a high level. In addition, our internal subscriptions for company financials and news intelligence helped standardize revenue references and event timelines. These desk sources are illustrative only, and many other public and paid references were used for cross-checks and clarification.
Primary Interviews and Surveys
Primary work focused on validating what drives revenue per visit and how seasonality affects volumes, since these inputs are not always visible in public datasets. We spoke with a mix of park operators, ride and service providers, and channel-adjacent experts across the Middle East to pressure-test assumptions around attendance, pricing ladders, and the split between ticketing and in-park spend.
Distribution of primary research fieldwork respondents
| Company type | Respondent position |
|---|---|
| Top tier: 35% | CXOs: 14% |
| Mid tier: 51% | Functional/Unit leaders: 38% |
| Smaller Players: 14% | Managers: 48% |
Market-Sizing & Forecasting
The sizing model starts with a top-down build that reconstructs the demand pool using tourism flows, resident population by key metro areas, and expected visit frequency for major destinations, which are then translated into visits and revenue. To keep the totals realistic, we corroborated outputs with selective bottom-up checks, such as sampled ticket price ranges by park type, observed capacity cues, and revenue reasonableness versus publicly discussed operator scale.
Key inputs used in the model include inbound visitor growth by country, domestic leisure participation signals, announced park additions and phased openings, ticket pricing structure (single day, bundles, premium access), and in-park spend indicators like food and beverage and merchandising mix. Heat-driven seasonality and school holiday timing were treated as practical modifiers because they can shift quarterly volumes even when annual demand looks stable.
For forecasting, scenario analysis was applied around opening schedules and ramp-up curves, then smoothed with simple time-series logic to avoid unrealistic step changes. Where bottom-up visibility was limited for smaller venues, gaps were handled through calibrated averages by park type and country, and then adjusted after interview feedback on utilization and spend per capita.
Data Validation & Update Cycle
Outputs were checked through triangulation across independent signals, including tourism arrivals, airport traffic trends, and publicly stated development pipelines, and then compared against implied revenue per visit ranges. Any large variance triggered a second pass on assumptions such as ramp-up timing, ticket yield, and the share of revenue coming from non-ticket sources.
Before sign-off, the model goes through multi-step analyst review, including logic checks for country roll-ups and currency conversions, and a reasonableness scan against recent news events. Reports are refreshed annually, and interim updates are made when there are material announcements such as major openings, closures, or policy shifts that can change visitation patterns. Right before delivery, we run a fresh validation pass so the published numbers reflect the latest available information.
Mordor Intelligence's Middle East Amusement Parks Market Size Versus Other Published Estimates
Published market sizes for Middle East amusement parks often differ because the included venue types and revenue lines are not consistent across studies, and because ramp-up timing for new parks is treated differently. Differences in currency conversion timing and whether tourism shocks are normalized can also move the final number.
Some published figures roll in broader out-of-home entertainment, then apply blended spend assumptions across formats. For Mordor Intelligence, only fixed-site amusement and theme parks are counted, and revenues are limited to ticketing and in-park spend, with new openings modeled using phased ramp-up checks tied to tourism and capacity signals.
Benchmark comparison
| Source | Market Size | Gaps in Research Methodology |
|---|---|---|
| Mordor Intelligence | USD 3.35 B (2025) | |
| Industry Association A | USD 3.95 B (2025) | Uses a broader attractions and location-based entertainment lens, which typically adds stand-alone indoor venues and mixed-use leisure districts, lifting the revenue base beyond park-only spend. |
| Regional Consultancy B | USD 2.90 B (2025) | Applies more conservative ramp-up and utilization assumptions for announced projects, and often relies on fewer cross-checks for per-visitor spend, which can understate mature destination parks. |
The spread in values mainly comes from whether adjacent entertainment formats are included and how quickly new parks are assumed to reach stable attendance and spend levels. By keeping the revenue scope tight and then stress-testing visits, ticket yield, and in-park spend with practical checks, the estimate stays traceable to clear inputs that can be reviewed and updated in repeatable steps.
Key Questions Answered in the Report
How large is the Middle East amusement park market today?
The Middle East amusement park market size reached USD 3.68 billion in 2026 and is projected to climb to USD 5.84 billion by 2031.
What growth rate is expected for Middle Eastern parks through 2031?
The market is forecast to expand at a 9.72% CAGR, driven by sovereign investment, tourism growth, and integrated resort strategies.
Which ride category is growing fastest in the region?
Water rides lead with an 11.58% CAGR outlook as climate-controlled indoor formats extend seasonal operations.
Which country will see the quickest rise in park revenue?
Saudi Arabia is set to post a 12.74% CAGR to 2031 on the back of Vision 2030 mega-projects like Qiddiya.
How are operators diversifying income streams?
They are adding hotels, premium dining, and subscription passes, with hotels and resorts set to grow at 14.95% CAGR.
What technologies are improving the guest experience?
AI-driven queue management and facial recognition entry, such as Yas Island’s FacePass, reduce wait times and boost in-park spending.