Orphan Drugs Market Size and Share
Market Overview
| Study Period | 2020 - 2031 |
|---|---|
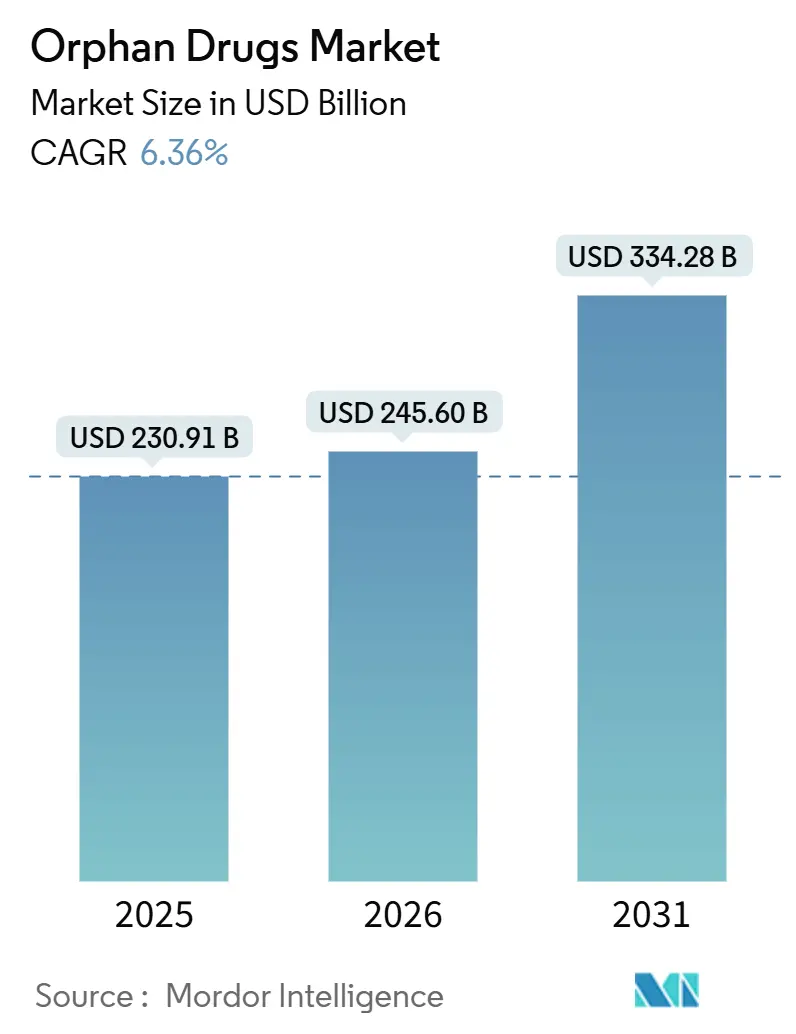
| Market Size (2026) | USD 245.60 Billion |
| Market Size (2031) | USD 334.28 Billion |
| Growth Rate (2026 - 2031) | 6.36% CAGR |
| Fastest Growing Market | Asia Pacific |
| Largest Market | North America |
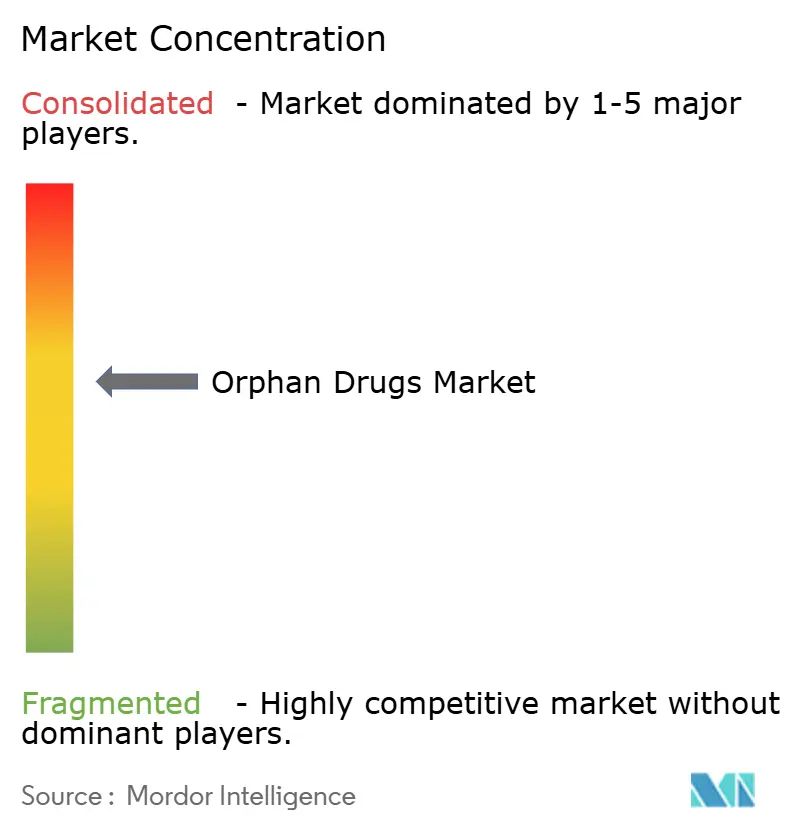
| Market Concentration | Medium |
Major Players
*Disclaimer: Major Players sorted in no particular order Image © Mordor Intelligence. Reuse requires attribution under CC BY 4.0. |
|
Orphan Drugs Market Analysis by Mordor Intelligence
The orphan drugs market size is projected to expand from USD 230.91 billion in 2025 and USD 245.60 billion in 2026 to USD 334.28 billion by 2031, registering a CAGR of 6.36% between 2026 and 2031. Accelerated approvals for gene therapies, a tightening global regulatory lag, and digital patient registries are expanding the treatment pool faster than historical prevalence growth[1]U.S. Food and Drug Administration, “Designating Orphan Products,” fda.gov. Rising biologics penetration is increasing cold-chain complexity and sustaining hospital-based distribution, yet AI-enabled adaptive trials are shortening Phase II timelines by up to 50%, lowering development risk[2]Nature Biotechnology, “AI in Drug Development,” nature.com . Asia-Pacific’s double-digit growth reflects China’s rare-disease catalog expansion and Japan’s SAKIGAKE pathway, while Europe reassesses exclusivity rules that could compress peak-revenue windows. M&A activity is clustering around platform technologies, indicating that large sponsors view multi-indication capability as the surest hedge against payer scrutiny.
Key Report Takeaways
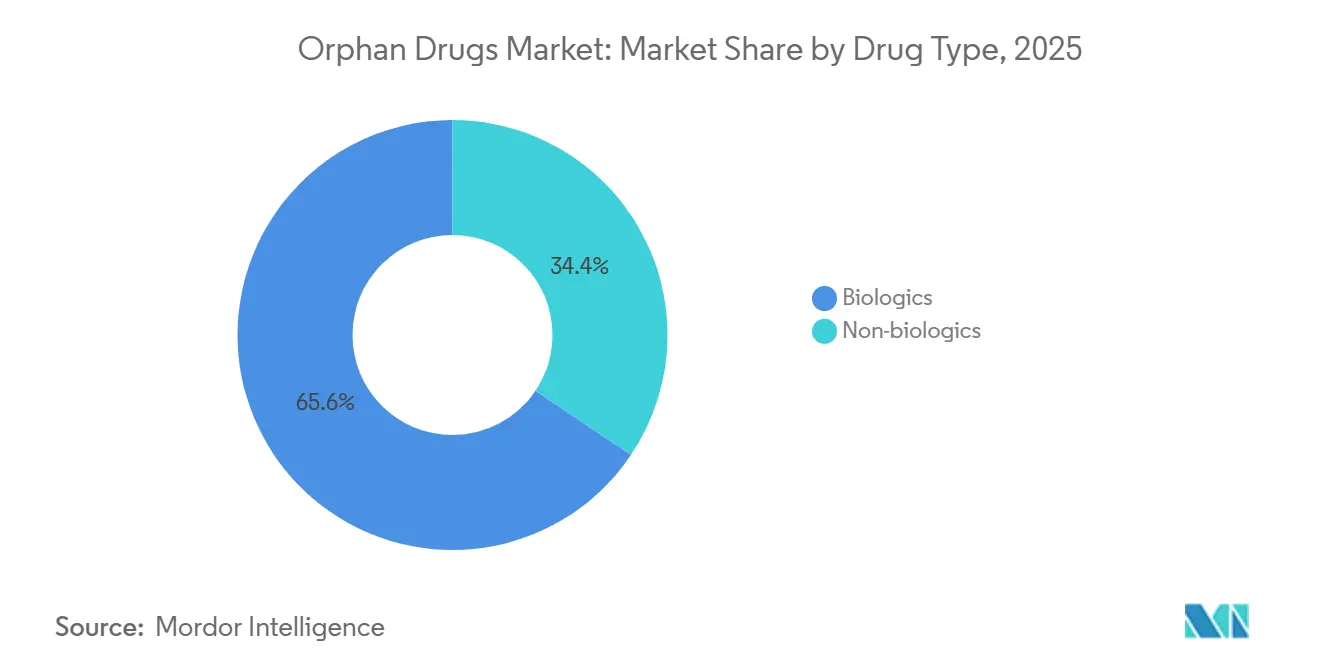
- By drug type, biologics led with a 65.55% revenue share in 2025 and are forecast to advance at a 10.85% CAGR through 2031.
- By disease area, oncologic disorders accounted for 37.53% of revenue in 2025, while neurologic disorders are poised to expand at a 12.75% CAGR to 2031.
- By route of administration, parenteral products held a 70.15% share in 2025; oral therapies are projected to grow at an 11.82% CAGR through 2031.
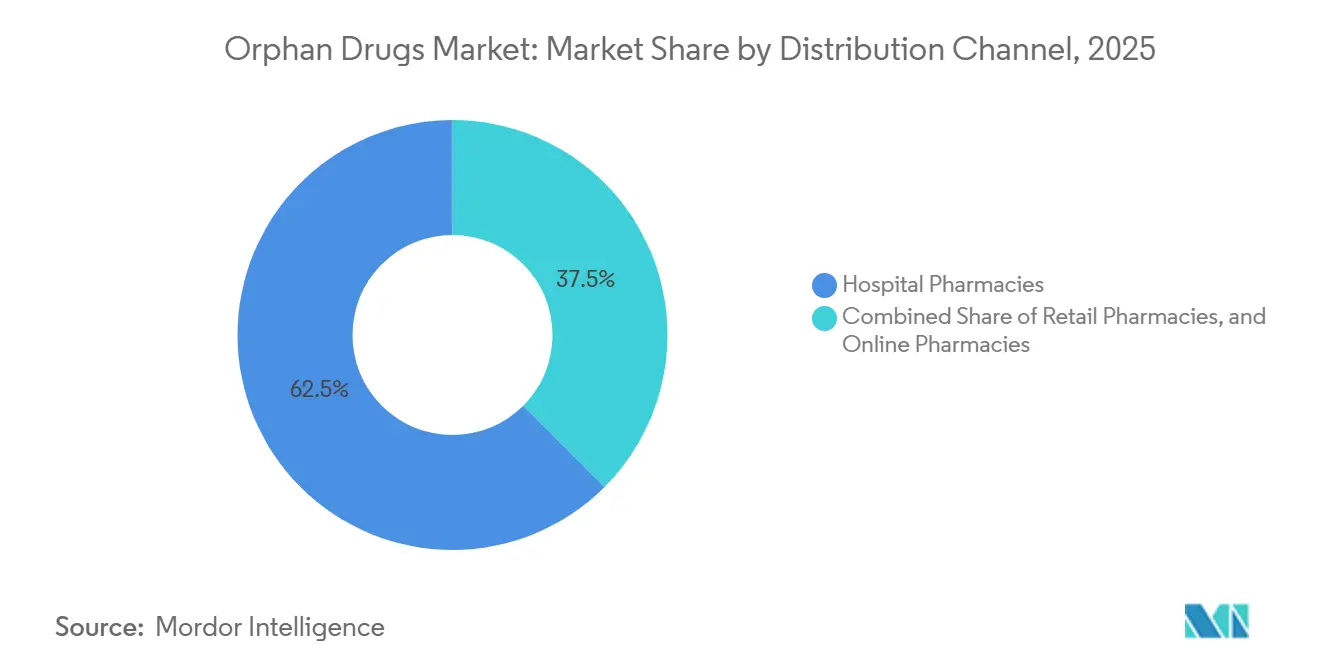
- By distribution channel, hospital pharmacies accounted for 62.52% in 2025, while online pharmacies posted the fastest growth, with a 13.12% CAGR to 2031.
- By geography, North America retained a 45.55% share in 2025, while Asia-Pacific is expected to post an 11.22% CAGR through 2031.
Note: Market size and forecast figures in this report are generated using Mordor Intelligence’s proprietary estimation framework, updated with the latest available data and insights as of January 2026.
Global Orphan Drugs Market Trends and Insights
Drivers Impact Analysis
| Driver | (~) % Impact on CAGR Forecast | Geographic Relevance | Impact Timeline |
|---|---|---|---|
| Rising Prevalence of Rare Diseases | +1.2% | Global, with early gains in North America and Europe due to expanded newborn screening | Medium term (2-4 years) |
| Favorable Government Incentives & Tax Credits | +0.9% | North America, Europe, Japan; emerging in China and Brazil | Short term (≤2 years) |
| Market Exclusivity for Orphan-Designated Drugs | +1.5% | Global, strongest in US (7-year) and EU (10-year) | Long term (≥4 years) |
| AI-Driven Adaptive Trials Shrinking Development Timelines | +1.1% | North America and Europe lead; APAC adoption accelerating | Medium term (2-4 years) |
| Repurposing Shelved Phase II Assets for Niche Indications | +0.7% | Global, with concentration in US and EU biotech hubs | Short term (≤2 years) |
| "Orphan-First" Launch Sequencing to Defer Medicare Price Negotiations | +0.8% | United States, with spillover to Canada and Australia | Medium term (2-4 years) |
| Source: Mordor Intelligence | |||
Rising Prevalence of Rare Diseases
Newborn screening now covers more than 60 conditions in 38 U.S. states, enabling diagnosis 18 months earlier on average and lifting treatment initiation across metabolic and hematologic disorders[3]Centers for Disease Control and Prevention, “Newborn Screening Programs,” cdc.gov. China added 86 conditions to its national catalog in 2024 and mandated provincial reimbursement within 12 months, effectively doubling the treated population for Gaucher and Fabry diseases. Whole-exome sequencing costs have fallen below USD 500, allowing community hospitals in India and Brazil to detect ultra-rare mutations and driving 22% annual growth in prescriptions in those regions. Global patient registries maintained by NORD and EURORDIS now include 1.2 million individuals, cutting sponsor recruitment timelines by 40% and replacing placebo arms in natural-history studies. These developments collectively add 1.2 percentage points to the forecast CAGR of the orphan drugs market.
Favorable Government Incentives and Tax Credits
The U.S. Orphan Drug Act offers a 25% clinical-testing tax credit, user-fee waivers of USD 3.2 million per filing, and seven-year exclusivity, trimming net development costs by nearly 40% compared with mainstream indications. Japan’s SAKIGAKE designation halves review time to six months and grants a 10% price premium for eligible products, leading sponsors to pursue simultaneous filings with the FDA. The European Union updated Regulation 141/2000 to extend fee reductions to combination therapies, broadening orphan eligibility by 15%[4]European Medicines Agency, “Orphan Medicines Overview,” ema.europa.eu. Brazil’s 2025 fast-track pathway now accepts FDA or EMA dossiers without local trials, cutting approval time from two years to eight months[5]Agência Nacional de Vigilância Sanitária, “Fast-Track Pathways,” anvisa.gov.br . Collectively, these incentives are projected to lift the orphan drugs market CAGR by 0.9 percentage points.
Market Exclusivity for Orphan-Designated Drugs
Seven-year exclusivity in the United States prevented generic or biosimilar entry for the top 10 orphan biologics, yielding USD 14 billion in additional 2024 revenue. The EU’s 10-year shield, extendable to 12 years with pediatric data, helped Vertex maintain a 92% share for cystic-fibrosis modulators despite patent expiries in EMA. The Inflation Reduction Act narrows the exemption to single-indication products in 2026, forcing sponsors to stage launches. Regeneron delayed a second Dupixent indication to defer Medicare price talks until 2029. China’s two-tier policy grants five-year exclusivity to domestic products and three years to imports, accelerating local joint ventures. These protections collectively add 1.5 percentage points to the forecast CAGR.
AI-Driven Adaptive Trials
One-third of FDA novel approvals in 2024 used AI for patient identification or dose optimization. Insilico Medicine deployed synthetic control arms to cut enrollment by 40% and shorten timelines by 14 months in idiopathic pulmonary fibrosis. Wearable-based digital biomarkers replaced quarterly clinic visits in 22 orphan trials, trimming per-patient costs by USD 18,000. Draft FDA guidance endorses AI-derived endpoints for diseases without prior therapies, while the EMA insists on prospective validation, creating a six-to-nine-month filing advantage in the United States EMA. These efficiencies are forecast to raise the orphan drugs market CAGR by 1.1 percentage points.
Restraints Impact Analysis
| Restraint | (~) % Impact on CAGR Forecast | Geographic Relevance | Impact Timeline |
|---|---|---|---|
| High Per-Patient Treatment Cost | -0.8% | Global, most acute in US and EU; emerging markets face access barriers | Long term (≥4 years) |
| Limited Patient Pool for Trials & Marketing | -0.5% | Global, with concentration in ultra-rare diseases (<10,000 patients) | Medium term (2-4 years) |
| Payer Scrutiny on Indication Creep & Real-World Value | -0.6% | Europe and US lead; APAC adoption emerging in Japan, Australia, South Korea | Medium term (2-4 years) |
| Legislative Proposals to Shorten Exclusivity Windows | -0.4% | EU (8-year exclusivity proposals); US (IRA orphan-exclusion narrowing) | Long term (≥4 years) |
| Source: Mordor Intelligence | |||
High Per-Patient Treatment Cost
One-time gene therapies such as Lyfgenia and Hemgenix command price tags of USD 3–4.25 million, overwhelming mid-sized hospital budgets and triggering reinsurance claims. Enzyme-replacement regimens exceed USD 500,000 annually, prompting European payers to demand biomarker-linked reimbursement within six months of launch. ICER flagged 12 orphan drugs as breaching cost-effectiveness thresholds in 2024-2025, leading to prior-authorization hurdles that delay therapy by 42 days. Brazil caps reimbursement at USD 50,000 per patient, excludes 80% of gene therapies, and forces judicial appeals that can take up to 2 years. These pressures shave 0.8 percentage points from the forecast CAGR.
Limited Patient Pool for Trials and Launch
Ultra-rare diseases with fewer than 10,000 patients require screening 15–20 individuals for each enrollee, extending Phase III timelines by up to 18 months. Alnylam’s HELIOS-B study enrolled 164 patients across 18 countries over 26 months, necessitating 12 advocacy-group partnerships. Fixed commercial overheads topping USD 40 million yearly force sponsors to set prices above USD 300,000 just to break even. Divergent regulatory standards, FDA now allows micro-trials with 20-30 patients, whereas Europe demands at least 50, which can delay EU launches by another 12-18 months. The resulting friction subtracts 0.5 percentage points from the growth rate of the orphan drugs market.
Segment Analysis
By Drug Type: Biologics Extend Lead
Biologics secured 65.55% of the orphan drugs market share in 2025 and are projected to grow at a 10.85% CAGR through 2031. The orphan drugs market size for biologics should therefore more than double over the forecast horizon as gene therapies, monoclonal antibodies, and cell-based products replace enzyme-replacement regimens. Fifteen gene therapies gained FDA approval during 2024-2025, shifting many diseases from lifelong treatment to single-dose cures. Monoclonal antibodies already account for 43% of biologic revenue, and Fc-engineered formats now achieve dosing intervals of more than 28 days, reducing infusion frequency and improving adherence to EMA.
Non-biologics growth led by small-molecule repurposing and oral formulation engineering. Vertex’s oral CFTR modulator Trikafta delivered USD 9.8 billion in 2024 sales, proving that high-volume genotypic subsegments can still support blockbuster economics in the orphan drugs market. Oral substrate-reduction therapies, such as Cerdelga, lower the annual cost of care by 30% compared with infusions. Biosimilar pressure remains limited until statutory exclusivity expires, preserving biologics’ pricing power for most of the forecast period.
By Disease Area: Oncology Dominates, Neurology Gains Momentum
Oncologic indications accounted for 37.53% of 2025 revenue, underpinned by CAR-T therapies and antibody-drug conjugates that target rare hematologic malignancies. Bispecific antibodies such as Columvi and Monjuvi expanded the addressable pool of relapsed blood cancers, driving double-digit growth in the orphan drugs market. Hematologic and immunologic products remain the second-largest group, with Casgevy and Lyfgenia reducing lifetime factor-replacement expenses by up to 50%.
Neurologic diseases posted the fastest 12.75% CAGR in approvals for Alzheimer’s antibodies Leqembi and Kisunla, plus gene therapies for Duchenne muscular dystrophy and spinal muscular atrophy, EMA. A late-stage pipeline of 18 programs targeting Huntington’s disease, ALS, and rare epilepsies is likely to accelerate revenue beyond 2030. Metabolic, infectious, and residual ultra-rare categories each advance more slowly yet still benefit from broader newborn screening and improved diagnostic technologies.
By Route of Administration: Parenteral Retains Primacy, Oral Therapies Rise
Parenteral formulations accounted for 70.15% of 2025 revenue, as gene therapies, monoclonal antibodies, and enzyme replacements require intravenous or subcutaneous delivery. Hospital monitoring for cytokine-release syndrome and strict cold-chain standards keep many of these products tied to inpatient settings, reinforcing hospital-pharmacy dominance. Long-acting injectables, exemplified by Cabenuva and Dupixent, now extend dosing intervals to as long as 8 weeks, boosting pediatric and geriatric adherence.
Oral agents grow at an 11.82% CAGR, thanks to advances in permeability enhancers and nanoparticle coatings that overcome gastric degradation. Trikafta and Cerdelga demonstrate that orally delivered products can still capture sizable segments of the orphan drugs market when genetic subpopulations exceed 30,000 patients. Inhaled and topical routes remain niche but continue to evolve for pulmonary and ophthalmic disorders.
By Distribution Channel: Hospital Pharmacies Dominate, Online Dispensing Accelerates
Hospital pharmacies held a 62.52% share in 2025 because infusion-based gene therapies and CAR-T products must be delivered within certified centers. Medicare Part B’s cost-plus structure incentivizes hospitals to keep control of high-priced biologics, while commercial insurers enforce site-of-care rules that steer complex therapies to accredited hubs.
Online specialty pharmacies are forecast to post a 13.12% CAGR, the highest of any channel, as courier partners, IoT-enabled packaging, and remote nursing coordination make home administration feasible. UnitedHealthcare and Anthem mandated home infusion for 12 biologics in 2025, saving USD 28,000 per patient annually compared with outpatient hospital settings. Europe lags due to counseling mandates, but U.S. federal preemption allows cross-state dispensing, giving online providers an 18% share against Europe’s 8%.
Note: Segment shares of all individual segments available upon report purchase
Geography Analysis
North America accounted for 45.55% of 2025 revenue, driven by the Orphan Drug Act’s 25% tax credit and 7-year exclusivity, which cut development costs by roughly 40%. Venture investment climbed to USD 12.8 billion in 2024-2025, with capital directed toward CRISPR and RNA platforms that can address multiple indications under a single IND. The orphan drugs market share in the region is expected to stay above 40% despite upcoming Medicare price negotiations, as sponsors sequence launches to maintain orphan status.
Asia-Pacific is projected to grow at an 11.22% CAGR, the fastest worldwide, because China’s median regulatory lag has dropped to 1.4 years, and Japan’s SAKIGAKE pathway clears reviews within six months. China’s reimbursement mandate for enzyme-replacement therapies doubled the treated population for lysosomal storage disorders, while Japan reimburses orphans at 110% of cost for two years post-launch, incentivizing early filing. Australia’s provisional pathway and South Korea’s outcomes-based contracts further widen regional access.
Europe maintains robust pipeline activity with 15 orphan approvals in 2024 alone, aided by 100% fee waivers for SMEs and up to 12 years of exclusivity EMA. However, HTA bodies now require comparative-effectiveness data within 18 months of launch, and legislative proposals could shorten exclusivity to eight years for drugs exceeding EUR 50 million in sales, potentially compressing the European orphan drugs market size by 15–20% of forecast revenue. South America, the Middle East, and Africa together represent a small but rising share as Brazil’s ANVISA fast-track and GCC national registries create new patient pools.

Competitive Landscape
The top seven companies, Novartis, Roche, Pfizer, AbbVie, Takeda, Sanofi, and Bristol Myers Squibb, control a majority of revenue, yet more than 180 early-stage biotechs own single-asset pipelines, keeping overall rivalry moderate. Recent transactions favor platform capabilities: AbbVie bought Cerevel for USD 8.7 billion to secure a neuroscience portfolio, while Novartis paid USD 3.5 billion for Chinook’s complement-inhibitor programs spanning multiple renal indications. Bristol Myers Squibb’s USD 4.8 billion Mirati deal and Sanofi’s USD 2.2 billion Inhibrx purchase reaffirm the shift toward multi-indication pipelines as a hedge against upcoming Medicare price talks.
Gene-editing pioneers such as Vertex and CRISPR Therapeutics delivered the first CRISPR-based therapy, Casgevy, for sickle cell disease and beta-thalassemia in 2024, opening the way for follow-on therapies for Duchenne muscular dystrophy and type 1 diabetes. Alnylam remains a leader in RNA interference, while Sarepta dominates gene therapy for neuromuscular disorders, and emerging AI-native firms like Insilico Medicine show that machine-learning platforms can rapidly expand target libraries. Payers increasingly demand outcomes-based contracts; manufacturers respond by investing in remote monitoring and digital registries that generate real-world evidence and reinforce premium pricing.
Orphan Drugs Industry Leaders
-
Novartis AG
-
F. Hoffmann-La Roche Ltd
-
AbbVie Inc.
-
Sanofi S.A.
-
Pfizer Inc.
- *Disclaimer: Major Players sorted in no particular order
Recent Industry Developments
- January 2026: The FDA granted orphan designation to Atossa Therapeutics’ (Z)-endoxifen for Duchenne muscular dystrophy.
- January 2026: Bayer and BlueRock Therapeutics received FDA orphan designation for OpCT-001 in retinitis pigmentosa.
Research Methodology Framework and Report Scope
Market Definitions and Key Coverage
Our study defines the orphan drugs market as prescription therapeutics that have received or actively seek an orphan designation to treat a single rare disease, typically one affecting fewer than 200,000 people in the United States or fewer than five in 10,000 in Europe. Value is tracked at ex-manufacturer prices for all originator biologic and small-molecule products that are either approved or in commercial launch across 17 key countries.
Scope exclusion: We exclude compounded formulations, named-patient imports, and off-label sales for non-rare indications.
Segmentation Overview
-
By Drug Type
- Biologics
- Non-biologics
-
By Disease Area
- Oncologic Diseases
- Hematologic & Immunologic Diseases
- Neurologic Diseases
- Metabolic Diseases
- Infectious Diseases
- Other Rare Diseases
-
By Route of Administration
- Parenteral
- Oral
- Inhalation
- Topical
- Implantable
-
By Distribution Channel
- Hospital Pharmacies
- Retail Pharmacies
- Online Pharmacies
-
Geography
-
North America
- United States
- Canada
- Mexico
-
Europe
- Germany
- United Kingdom
- France
- Italy
- Spain
- Rest of Europe
-
Asia-Pacific
- China
- India
- Japan
- Australia
- South Korea
- Rest of Asia-Pacific
-
Middle East and Africa
- GCC
- South Africa
- Rest of Middle East and Africa
-
South America
- Brazil
- Argentina
- Rest of South America
-
North America
Detailed Research Methodology and Data Validation
Primary Research
Mordor analysts interviewed clinical geneticists, reimbursement advisers, rare-disease foundations, and market-access managers across North America, Europe, and Asia-Pacific. The discussions clarified patient journey bottlenecks, average annual therapy cost, and real-world uptake curves, which we then triangulated with desk findings to fine-tune incidence-to-treated ratios.
Desk Research
We began with publicly available datasets such as the US FDA Orphan Drug Product database, EMA COMP opinions, the NIH GARD registry, and Orphanet prevalence tables, which supplied prevalence cut-offs and designation counts. Trade statistics from UN Comtrade, peer-reviewed articles archived on PubMed, and reports from patient advocacy groups added epidemiological context. Company 10-Ks, investor decks, and Dow Jones Factiva news feeds helped verify launch dates and revenue run-rates, while D&B Hoovers offered hard financials when filings were absent. These references illustrate, not exhaust, the secondary sources consulted.
Market-Sizing & Forecasting
A top-down prevalence-to-treated-cohort build was first executed for each disease, then corroborated through selective bottom-up revenue roll-ups from major orphan-drug suppliers. Key variables like diagnostic rate progress, clinical-trial success probability, average therapy cost evolution, regulatory designation velocity, and payor reimbursement ratios drive the model. Multivariate regression, cross-validated against historical sales and policy inflection points, underpins five-year forecasts; gaps in bottom-up data are bridged by applying region-specific uptake multipliers vetted in expert calls.
Data Validation & Update Cycle
Outputs undergo anomaly checks, peer review, and senior analyst sign-off. We refresh the model annually; interim updates are triggered by landmark approvals or pricing reforms, ensuring buyers receive an up-to-date view every time they access the report.
Why Our Orphan Drugs Baseline Earns Maximum Trust
Published estimates vary, and we acknowledge that disparity up front.
Divergences usually stem from differing drug-type inclusion, forecast cadence, or how pipeline attrition is handled.
Benchmark comparison
| Market Size | Anonymized source | Primary gap driver |
|---|---|---|
| USD 230.91 B (2025) | Mordor Intelligence | - |
| USD 216.55 B (2025) | Global Consultancy A | Counts only biologics and oncology therapies, omitting small-molecule orphan launches |
| USD 189.17 B (2024) | Industry Association B | Earlier base year and uniform 12% CAGR, with no currency-year normalization |
| USD 179.50 B (2023) | Trade Journal C | Relies on company filings without adjusting multi-indication revenues or parallel trade leakage |
These comparisons show that when scope rigor, refresh frequency, and variable transparency are aligned, as in Mordor's approach, the resulting baseline stands out as the most balanced and reproducible reference for strategic decision-making.
Key Questions Answered in the Report
What is the projected value of the orphan drugs market in 2031?
It is expected to reach USD 334.28 billion, expanding at a 6.36% CAGR between 2026 and 2031.
Why are biologics growing faster than small molecules in rare diseases?
Gene therapies, monoclonal antibodies, and cell-based platforms are displacing older small-molecule treatments and drive a 10.85% CAGR for biologics.
Which region is forecast to grow the fastest through 2031?
Asia-Pacific is forecast to post the strongest 11.62% CAGR between 2025 and 2030.
How are online pharmacies influencing distribution?
Online specialty pharmacies are growing at a 13.12% CAGR by combining cold-chain delivery with remote nursing support.
What policy shift will affect U.S. orphan-drug pricing after 2026?
The Inflation Reduction Act narrows the orphan exemption, so sponsors stagger indications to delay Medicare negotiations.
Which disease area is expected to post the highest growth rate?
Neurologic disorders, fueled by gene therapies and Alzheimer’s antibodies, are set to grow at 12.75% CAGR through 2031.


