Market Overview
| Study Period | 2019 - 2030 |
|---|---|
| Base Year For Estimation | 2024 |
| Forecast Data Period | 2025 - 2030 |
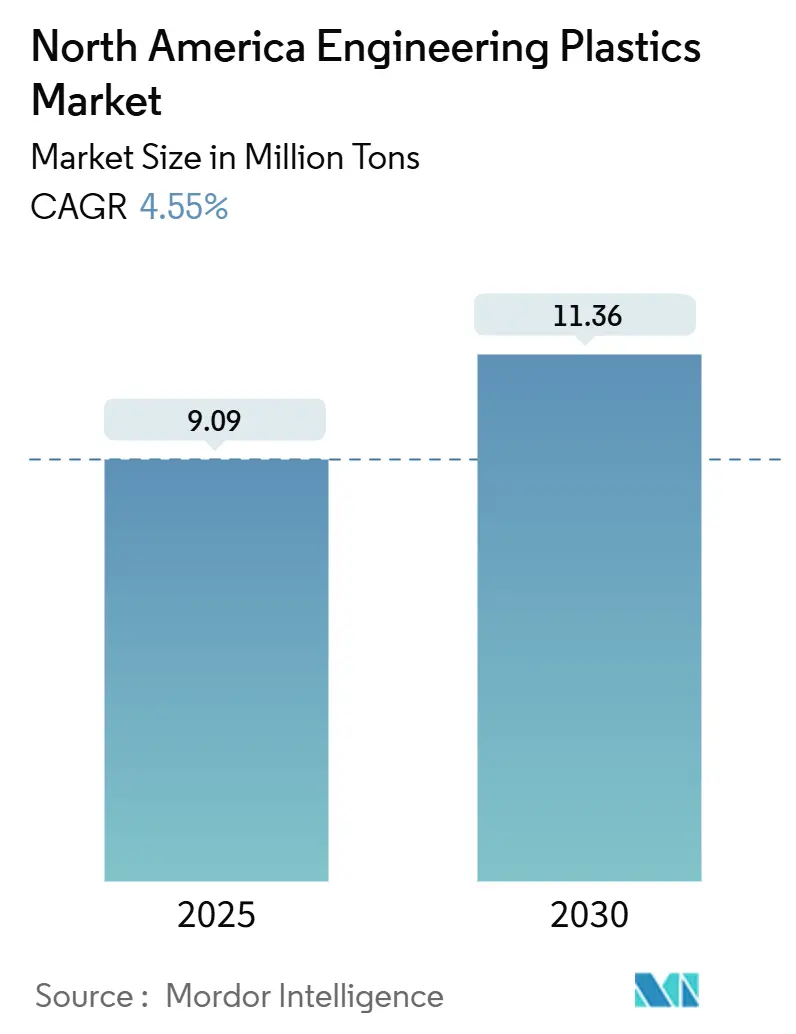
| Market Volume (2025) | 9.09 Million tons |
| Market Volume (2030) | 11.36 Million tons |
| Growth Rate (2025 - 2030) | 4.55% CAGR |
| Market Concentration | Medium |
Major Players *Disclaimer: Major Players sorted in no particular order Image © Mordor Intelligence. Reuse requires attribution under CC BY 4.0. | |
North America Engineering Plastics Market Analysis by Mordor Intelligence
The North America Engineering Plastics Market size is estimated at 9.09 million tons in 2025 and is expected to reach 11.36 million tons by 2030, at a CAGR of 4.55% during the forecast period (2025-2030). Resilient growth stems from abundant shale-gas feedstock, which keeps resin costs competitive, while automotive electrification, the rollout of 5G, and packaging sustainability mandates widen demand pools. Corporate Average Fuel Economy (CAFE) standards drive automakers toward lighter high-performance polymers, and semiconductor manufacturers specify specialty resins that tolerate 260°C reflow profiles. Nearshoring inflows into Mexico and sustained U.S. chemical capital spending have exceeded USD 200 billion since 2020, expanding local capacity for premium materials. Sustainability credentials—especially advanced recycling compatibility and bio-based content—now influence customer purchasing criteria as regulators tighten PFAS restrictions and impose Extended Producer Responsibility (EPR) fees on non-recyclable packaging.
Key Report Takeaways
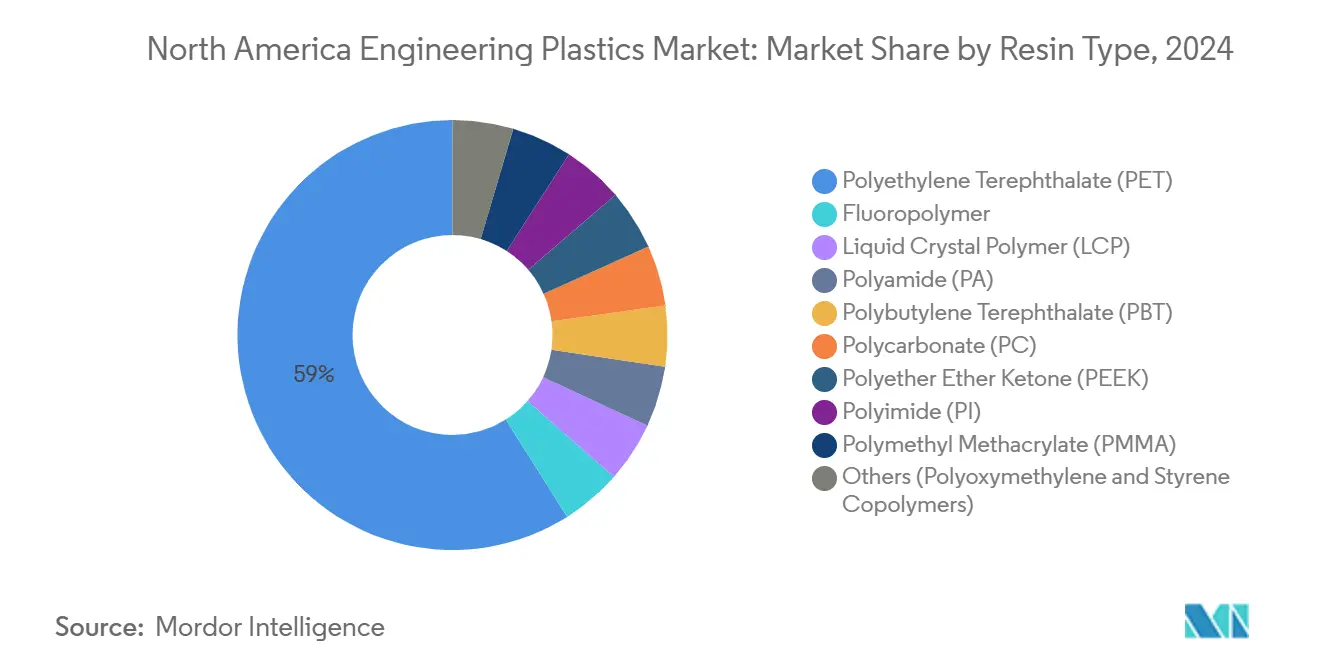
- By resin type, polyethylene terephthalate (PET) led the North America engineering plastics market with a 58.94% volume share in 2024; liquid crystal polymer (LCP) is forecast to advance at a 5.93% CAGR through 2030.
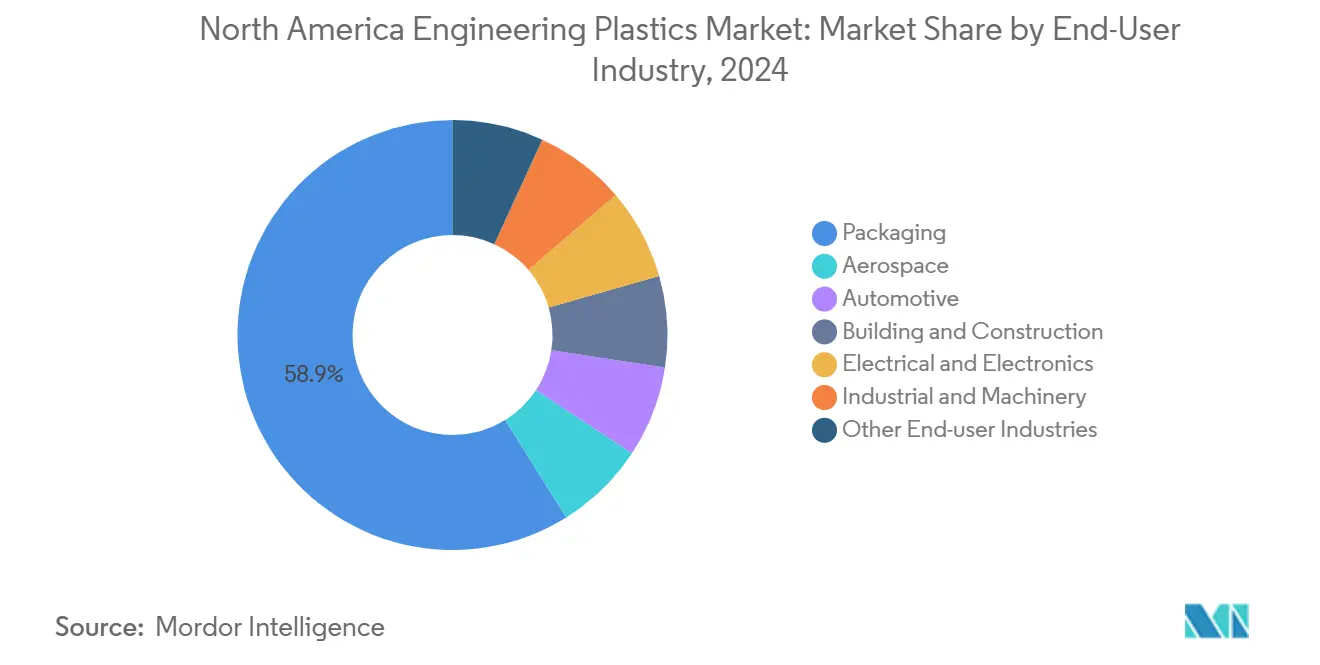
- By end-user industry, packaging captured a 58.90% share of the North America engineering plastics market size in 2024, whereas the electrical and electronics sector is projected to record the fastest CAGR of 7.30% from 2024 to 2030.
- By geography, the United States accounted for 83.88% of the North America engineering plastics market share in 2024, while Mexico is expected to expand at a 5.81% CAGR through 2030.
North America Engineering Plastics Market Trends and Insights
Drivers Impact Analysis
| Driver | (~) % Impact on CAGR Forecast | Geographic Relevance | Impact Timeline |
|---|---|---|---|
| Automotive lightweighting and CAFE standards | +0.7% | U.S. core, Canada spillover | Medium term (2-4 years) |
| Miniaturization in electrical and electronics devices | +0.5% | North America & Mexico | Short term (≤ 2 years) |
| Packaging sustainability mandates | +0.5% | U.S. & Canada | Long term (≥ 4 years) |
| Industry 4.0 and 3-D printing demand | +0.4% | U.S. manufacturing hubs | Medium term (2-4 years) |
| Shale-gas feedstock cost advantage | +0.8% | U.S. Gulf Coast, Appalachian Basin | Long term (≥ 4 years) |
| Source: Mordor Intelligence | |||
Understand The Key Trends Shaping This Market
Download PDF
Automotive Lightweighting & CAFE Standards
CAFE regulations requiring fleet averages of 40.5 mpg in 2026 compel automakers to trim curb weight by 15-20%, prompting a rapid substitution of metal with glass-fiber, carbon-fiber, and mineral-filled engineering plastics[1]National Highway Traffic Safety Administration, “Final Rule for MY 2026 CAFE,” nhtsa.gov. Ford’s 2024 F-150 Lightning features carbon-fiber-reinforced polyamide battery housings, achieving a 30% mass reduction while maintaining crash integrity. California’s Advanced Clean Cars II rules, which mandate 35% zero-emission vehicle sales by 2026, amplify polymer demand in thermal-management and structural components. Automakers also prefer plastics for design freedom that integrates brackets, clips, and fasteners directly into molded parts, reducing assembly complexity. The North America engineering plastics market consequently captures incremental value from both material substitution and component functional integration.
Miniaturization in Electrical & Electronics Devices
Advanced chip packaging migrates to system-in-package and antenna-in-package designs, elevating the need for resins with dielectric constants below 3.0 and heat-deflection temperatures above 260 °C. TSMC’s USD 2.8 billion Arizona outlay allocates capacity to LCP substrates for 5G radio frequency modules. Intel’s roadmap for heterogeneous integration demands thermally conductive polyamides to dissipate chiplet heat. Contract electronics manufacturers in Mexico leverage such specialty polymers to meet shorter design cycles and tighter dimensional tolerances, reinforcing regional demand growth. Suppliers that co-develop resin formulations with OEMs secure longer design-in lifecycles and higher switching costs.
Packaging Sustainability Mandates
Twelve US states enacted EPR laws by 2024 that levy fees up to USD 0.15 per pound on non-recyclable plastics[2]Environmental Protection Agency, “Extended Producer Responsibility Policy Brief,” epa.gov. Brand owners, such as Unilever, pledge to use 100% reusable or recyclable packaging by 2025, spurring the switch from mixed multilayer films to mono-material PET structures that are compatible with chemical recycling systems. Advanced depolymerization technologies close the loop for PET and nylon, lowering Scope 3 emissions for consumer-packaged-goods manufacturers. Resin producers that validate FDA food-contact compliance for recycled content gain an early-mover advantage with converters. The North America engineering plastics market, therefore, attaches a premium to grades that combine high barrier performance with end-of-life circularity pathways.
Industry 4.0 & 3-D Printing Demand
Additive manufacturing transitions from prototyping to certified production in aerospace, medical, and tooling verticals. Boeing has secured FAA approval for polyether ether ketone (PEEK) seat fittings printed via fused filament fabrication, achieving 85% of the tensile performance of injection-molded parts. High-temperature amorphous resins, such as Ultem polyetherimide and semi-crystalline PEEK, garner interest for their chemical resistance and compliance with flame-smoke-toxicity standards. Machine builders in the US Midwest are adopting digitally enabled workflows that print jigs and fixtures on demand, thereby shortening maintenance lead times. This paradigm prioritizes functional material demand over commodity filament, thereby reinforcing the value proposition for the North American engineering plastics market.
Restraints Impact Analysis
| Restraint | (~) % Impact on CAGR Forecast | Geographic Relevance | Impact Timeline |
|---|---|---|---|
| Petro-feedstock price volatility | -0.40% | US Gulf Coast production centers | Short term (≤ 2 years) |
| PFAS & fluoropolymer regulatory pressure | -0.50% | US & Canada regulatory alignment | Medium term (2-4 years) |
| High capex for HPP processing | -0.30% | North America manufacturing hubs | Long term (≥ 4 years) |
| Source: Mordor Intelligence | |||
Petrochemical Feedstock Volatility Pressures Margins
Brent crude oscillated between USD 70 and USD 85 per barrel in 2024, while Henry Hub gas ranged from USD 2.50 to USD 4.20 per MMBtu, pushing monomer input costs that constitute up to 70% of resin cash costs. ExxonMobil reported a USD 1.2 billion erosion in petrochemical EBITDA, attributed to feedstock swings, highlighting a tight correlation between commodity cycles and specialty resin profitability. Processors adopt formula pricing and hedging instruments, yet working-capital lockup heightens during spikes, straining smaller compounders. Volatile cash margins may deter long-cycle investments, marginally slowing the pace of North America's engineering plastics market expansion.
PFAS Regulatory Pressure Reshapes Fluoropolymer Applications
The EPA’s 2024 TSCA Section 8(a)(7) rule compels comprehensive PFAS reporting, elevating compliance costs above USD 50 million annually for leading fluoropolymer producers. DuPont has set aside USD 400 million for potential liabilities, and EU REACH proposals may restrict exports worth USD 2.3 billion after 2026. Semiconductor fabs still rely on PTFE and PFA for ultra-pure chemical containment, maintaining niche demand; however, low-duty applications are migrating toward perfluoro-free alternatives. R&D pipelines therefore pivot to partially fluorinated or non-fluorinated high-performance polymers, moderating growth for the affected portion of the North America engineering plastics market.
Segment Analysis
By Resin Type: PET Dominance Meets LCP Innovation
PET commanded 58.94% of the North America Engineering Plastics market in 2024, buoyed by abundant bottle-grade capacity easily up-converted into engineering blends. The segment benefited from closed-loop chemical recycling investments that lift post-consumer resin purity to virgin-grade performance, aligning with brand owner sustainability scorecards. In contrast, LCP grows at a 5.93% CAGR through 2030, supported by 5G antenna, flexible circuit, and aerospace harness requirements that favor its low dielectric loss and high dimensional stability. The North America engineering plastics market size for LCP remains modest, but margins exceed commodity averages due to formulation complexity and intellectual property barriers.
Regulatory scrutiny on PFAS curtails some growth in fluoropolymer applications; nevertheless, critical semiconductor wet benches and chemical processing seals continue to specify PTFE and PFA where extreme inertness is mandatory. Polyamide 6 and 66 are experiencing steady uptake in battery modules, cooling lines, and structural mounts as automakers pursue lightweighting targets, whereas high-temperature aramid fibers remain a niche material for ballistic and aerospace applications. Polycarbonate wins share in transparent glazing, EV battery casings, and light guides, as its impact resistance surpasses acrylic alternatives. Advanced compounders differentiate via synergistic blends—such as PC/ABS alloys—that combine toughness with aesthetics, widening addressable end-uses across the North America engineering plastics market.
Note: Segment shares of all individual segments available upon report purchase
Get Detailed Market Forecasts at the Most Granular Levels
Download PDF
By End-User Industry: Electronics Growth Outpaces Packaging Stability
Packaging retained a 58.90% share in 2024, underpinned by demand for beverages, foodservice, and personal care products that favor PET and clarified polypropylene structures. EPR frameworks and brand sustainability pledges are accelerating the shift to mono-material solutions, yet overall tonnage remains stable, making the segment a volume anchor for the North American engineering plastics market. Electrical and electronics are expected to expand at a 7.30% CAGR to 2030, reflecting intensified semiconductor, data center, and consumer device production in the US and Mexico. Resins with elevated comparative tracking index (CTI) and thermal conductivity capture design wins in power modules and advanced packaging.
Automotive adoption accelerates as OEMs integrate polyamide, polycarbonate, and PEEK in battery enclosures, e-drive housings, and ADAS sensor brackets to offset EV weight penalties. Building & construction specifies long-life glazing, insulation foams, and piping that withstand thermal cycling and chemical exposure, while industrial machinery demands POM gears and nylon housings for chemical pumps. Aerospace remains a premium niche where resin qualification cycles yield decades-long revenue streams and robust margins for suppliers in the North America engineering plastics market.
Note: Segment shares of all individual segments available upon report purchase
Get Detailed Market Forecasts at the Most Granular Levels
Download PDF
Geography Analysis
The United States held an 83.88% share of the North America engineering plastics market in 2024, anchored by Gulf Coast feedstock integration, mature automotive OEM clusters, and the world’s largest packaging converter base. More than USD 200 billion in announced chemical projects since 2020 have already added specialty polymer capacity, with ExxonMobil’s Baytown and Dow’s Freeport complexes operating as fully integrated hubs. State-level incentives in Texas and Louisiana subsidize rail spurs, port dredging, and workforce training, supporting bulk shipments to Midwest molders and export terminals.
Mexico is projected to post the highest 5.81% CAGR through 2030, as OEMs accelerate nearshoring to shorten supply chains and sidestep geopolitical risk. Foreign direct investment reached USD 39 billion in 2024, with Tesla’s Nuevo León gigafactory and Foxconn’s Chihuahua electronics campus creating fresh pull for specialty resins. Automotive Tier 1 suppliers import glass-fiber nylon and LCP compounds duty-free under USMCA, then ship finished modules back to US assembly plants, blending cost competitiveness with just-in-time delivery.
Canada leverages oil-sands-linked feedstock availability and an established auto parts corridor in Ontario to maintain steady demand, though overall share is capped by population size. Provincial EPR programs and carbon pricing strengthen the business case for chemical recycling ventures in Alberta, while increased investment in EV battery materials may lift engineering plastics consumption in thermal-management systems. Cross-border harmonization of safety and environmental standards minimizes regulatory friction, enabling seamless movement of compounded pellets across the entire North America engineering plastics market.
Competitive Landscape
The North America Engineering Plastics market is moderately fragmented. BASF and DuPont leverage their global R&D centers and application engineering teams to co-develop solutions with OEMs, securing multi-year supply agreements. Celanese entered into long-term contracts for carbon-neutral acetic acid feedstock, thereby enhancing the sustainability profile of its derivative thermoplastics. OEMs often require multi-year test data and ISO/UL certifications before switching suppliers, preserving incumbency advantages for established players. However, digital marketplaces and toll compounding networks lower commercialization hurdles for specialty compound start-ups that focus on additive manufacturing grades or bio-based resins.
North America Engineering Plastics Industry Leaders
SABIC
BASF
DuPont
Celanese Corporation
Covestro AG
- *Disclaimer: Major Players sorted in no particular order
Need More Details on Market Players and Competitors?
Download PDF
Recent Industry Developments
- February 2025: Arkema unveiled plans to boost its PVDF capacity by 15% at its Calvert City facility in Kentucky, United States. Backed by an investment of approximately USD 20 million, this initiative is poised to cater to the surging demand for domestically produced high-performance resins, pivotal for lithium-ion batteries, and to serve the expanding semiconductor and cable sectors.
- January 2025: Covestro AG invested significantly in its Hebron, Ohio site, pouring in a low triple-digit million Euro amount. This expansion will see the construction of multiple new production lines and infrastructure dedicated to producing customized polycarbonate compounds and blends.
North America Engineering Plastics Market Report Scope
Aerospace, Automotive, Building and Construction, Electrical and Electronics, Industrial and Machinery, Packaging are covered as segments by End User Industry. Fluoropolymer, Liquid Crystal Polymer (LCP), Polyamide (PA), Polybutylene Terephthalate (PBT), Polycarbonate (PC), Polyether Ether Ketone (PEEK), Polyethylene Terephthalate (PET), Polyimide (PI), Polymethyl Methacrylate (PMMA), Polyoxymethylene (POM), Styrene Copolymers (ABS and SAN) are covered as segments by Resin Type. Canada, Mexico, United States are covered as segments by Country.By Resin Type
| Fluoropolymer | Ethylenetetrafluoroethylene (ETFE) |
| Fluorinated Ethylene-propylene (FEP) | |
| Polytetrafluoroethylene (PTFE) | |
| Polyvinylfluoride (PVF) | |
| Polyvinylidene Fluoride (PVDF) | |
| Other Sub Resin Types | |
| Liquid Crystal Polymer (LCP) | |
| Polyamide (PA) | Aramid |
| Polyamide (PA) 6 | |
| Polyamide (PA) 66 | |
| Polyphthalamide | |
| Polybutylene Terephthalate (PBT) | |
| Polycarbonate (PC) | |
| Polyether Ether Ketone (PEEK) | |
| Polyethylene Terephthalate (PET) | |
| Polyimide (PI) | |
| Polymethyl Methacrylate (PMMA) | |
| Polyoxymethylene (POM) | |
| Styrene Copolymers (ABS, SAN) |
By End-User Industry
| Aerospace |
| Automotive |
| Building and Construction |
| Electrical and Electronics |
| Industrial and Machinery |
| Packaging |
| Other End-user Industries |
By Geography
| United States |
| Canada |
| Mexico |
| By Resin Type | Fluoropolymer | Ethylenetetrafluoroethylene (ETFE) |
| Fluorinated Ethylene-propylene (FEP) | ||
| Polytetrafluoroethylene (PTFE) | ||
| Polyvinylfluoride (PVF) | ||
| Polyvinylidene Fluoride (PVDF) | ||
| Other Sub Resin Types | ||
| Liquid Crystal Polymer (LCP) | ||
| Polyamide (PA) | Aramid | |
| Polyamide (PA) 6 | ||
| Polyamide (PA) 66 | ||
| Polyphthalamide | ||
| Polybutylene Terephthalate (PBT) | ||
| Polycarbonate (PC) | ||
| Polyether Ether Ketone (PEEK) | ||
| Polyethylene Terephthalate (PET) | ||
| Polyimide (PI) | ||
| Polymethyl Methacrylate (PMMA) | ||
| Polyoxymethylene (POM) | ||
| Styrene Copolymers (ABS, SAN) | ||
| By End-User Industry | Aerospace | |
| Automotive | ||
| Building and Construction | ||
| Electrical and Electronics | ||
| Industrial and Machinery | ||
| Packaging | ||
| Other End-user Industries | ||
| By Geography | United States | |
| Canada | ||
| Mexico | ||
Need A Different Region or Segment?
Customize Now
Market Definition
- End-user Industry - Packaging, Electrical & Electronics, Automotive, Building & Construction, and Others are the end-user industries considered under the engineering plastics market.
- Resin - Under the scope of the study, consumption of virgin resins like Fluoropolymer, Polycarbonate, Polyethylene Terephthalate, Polybutylene Terephthalate, Polyoxymethylene, Polymethyl Methacrylate, Styrene Copolymers, Liquid Crystal Polymer, Polyether Ether Ketone, Polyimide, and Polyamide in the primary forms are considered. Recycling has been provided separately under its individual chapter.
| Keyword | Definition |
|---|---|
| Acetal | This is a rigid material that has a slippery surface. It can easily withstand wear and tear in abusive work environments. This polymer is used for building applications such as gears, bearings, valve components, etc. |
| Acrylic | This synthetic resin is a derivative of acrylic acid. It forms a smooth surface and is mainly used for various indoor applications. The material can also be used for outdoor applications with a special formulation. |
| Cast film | A cast film is made by depositing a layer of plastic onto a surface then solidifying and removing the film from that surface. The plastic layer can be in molten form, in a solution, or in dispersion. |
| Colorants & Pigments | Colorants & Pigments are additives used to change the color of the plastic. They can be a powder or a resin/color premix. |
| Composite material | A composite material is a material that is produced from two or more constituent materials. These constituent materials have dissimilar chemical or physical properties and are merged to create a material with properties unlike the individual elements. |
| Degree of Polymerization (DP) | The number of monomeric units in a macromolecule, polymer, or oligomer molecule is referred to as the degree of polymerization or DP. Plastics with useful physical properties often have DPs in the thousands. |
| Dispersion | To create a suspension or solution of material in another substance, fine, agglomerated solid particles of one substance are dispersed in a liquid or another substance to form a dispersion. |
| Fiberglass | Fiberglass-reinforced plastic is a material made up of glass fibers embedded in a resin matrix. These materials have high tensile and impact strength. Handrails and platforms are two examples of lightweight structural applications that use standard fiberglass. |
| Fiber-reinforced polymer (FRP) | Fiber-reinforced polymer is a composite material made of a polymer matrix reinforced with fibers. The fibers are usually glass, carbon, aramid, or basalt. |
| Flake | This is a dry, peeled-off piece, usually with an uneven surface, and is the base of cellulosic plastics. |
| Fluoropolymers | This is a fluorocarbon-based polymer with multiple carbon-fluorine bonds. It is characterized by high resistance to solvents, acids, and bases. These materials are tough yet easy to machine. Some of the popular fluoropolymers are PTFE, ETFE, PVDF, PVF, etc. |
| Kevlar | Kevlar is the commonly referred name for aramid fiber, which was initially a Dupont brand for aramid fiber. Any group of lightweight, heat-resistant, solid, synthetic, aromatic polyamide materials that are fashioned into fibers, filaments, or sheets is called aramid fiber. They are classified into Para-aramid and Meta-aramid. |
| Laminate | A structure or surface composed of sequential layers of material bonded under pressure and heat to build up to the desired shape and width. |
| Nylon | They are synthetic fiber-forming polyamides formed into yarns and monofilaments. These fibers possess excellent tensile strength, durability, and elasticity. They have high melting points and can resist chemicals and various liquids. |
| PET preform | A preform is an intermediate product that is subsequently blown into a polyethylene terephthalate (PET) bottle or a container. |
| Plastic compounding | Compounding consists of preparing plastic formulations by mixing and/or blending polymers and additives in a molten state to achieve the desired characteristics. These blends are automatically dosed with fixed setpoints usually through feeders/hoppers. |
| Plastic pellets | Plastic pellets, also known as pre-production pellets or nurdles, are the building blocks for nearly every product made of plastic. |
| Polymerization | It is a chemical reaction of several monomer molecules to form polymer chains that form stable covalent bonds. |
| Styrene Copolymers | A copolymer is a polymer derived from more than one species of monomer, and a styrene copolymer is a chain of polymers consisting of styrene and acrylate. |
| Thermoplastics | Thermoplastics are defined as polymers that become soft material when it is heated and becomes hard when it is cooled. Thermoplastics have wide-ranging properties and can be remolded and recycled without affecting their physical properties. |
| Virgin Plastic | It is a basic form of plastic that has never been used, processed, or developed. It may be considered more valuable than recycled or already used materials. |
Need More Details on Market Definition?
Ask a Question
Research Methodology
Mordor Intelligence follows a four-step methodology in all our reports.
- Step-1: Identify Key Variables: The quantifiable key variables (industry and extraneous) pertaining to the specific product segment and country are selected from a group of relevant variables & factors based on desk research & literature review; along with primary expert inputs. These variables are further confirmed through regression modeling (wherever required).
- Step-2: Build a Market Model: In order to build a robust forecasting methodology, the variables and factors identified in Step-1 are tested against available historical market numbers. Through an iterative process, the variables required for market forecast are set and the model is built on the basis of these variables.
- Step-3: Validate and Finalize: In this important step, all market numbers, variables and analyst calls are validated through an extensive network of primary research experts from the market studied. The respondents are selected across levels and functions to generate a holistic picture of the market studied.
- Step-4: Research Outputs: Syndicated Reports, Custom Consulting Assignments, Databases & Subscription Platforms

Get More Details On Research Methodology
Download PDF


