Africa Engineering Plastics Market Size and Share
Market Overview
| Study Period | 2020 - 2031 |
|---|---|
| Forecast Data Period | 2026 - 2031 |
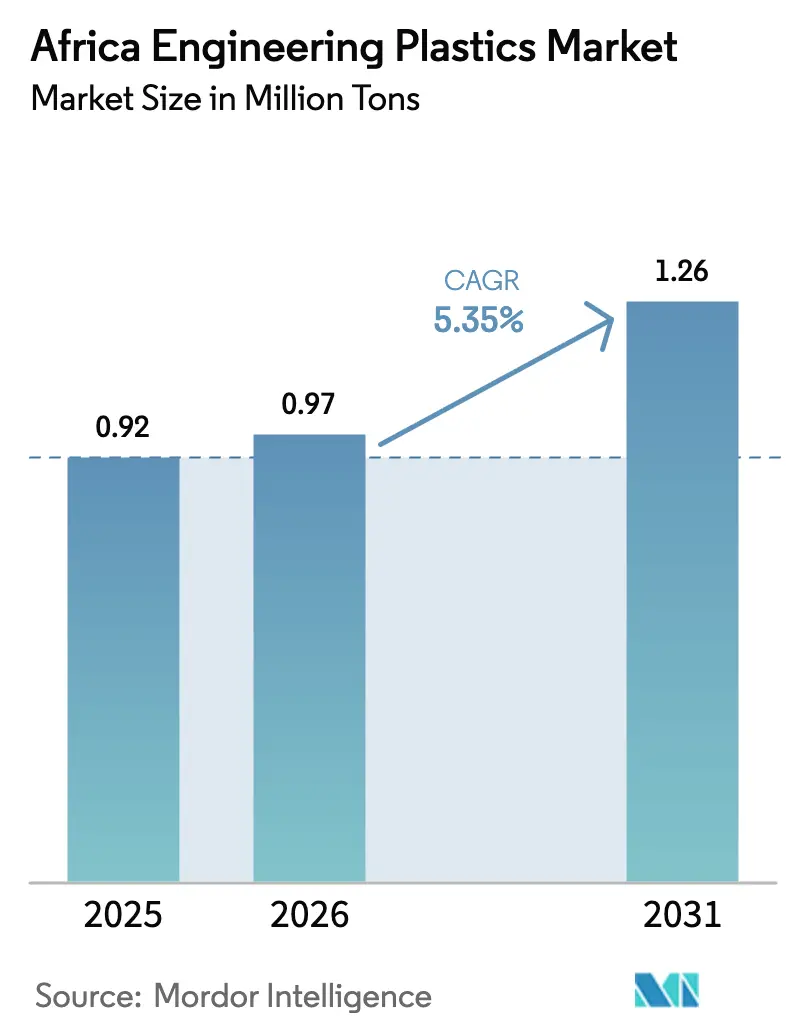
| Base Year Market Size (2025) | 0.92 Million tons |
| Market Volume (2026) | 0.97 Million tons |
| Market Volume (2031) | 1.26 Million tons |
| Growth Rate (2026 - 2031) | 5.35% CAGR |
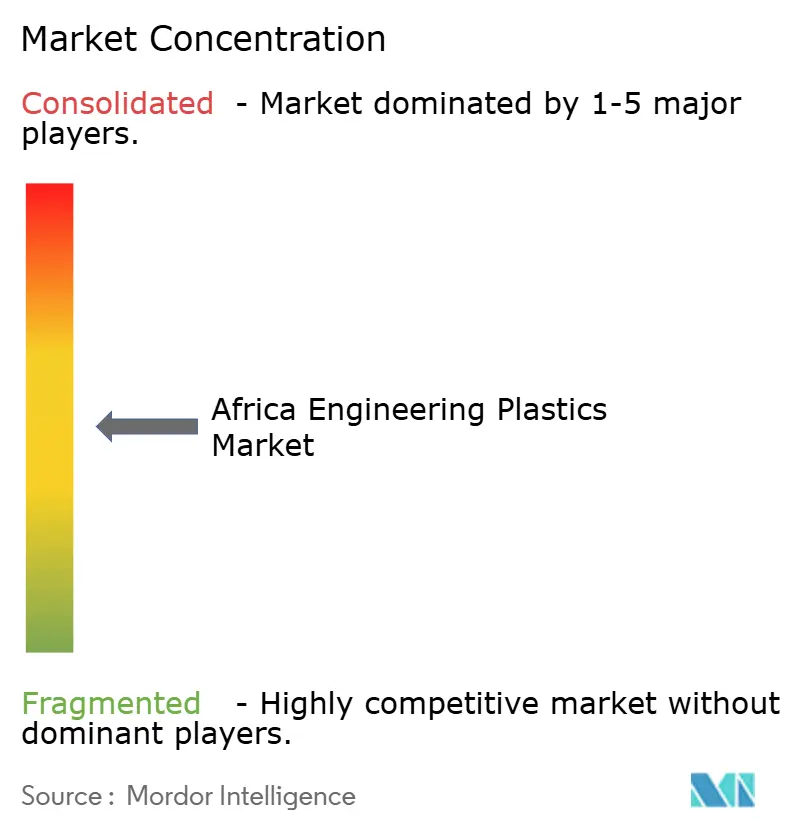
| Market Concentration | Medium |
Major Players *Disclaimer: Major Players sorted in no particular order Image © Mordor Intelligence. Reuse requires attribution under CC BY 4.0. | |
Africa Engineering Plastics Market Analysis by Mordor Intelligence
The Africa Engineering Plastics Market size is expected to grow from 0.92 million tons in 2025 to 0.97 million tons in 2026 and is forecast to reach 1.26 million tons by 2031 at 5.35% CAGR over 2026-2031. This expansion is driven by rapid industrialization, AfCFTA-led regional manufacturing, and strong packaging demand that favors polyethylene terephthalate (PET) and other high-performance resins. Investments in automotive light-weighting, electronics assembly, and polymer-focused special economic zones add further momentum, while policy incentives across Egypt, South Africa, and Morocco accelerate import substitution. Global suppliers are strengthening their African footprints to meet the rising requirements for resin quality, traceability, and circularity, whereas indigenous converters are gaining an edge through proximity to end-users and emerging recycled feedstock streams. Energy supply constraints, volatile crude-derived feedstock pricing, and technical skills shortages remain immediate hurdles but are being offset by grid upgrades, petrochemical integration projects, and public-private training programs.
Key Report Takeaways
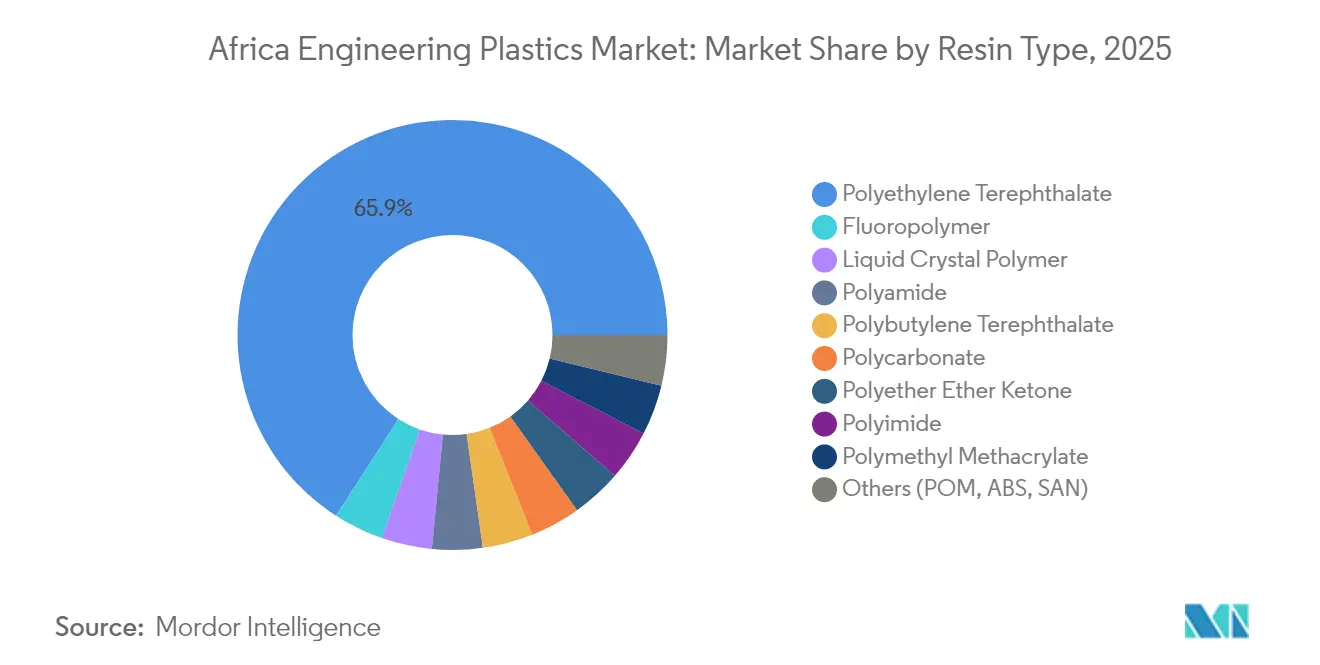
- By resin type, PET commanded 65.89% Africa engineering plastics market share in 2025. Styrene copolymers recorded the fastest-growing resin CAGR at 7.32% through 2031.
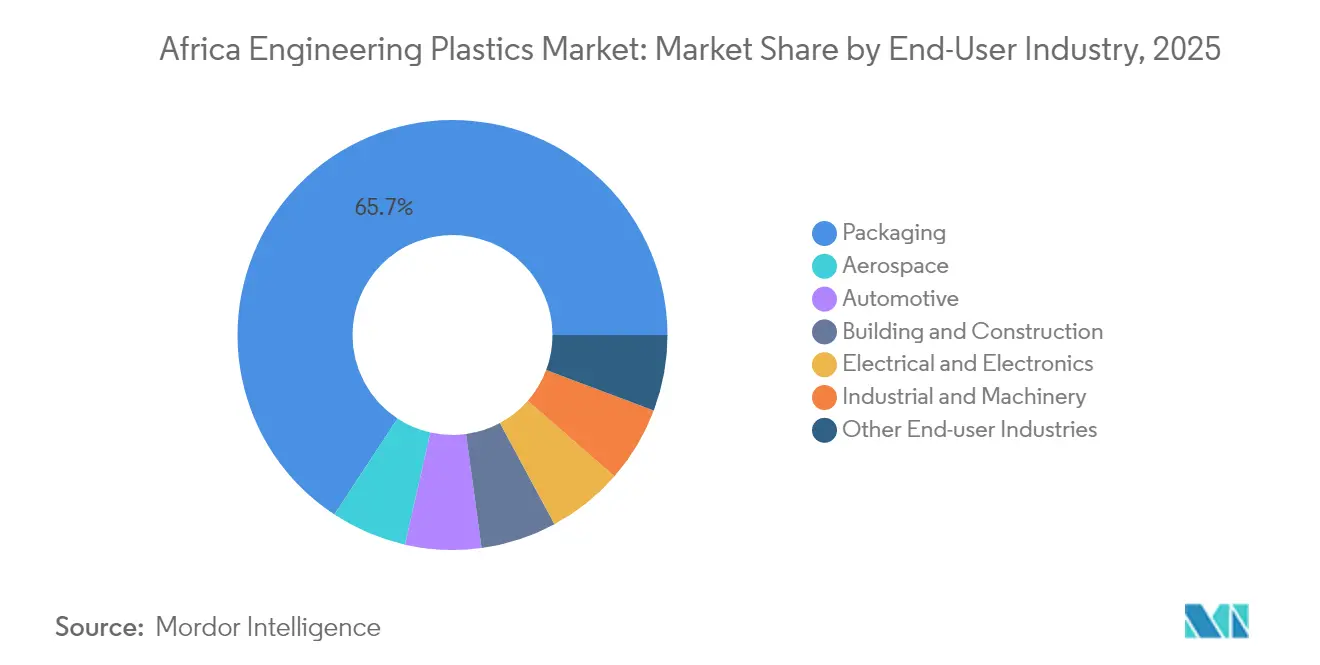
- By end-user industry, packaging held a 65.74% share of the Africa engineering plastics market size in 2025. Electrical and electronics posted the highest segment CAGR at 7.74% to 2031.
- By geography, the Rest of Africa accounted for 60.93% of the Africa engineering plastics market in 2025 and is advancing at a 5.89% CAGR through 2031.
Note: Market size and forecast figures in this report are generated using Mordor Intelligence’s proprietary estimation framework, updated with the latest available data and insights as of 2026.
Africa Engineering Plastics Market Trends and Insights
Drivers Impact Analysis*
| Driver | (~) % Impact on CAGR Forecast | Geographic Relevance | Impact Timeline |
|---|---|---|---|
| Automotive lightweighting & fuel-efficiency push | +1.20% | South Africa, Morocco, Egypt | Medium term (2-4 years) |
| Rapid expansion of FMCG packaging demand | +1.80% | Nigeria, Kenya, Ghana | Short term (≤ 2 years) |
| Growing E&E assembly clusters | +0.90% | Egypt, Kenya, Ethiopia | Medium term (2-4 years) |
| AfCFTA-led tariff-free supply chains | +0.70% | Continental; early gains in ECOWAS & EAC | Long term (≥ 4 years) |
| Polymer-focused SEZs & industrial parks | +0.50% | Egypt, Morocco, South Africa, Kenya | Long term (≥ 4 years) |
| Source: Mordor Intelligence | |||


Automotive Lightweighting & Fuel-Efficiency Push
South Africa’s vehicle program contributes 6.90% to national GDP and targets a rise in local content from 39% to 60% under the Automotive Masterplan 2035, stimulating the use of high-performance polymers in interior, exterior, and under-hood parts. Export-oriented OEMs in Morocco and Egypt meet strict EU emission standards by substituting metal with engineering plastics that reduce weight by up to 30%, thus improving fuel economy. South Africa’s 150% tax incentive for electric-vehicle production, effective March 2026, further accelerates polymer demand in battery housings and thermal-management components. Complementary EV assembly initiatives in Egypt and Kenya broaden regional requirements for flame-retardant ABS and high-temperature polyamides. Global suppliers respond by localizing technical centers that offer rapid compounding and material testing, helping converters comply with OEM specifications and UN Economic Commission for Africa safety norms.
Rapid Expansion of FMCG Packaging Demand
Africa’s population exceeded 1.46 billion in 2025, with Nigeria alone consuming nearly 60 million plastic sachets of drinking water daily, underscoring massive single-use packaging requirements. Organized retail growth and cold-chain investments in Kenya, Ghana, and Côte d’Ivoire raise demand for multilayer PET bottles and barrier-film pouches that preserve shelf life under hot climates. PET reclaimers across Nigeria and Ghana are collaborating with beverage brands to incorporate up to 25% recycled PET (rPET) in new bottles, aligning with the Extended Producer Responsibility (EPR) rules introduced in South Africa in 2024. Rising purchasing power drives premiumization—such as portion-controlled yogurt cups or medical-grade blister packs—that need precision-molded polycarbonate lids and high-clarity styrenics. Regional converters invest in two-stage stretch-blow-molding lines, inline barrier coating, and food-contact-approved colorants, expanding the Africa engineering plastics market.
AfCFTA-Led Tariff-Free Regional Supply Chains
The African Continental Free Trade Area opens tariff-free access to a USD 3.4 trillion market, incentivizing polymer processors to site compounding plants near feedstock sources yet close to end-markets. Nigeria’s Guided Trader Initiative, launched in July 2024, already logs preferential shipments of color-master-batch pellets to Kenya, cutting landed costs by 10% compared with Asian supplies. East African Community states align customs documentation via the Single Customs Territory portal, reducing border dwell times for resin trucks from six days to two. Challenges remain—namely non-tariff barriers and limited rail capacity—but corridor upgrades between Mombasa and Kampala and the Abidjan-Lagos coastal highway promise smoother resin flows over the medium term. Investors therefore model payback periods on multi-country offtake agreements rather than single-country sales, deepening the Africa engineering plastics market.
Emergence of Polymer-Focused SEZs/Industrial Parks
Egypt’s Suez Canal Economic Zone grants 50% investment-cost deductions and customs exemptions on polymer machinery imports, allowing ABS and PBT compounders to achieve two-year internal rates of return despite high power tariffs. Morocco’s Tanger Med Industrial Platform clusters aerospace and automotive tier-1 suppliers who demand just-in-time delivery of glass-fiber-reinforced PBT connectors and chemical-resistant fluoropolymer seals. Kenya’s Konza Technopolis inked a USD 1.4 million cooperation agreement with South Korean firms in 2023, supporting solar-panel junction-box production that relies on flame-retardant polycarbonate blends[1]SEforALL, “Kenya Green Manufacturing Policy and Investment Guide,” seforall.org . South Africa’s Dube TradePort offers bonded-warehouse status and fast-track customs for polymer pellets imported through Durban, enhancing cash-flow predictability for converters. These policy packages collectively enlarge the Africa engineering plastics market by lowering entry barriers and nurturing regional specialties.
Restraints Impact Analysis*
| Restraint | (~) % Impact on CAGR Forecast | Geographic Relevance | Impact Timeline |
|---|---|---|---|
| Chronic power & logistics infrastructure gaps | -1.50% | West & East Africa | Short term (≤ 2 years) |
| Volatile crude-derived feedstock pricing | -0.80% | Import-dependent economies | Short term (≤ 2 years) |
| Shortage of skilled polymer engineers | -0.60% | Emerging manufacturing hubs | Medium term (2-4 years) |
| Source: Mordor Intelligence | |||
Volatile Crude-Derived Feedstock Pricing
Engineering plastics rely on petroleum-based monomers; swings in Brent crude prices from USD 68 to USD 88 per barrel in 2024-2025 translated into 25% resin price volatility. Nigeria, despite being an oil producer, imported 63% of its polymer feedstocks, exposing converters to foreign-exchange shocks that inflated landed PE and PP prices by 18% during naira depreciation in 2024. U.S. polyethylene exports entering North Africa at multi-year lows in August 2025 disrupted regional price structures, squeezing margins for local compounders. Limited on-continent petrochemical integration restricts hedging opportunities, though the Dangote complex in Lagos and Sonatrach expansions in Algeria promise partial mitigation post-2027.
Shortage of Skilled Polymer Engineers & Technicians
Africa’s technical-vocational enrollment in polymer or materials programs trails global averages by 70%, creating chronic vacancies for extrusion line leaders, tool designers, and QC analysts. Samsung’s ZAR 138 million regional training initiative produced 100 certified technicians by 2025, yet industrial demand outstrips supply tenfold. Skills gaps foster dependence on expatriate expertise, adding up to USD 25,000 per month in project costs for mid-size molding plants. Limited access to accredited testing labs hampers material qualification cycles, delaying launches of high-spec automotive or medical components and constraining the Africa engineering plastics market.
*Our forecasts treat driver/restraint impacts as directional, not additive. The impact forecasts reflect baseline growth, mix effects, and variable interactions.
Segment Analysis
By Resin Type: PET Dominance Meets Styrenic Growth
PET retained a commanding 65.89% Africa engineering plastics market share in 2025, underpinned by the beverage sector’s preference for lightweight bottles that withstand long-haul logistics across tropical climates. Indorama Ventures and local converters integrate bottle-to-bottle recycling, enabling FMCG brands to meet EPR mandates without compromising barrier performance.
Styrene copolymers (ABS/SAN) show the quickest momentum at a 7.32% CAGR, triggered by electronics and appliance clusters in Egypt, Kenya, and South Africa. Samsung’s smartphone line alone requires roughly 300 tons of ABS housings annually, while Sharp’s refrigerator project drives SAN demand for interior liners. Continuous investments in heat-resistant grades for EV battery packs and high-gloss variants for exterior trim broaden the styrenic application window, reinforcing growth prospects in the Africa engineering plastics market.


By End-User Industry: Packaging Leadership Amid Electronics Surge
Packaging captured 65.74% Africa engineering plastics market share in 2025. Fast population growth, improved cold chains, and expanding e-commerce fuel uptake of multilayer bottles, barrier films, and rigid containers. Nigeria’s demand alone requires 486 kilotons of virgin resin annually, half allocated to beverage and food segments.
Electrical and electronics is projected to register the fastest 7.74% CAGR through 2031. Appliance and ICT assembly hubs across Egypt, Kenya, and Rwanda adopt flame-retardant polycarbonate blends, glass-fiber-reinforced PBT, and antistatic ABS grades. As OEMs localize more value-added sub-assemblies—circuit breakers, smartphone frames, HVAC compressors—the segment’s share within the Africa engineering plastics market will expand beyond 12% by 2031.
Geography Analysis
Rest of Africa dominated the landscape with 60.93% Africa engineering plastics market share in 2025 and is forecast to outpace other regions at a 5.89% CAGR. Nigeria spearheads volume growth following the inauguration of a 900,000-tpa polypropylene plant that reduces import dependence and supplies West Africa with high-density PP and homo-polymer grades. Ghana’s automotive-assembly incentives and Ethiopia’s textiles expansion further diversify demand for PET, ABS, and polyamides.
South Africa remains a mature yet pivotal hub, capitalizing on its 6.9% automotive GDP contribution and robust plastics converting capacity. The country’s EPR regime, reinforced in April 2025, obliges packagers to finance recycling schemes, spurring design-for-recyclability initiatives that favor monomaterial PET and HDPE solutions. Infrastructure such as the Dube TradePort and Coega SEZ supports resin imports, compounding, and component exports to SADC neighbors.
North Africa, led by Egypt and Morocco, benefits from proximity to EU markets and well-developed port and rail networks. Egypt’s Suez Canal Economic Zone hosts compounding investments aimed at appliance, automotive, and photovoltaic sectors, while Morocco’s Tanger Med Industrial Platform supplies ABS mirror housings and polyamide air-intake manifolds to European OEMs. Ongoing power-grid upgrades and regional trade facilitation under AfCFTA strengthen cross-border resin flows and end-product shipments, reinforcing the Africa engineering plastics market.
Competitive Landscape
The Africa engineering plastics market exhibits moderate fragmented concentration. SABIC markets 47 CYCOLAC ABS grades through Middle East–Africa distribution channels, offering design support for automotive and E&E applications[2]SABIC, “CYCOLAC Resin,” sabic.com . BASF leverages nearly 60 years in Southern Africa to supply polyamide, PBT, and polyoxymethylene to converters while operating customer innovation centers. Indorama Ventures combines local PET production in Port Harcourt with global recycling expertise, positioning itself for the growing rPET segment.
Regional firms such as Mohinani Group partner with Norfund to build 15,000-tpa rPET plants in Ghana and Nigeria, enhancing supply resilience for beverage clients. Alpla doubled down on circularity by opening its first African mechanical recycling unit in South Africa and pledging 700,000 tpa global recycling capacity by 2030. Technology differentiation—multi-component injection, long-glass-fiber compounding, and closed-loop traceability—emerges as the key competitive lever, especially where infrastructure and skills gaps can impair product consistency.
Value-chain partnerships between resin producers, converters, and FMCG or automotive brands increasingly drive innovation pipelines. Examples include lightweight PP/TPV dashboards co-developed for South African EV prototypes and PCR-PET bottled water packaging that meets EU food-contact standards for Nigerian exporters. Such collaborations safeguard volume commitments and mitigate price volatility, ensuring steady contributions to the Africa engineering plastics market.
Africa Engineering Plastics Industry Leaders
Covestro AG
Indorama Ventures Public Company Limited
INEOS
SABIC
Safripol division of KAP Diversified Industrial (Pty) Ltd
- *Disclaimer: Major Players sorted in no particular order

Recent Industry Developments
- September 2025: The Norwegian investment fund for developing countries, Norfund, extended financing to the Mohinani Group, a company specializing in plastics manufacturing, packaging, and recycling operations. The investment targets the expansion of plastic recycling capabilities in Ghana and Nigeria, with a focus on advancing recycled polyethylene terephthalate (rPET) development.
- May 2025: Dangote Petroleum Refinery has initiated polypropylene production at its Lekki, Nigeria facility, which has an annual capacity of 900,000 metric tonnes. Through an exclusive distribution partnership with Vinmar International, the refinery is equipped to produce 77 high-performance grades of polypropylene for both domestic and export markets.


Africa Engineering Plastics Market Report Scope
Aerospace, Automotive, Building and Construction, Electrical and Electronics, Industrial and Machinery, Packaging are covered as segments by End User Industry. Fluoropolymer, Liquid Crystal Polymer (LCP), Polyamide (PA), Polybutylene Terephthalate (PBT), Polycarbonate (PC), Polyether Ether Ketone (PEEK), Polyethylene Terephthalate (PET), Polyimide (PI), Polymethyl Methacrylate (PMMA), Polyoxymethylene (POM), Styrene Copolymers (ABS and SAN) are covered as segments by Resin Type. Nigeria, South Africa are covered as segments by Country.| Fluoropolymer | Ethylenetetrafluoroethylene (ETFE) |
| Fluorinated Ethylene-propylene (FEP) | |
| Polytetrafluoroethylene (PTFE) | |
| Polyvinylfluoride (PVF) | |
| Polyvinylidene Fluoride (PVDF) | |
| Other Sub Resin Types | |
| Liquid Crystal Polymer (LCP) | |
| Polyamide (PA) | Aramid |
| Polyamide (PA) 6 | |
| Polyamide (PA) 66 | |
| Polyphthalamide | |
| Polybutylene Terephthalate (PBT) | |
| Polycarbonate (PC) | |
| Polyether Ether Ketone (PEEK) | |
| Polyethylene Terephthalate (PET) | |
| Polyimide (PI) | |
| Polymethyl Methacrylate (PMMA) | |
| Polyoxymethylene (POM) | |
| Styrene Copolymers (ABS, SAN) |
| Aerospace |
| Automotive |
| Building and Construction |
| Electrical and Electronics |
| Industrial and Machinery |
| Packaging |
| Other End-user Industries |
| Nigeria |
| South Africa |
| Rest of Africa |
| By Resin Type | Fluoropolymer | Ethylenetetrafluoroethylene (ETFE) |
| Fluorinated Ethylene-propylene (FEP) | ||
| Polytetrafluoroethylene (PTFE) | ||
| Polyvinylfluoride (PVF) | ||
| Polyvinylidene Fluoride (PVDF) | ||
| Other Sub Resin Types | ||
| Liquid Crystal Polymer (LCP) | ||
| Polyamide (PA) | Aramid | |
| Polyamide (PA) 6 | ||
| Polyamide (PA) 66 | ||
| Polyphthalamide | ||
| Polybutylene Terephthalate (PBT) | ||
| Polycarbonate (PC) | ||
| Polyether Ether Ketone (PEEK) | ||
| Polyethylene Terephthalate (PET) | ||
| Polyimide (PI) | ||
| Polymethyl Methacrylate (PMMA) | ||
| Polyoxymethylene (POM) | ||
| Styrene Copolymers (ABS, SAN) | ||
| By End-User Industry | Aerospace | |
| Automotive | ||
| Building and Construction | ||
| Electrical and Electronics | ||
| Industrial and Machinery | ||
| Packaging | ||
| Other End-user Industries | ||
| By Geography | Nigeria | |
| South Africa | ||
| Rest of Africa | ||


Market Definition
- End-user Industry - Packaging, Electrical & Electronics, Automotive, Building & Construction, and Others are the end-user industries considered under the engineering plastics market.
- Resin - Under the scope of the study, consumption of virgin resins like Fluoropolymer, Polycarbonate, Polyethylene Terephthalate, Polybutylene Terephthalate, Polyoxymethylene, Polymethyl Methacrylate, Styrene Copolymers, Liquid Crystal Polymer, Polyether Ether Ketone, Polyimide, and Polyamide in the primary forms are considered. Recycling has been provided separately under its individual chapter.
| Keyword | Definition |
|---|---|
| Acetal | This is a rigid material that has a slippery surface. It can easily withstand wear and tear in abusive work environments. This polymer is used for building applications such as gears, bearings, valve components, etc. |
| Acrylic | This synthetic resin is a derivative of acrylic acid. It forms a smooth surface and is mainly used for various indoor applications. The material can also be used for outdoor applications with a special formulation. |
| Cast film | A cast film is made by depositing a layer of plastic onto a surface then solidifying and removing the film from that surface. The plastic layer can be in molten form, in a solution, or in dispersion. |
| Colorants & Pigments | Colorants & Pigments are additives used to change the color of the plastic. They can be a powder or a resin/color premix. |
| Composite material | A composite material is a material that is produced from two or more constituent materials. These constituent materials have dissimilar chemical or physical properties and are merged to create a material with properties unlike the individual elements. |
| Degree of Polymerization (DP) | The number of monomeric units in a macromolecule, polymer, or oligomer molecule is referred to as the degree of polymerization or DP. Plastics with useful physical properties often have DPs in the thousands. |
| Dispersion | To create a suspension or solution of material in another substance, fine, agglomerated solid particles of one substance are dispersed in a liquid or another substance to form a dispersion. |
| Fiberglass | Fiberglass-reinforced plastic is a material made up of glass fibers embedded in a resin matrix. These materials have high tensile and impact strength. Handrails and platforms are two examples of lightweight structural applications that use standard fiberglass. |
| Fiber-reinforced polymer (FRP) | Fiber-reinforced polymer is a composite material made of a polymer matrix reinforced with fibers. The fibers are usually glass, carbon, aramid, or basalt. |
| Flake | This is a dry, peeled-off piece, usually with an uneven surface, and is the base of cellulosic plastics. |
| Fluoropolymers | This is a fluorocarbon-based polymer with multiple carbon-fluorine bonds. It is characterized by high resistance to solvents, acids, and bases. These materials are tough yet easy to machine. Some of the popular fluoropolymers are PTFE, ETFE, PVDF, PVF, etc. |
| Kevlar | Kevlar is the commonly referred name for aramid fiber, which was initially a Dupont brand for aramid fiber. Any group of lightweight, heat-resistant, solid, synthetic, aromatic polyamide materials that are fashioned into fibers, filaments, or sheets is called aramid fiber. They are classified into Para-aramid and Meta-aramid. |
| Laminate | A structure or surface composed of sequential layers of material bonded under pressure and heat to build up to the desired shape and width. |
| Nylon | They are synthetic fiber-forming polyamides formed into yarns and monofilaments. These fibers possess excellent tensile strength, durability, and elasticity. They have high melting points and can resist chemicals and various liquids. |
| PET preform | A preform is an intermediate product that is subsequently blown into a polyethylene terephthalate (PET) bottle or a container. |
| Plastic compounding | Compounding consists of preparing plastic formulations by mixing and/or blending polymers and additives in a molten state to achieve the desired characteristics. These blends are automatically dosed with fixed setpoints usually through feeders/hoppers. |
| Plastic pellets | Plastic pellets, also known as pre-production pellets or nurdles, are the building blocks for nearly every product made of plastic. |
| Polymerization | It is a chemical reaction of several monomer molecules to form polymer chains that form stable covalent bonds. |
| Styrene Copolymers | A copolymer is a polymer derived from more than one species of monomer, and a styrene copolymer is a chain of polymers consisting of styrene and acrylate. |
| Thermoplastics | Thermoplastics are defined as polymers that become soft material when it is heated and becomes hard when it is cooled. Thermoplastics have wide-ranging properties and can be remolded and recycled without affecting their physical properties. |
| Virgin Plastic | It is a basic form of plastic that has never been used, processed, or developed. It may be considered more valuable than recycled or already used materials. |


Research Methodology
Mordor Intelligence follows a four-step methodology in all our reports.
- Step-1: Identify Key Variables: The quantifiable key variables (industry and extraneous) pertaining to the specific product segment and country are selected from a group of relevant variables & factors based on desk research & literature review; along with primary expert inputs. These variables are further confirmed through regression modeling (wherever required).
- Step-2: Build a Market Model: In order to build a robust forecasting methodology, the variables and factors identified in Step-1 are tested against available historical market numbers. Through an iterative process, the variables required for market forecast are set and the model is built on the basis of these variables.
- Step-3: Validate and Finalize: In this important step, all market numbers, variables and analyst calls are validated through an extensive network of primary research experts from the market studied. The respondents are selected across levels and functions to generate a holistic picture of the market studied.
- Step-4: Research Outputs: Syndicated Reports, Custom Consulting Assignments, Databases & Subscription Platforms


