
Wire And Cable Compounds Market Size and Share
Market Overview
| Study Period | 2020 - 2031 |
|---|---|
| Market Size (2026) | USD 16.05 Billion |
| Market Size (2031) | USD 20.64 Billion |
| Growth Rate (2026 - 2031) | 5.17 % |
| Fastest Growing Market | Asia Pacific |
| Largest Market | Asia Pacific |
| Market Concentration | Medium |
Major Players *Disclaimer: Major Players sorted in no particular order Image © Mordor Intelligence. Reuse requires attribution under CC BY 4.0. | |
Wire And Cable Compounds Market Analysis by Mordor Intelligence
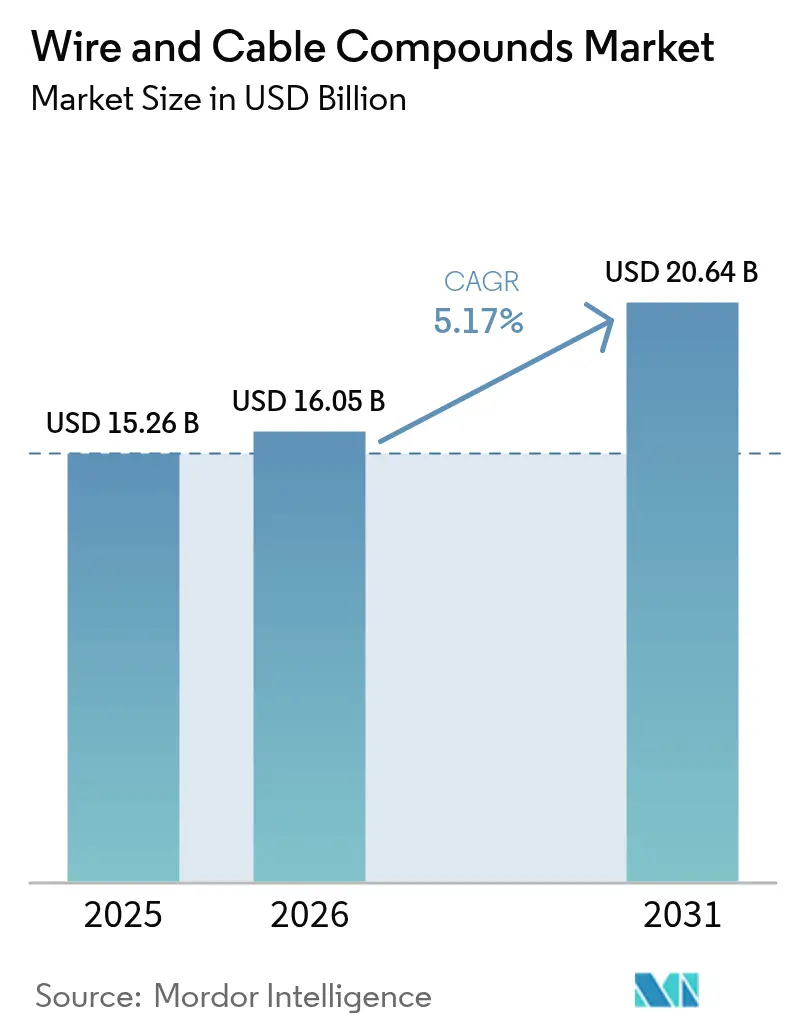
Wire And Cable Compounds Market size in 2026 is estimated at USD 16.05 billion, growing from 2025 value of USD 15.26 billion with 2031 projections showing USD 20.64 billion, growing at 5.17% CAGR over 2026-2031. Robust demand from 5G deployment, renewable-energy grid upgrades, and electric-vehicle (EV) electrification underpins steady volume growth for specialty polymer formulations that can tolerate higher voltages, elevated temperatures, and aggressive operating environments. Increased capital spending on offshore wind connections and high-voltage direct-current (HVDC) export lines is accelerating high-performance cross-linked polyethylene (XLPE) and thermoplastic elastomer (TPE) adoption, while fiber-to-the-home (FTTH) programs drive outsized consumption of bend-insensitive fiber-optic compounds. Parallel regulatory pressure, notably the European Union’s lead-in-PVC ban effective November 2024, is compelling compounders to invest in halogen-free and recycled content offerings. Competitive intensity is rising as integrated chemical majors and regional specialists refine vertical integration strategies, expand extrusion capacity, and commercialize PFAS-free flame-retardant technologies to secure share in the expanding wire and cable compounds market.
Key Report Takeaways
- By product type, fiber-optic cable compounds led with 53.78% revenue share in 2025, is also advance at a 6.03% CAGR through 2031.
- By polymer type, PVC held 38.21% of the wire and cable compounds market share in 2025; other polymers are projected to post the fastest 6.34% CAGR to 2031.
- By functional class, insulation compounds accounted for 45.32% of the wire and cable compounds market size in 2025, whereas shielding and semiconductive compounds advance at a 6.46% CAGR to 2031.
- By end-user industry, the power sector dominated with a 34.35% slice of 2025 revenues, yet electrical and electronics industry are poised for the quickest 6.58% CAGR through 2031.
- By geography, Asia-Pacific commanded 45.88% of global sales in 2025 and continues to register the highest 6.14% CAGR through 2031.
Note: Market size and forecast figures in this report are generated using Mordor Intelligence’s proprietary estimation framework, updated with the latest available data and insights as of 2026.
Market Trends and Insights
Drivers Impact Analysis of Wire And Cable Compounds Market*
| Driver | (~) % Impact on CAGR Forecast | Geographic Relevance | Impact Timeline |
|---|---|---|---|
| Accelerating Renewable-Energy Grid Upgrades | +1.2% | Global, with concentration in Europe, North America, and China | Medium term (2-4 years) |
| 5G And FTTH Broadband Roll-Out | +1.0% | Global, led by Asia-Pacific and North America | Short term (≤ 2 years) |
| EV High-Voltage Cable Demand Surge | +0.8% | Global, concentrated in China, Europe, and North America | Medium term (2-4 years) |
| Increasing Demand from Construction Industry | +0.6% | Asia-Pacific core, spill-over to MEA and Latin America | Long term (≥ 4 years) |
| Recyclable TPE Substitution of Thermosets | +0.4% | Europe and North America, expanding to Asia-Pacific | Long term (≥ 4 years) |
| Source: Mordor Intelligence | |||
Accelerating Renewable-Energy Grid Upgrades
National decarbonization targets are pushing utilities toward offshore wind farms and distributed solar arrays that require HVDC export and inter-array cables rated up to 525 kV. Compounders are responding with peroxide-cross-linked XLPE and low-smoke, halogen-free TPE grades engineered for prolonged immersion, extreme thermal cycling, and ultraviolet exposure. The United States Department of Energy highlights compound durability as a priority in its harsh-environment materials roadmap, reinforcing demand for formulations that couple high dielectric strength with corrosion resistance[1]U.S. Department of Energy, “Harsh Environment Materials Roadmap,” energy.gov . Increasing smart-grid sensor density also necessitates electromagnetic-compatibility-enhanced semiconductive layers, cementing long-run upside for the wire and cable compounds market.
5G and FTTH Broadband Roll-Out
Hyperscale data-center operators and telecom carriers are migrating from copper to optical links as artificial-intelligence workloads elevate throughput targets beyond 224 Gbps. Bend-insensitive, low-attenuation fiber-optic compounds incorporating nano-silica and advanced UV stabilizers enable tighter bend radii without signal loss, supporting rollable ribbon constructions that pack 3,456 fibers in a single cable. The United States BEAD program’s USD 42.5 billion funding boosts last-mile fiber builds, sustaining consumption of outdoor-rated jacketing compounds that endure moisture ingress, rodent attack, and wide temperature swings. Prysmian’s USD 30 million Tennessee line expansion underscores confidence in long-term FTTH demand and fortifies competition in the wire and cable compounds market.
EV High-Voltage Cable Demand Surge
Automakers transitioning to 800 V electrical architectures require flexible, lightweight harnesses capable of continuous operation at 150 °C and peak temperatures of 200 °C. Cross-linked polyolefin blends and silicone-based insulation with enhanced dielectric breakdown strength are penetrating traction-motor, battery, and charging circuits. Simultaneously, OEM recyclability targets are accelerating the pivot toward thermoplastic elastomers that can be mechanically reprocessed, aligning with end-of-life directives in Europe. Early integration of carbon-nanotube-reinforced conductors promises 30% weight reduction while retaining conductivity, offering a performance premium that supports ASP uplift in the wire and cable compounds market.
Increasing Demand from Construction Industry
Rapid urbanization across South and Southeast Asia is spurring infrastructure outlays for mass-transit, smart-city, and data-center projects. Building codes are tightening flame-spread thresholds, favoring low-smoke, halogen-free formulations in riser and plenum environments. Green-building incentives under LEED and BREEAM programs stimulate interest in bio-based plasticizers and recycled PVC compounds, widening the addressable pool for environmentally preferable wire and cable compounds market offerings. Integration of power over Ethernet (PoE) devices in office towers additionally fuels demand for hybrid data-cum-power cable constructions using co-extruded insulation and semiconductive layers.
Restraints Impact Analysis of Wire And Cable Compounds Market*
| Restraint | (~) % Impact on CAGR Forecast | Geographic Relevance | Impact Timeline |
|---|---|---|---|
| Petrochemical Feed-Stock Price Volatility | -0.8% | Global, with highest impact in Asia-Pacific manufacturing hubs | Short term (≤ 2 years) |
| Phthalate and Heavy-Metal Regulatory Bans | -0.6% | Europe and North America, expanding to Asia-Pacific | Medium term (2-4 years) |
| Skilled-Labour Deficit for Fluoropolymer Compounding | -0.3% | North America and Europe, specialized manufacturing centers | Long term (≥ 4 years) |
| Source: Mordor Intelligence | |||
Petrochemical Feed-Stock Price Volatility
Ethylene and vinyl-chloride monomer price swings tied to geopolitical disruptions and refinery outages compress compounder margins, especially for small and mid-sized firms lacking hedging capacity. Aluminum cost escalation linked to vehicle lightweighting simultaneously inflates conductor bills, prompting some cable makers to renegotiate supply contracts or defer expansion plans. Long-term offtake agreements and backward integration into cracker assets by leading resin suppliers partially insulate larger players, yet volatility remains a structural headwind for the wire and cable compounds market.
Phthalate and Heavy-Metal Regulatory Bans
The EU’s lead-in-PVC ban takes effect in November 2024, while China’s phthalate restrictions commence in January 2026, compelling global reformulations. Compounders must preserve UL- and IEC-rated dielectric and mechanical performance without cost-effective stabilizers, extending validation cycles by up to 24 months and inflating R&D budgets. North America faces parallel pressure as Canada widens its toxic-substances schedule in October 2025, adding complexity for exporters. Compliance costs weigh disproportionately on smaller entrants, accelerating consolidation within the wire and cable compounds market.
*Our forecasts treat driver/restraint impacts as directional, not additive. The impact forecasts reflect baseline growth, mix effects, and variable interactions.
Wire And Cable Compounds Market Segment Analysis
By Product Type:
Fiber-Optic Leadership BroadensFiber-optic cable compounds accounted for 53.78% of global revenues in 2025, and this slice of the wire and cable compounds market size is forecast to enlarge at a 6.03% CAGR to 2031 as data-center and FTTH networks supplant legacy copper backbones. Subsea interconnect cables for offshore wind export and transoceanic routes further amplify demand for water-blocking gels, thixotropic fillers, and hydrophobic jacketing compounds that ensure optical-signal integrity under 6,000-meter hydrostatic pressure.
Demand for coaxial and specialty cable compounds endures in aerospace, test-equipment, and RF-shielded environments where attenuation control outweighs bandwidth constraints. Self-healing polyurethane jackets employing microcapsule technology are being piloted for mission-critical data halls, promising lower mean-time-to-repair and bolstering competitiveness within the wire and cable compounds market.




By Polymer Type:
PVC Resilience Meets Accelerating AlternativesPVC retained 38.21% of 2025 revenues, securing the largest wire and cable compounds market share thanks to cost competitiveness, broad processability, and flame-retardant synergies with mineral fillers. Nonetheless, upcoming bans on lead stabilizers and high-phthalate plasticizers elevate transition risk and propel other polymer types (fluoropolymers, etc.) to a projected 6.34% CAGR through 2031.
Emerging non-halogenated materials such as polyetheretherketone (PEEK) and liquid-crystal polymers cater to ultra-high-frequency, low-loss applications in advanced computing and spaceflight. Avient’s bio-derived, halogen-free TPE portfolio demonstrates how sustainability credentials can unlock premium price points and capture incremental share in the wire and cable compounds market.
By Functional Class:
Insulation Dominates; Shielding EscalatesInsulation compounds generated 45.32% of sales in 2025, underlining their foundational role in every cable architecture. Mineral-hybrid flame-retardant systems and nano-dielectric additives are lifting continuous-use temperature ratings above 150 °C, positioning XLPE and silicone blends for high-stress EV and renewables duties.
Shielding and semiconductive compounds, though smaller, are on track for a 6.46% CAGR to 2031 as electromagnetic-interference mitigation becomes indispensable in densely packed data-center, factory-automation, and smart-grid environments. Carbon-nanotube-doped polyethylene offers surface resistivity below 10³ Ω, satisfying IEC 60228 while preserving flexibility, a technical edge that widens the addressable slice of the wire and cable compounds market.
By End-User Industry:
Power Sector Remains Anchor; Electronics SurgesThe power-utilities domain delivered 34.35% of turnover in 2025, reflecting HV and EHV build-outs tied to renewable-energy integration and grid hardening. XLPE submarine cables with peroxide-cross-linked insulation are now rated to 525 kV, translating into thicker insulation layers and higher compound volumes per circuit-kilometer.
Electrical and electronics demand, however, is anticipated to expand at a 6.58% CAGR through 2031 on the strength of cloud-computing investment, edge-data-center proliferation, and connected-device ubiquity. Miniaturized medical-device leads and robotic-arm cables require high-flex life TPE and TPU compounds, enhancing margin potential across the wire and cable compounds market.

Geography Analysis
APAC Wire and Cable Compounds Market
Asia-Pacific dominated global consumption with a 45.88% share in 2025, equivalent to the largest regional slice of the wire and cable compounds market size, and is forecast to progress at a 6.14% CAGR as China ramps wind-turbine grid connections and India accelerates 5G roll-outs. Government incentives for domestic EV supply chains are driving localized compound sourcing, particularly high-voltage orange sheathing materials that comply with GB/T standards. Japanese and South Korean electronics clusters further stimulate high-purity fluoropolymer and liquid-crystal-polymer demand.
North America Wire and Cable Compounds Market
North America constitutes a mature yet innovation-intensive arena where infrastructure-law funding, BEAD broadband grants, and fast-growing EV charging networks sustain premium material uptake. Compliance with the Inflation Reduction Act’s Buy-America clauses channels investment toward U.S. extrusion lines, an effect evidenced by Prysmian’s Jackson and AFL’s South Carolina capacity expansions. Canada’s stricter hazardous-substance limits, effective 2025, expedite migration to PFAS-free and recycled-content compounds, reinforcing sustainable differentiation within the wire and cable compounds market.
Europe Wire and Cable Compounds Market
Europe prioritizes circular-economy and decarbonization goals, propelling demand for lead-free, bio-plasticized PVC and halogen-free formulations that meet Construction Products Regulation (CPR) EuroClass B2ca requirements. Germany’s EV output and the United Kingdom’s offshore wind surge underpin high-voltage and subsea cable projects, respectively. Eastern European extrusion hubs exploit lower labor costs to serve regional construction booms, while Norway supports deepwater HVDC cable programs through Nexans’ 200-meter tower expansion. Despite geopolitical friction, select Russian grid-modernization projects still secure specialty compounds from European suppliers owing to performance mandates.


Regulatory Landscape
Chemical safety and electrical-compliance requirements are tightening around additives used in wire and cable compounds, pushing compounders to reformulate away from heavy metals and certain plasticizers. In the European Union, REACH Annex XVII restrictions introduced under Commission Regulation (EU) 2023/923 (effective November 2024) set specific lead concentration limits for PVC (including a ceiling of 1.5% lead in recovered rigid PVC for specified uses) and require labeling for articles containing 0.1% or more lead from recovered rigid PVC. This is driving investment into lead-free stabilizer systems and stronger traceability in recycled-content formulations.
Electronics-related exemptions are also narrowing, affecting materials that interface with wiring systems and equipment. RoHS Annex III lead exemptions were amended via Delegated Directives (EU) 2025/1802, (EU) 2025/2363, and (EU) 2025/2364, with national transposition deadlines aligning to mid-2026 and application from 1 July 2026 in the EU. This increases validation workloads for cable compounds used in regulated electrical products. Separately, the European Commission progressed a REACH restriction pathway for hydrogenated terphenyl (PHT) in 2026, including a WTO TBT notification in May 2026 with consultation running to 7 July 2026, indicating ongoing scrutiny for specialized additives used across polymer systems.
Value Chain Analysis
The value chain starts with upstream petrochemical and polymer production (PVC, polyethylene and related polyolefins), followed by additive suppliers providing flame retardants, stabilizers, plasticizers, fillers, and specialty modifiers. Compounders then execute formulation, compounding, and pelletizing (including clean handling for high-voltage and fiber applications), supplying insulation, sheathing/jacketing, bedding/filling, and shielding or semiconductive compounds to wire and cable manufacturers. Cable makers convert compounds through extrusion and cross-linking routes (including XLPE) and sell into utilities and grid projects, telecom and data-center builds, EV and industrial OEMs, and the construction channel via distributors and project contractors.
Operational conditions are also shaping procurement and logistics. Industry tracking cited in Q2 2026 showed elevated lead-time variability (coefficient of variation at 42%) alongside safety stock levels around 4.2 weeks, below an industry-recommended 6-week minimum. This is reinforcing longer-term supply agreements and multi-sourcing for critical compound inputs. Trade and compliance requirements further influence flows, including documentation audits tied to the EU CBAM process through major ports such as Rotterdam and Hamburg. In parts of China, regional energy constraints can affect extrusion uptime for cable production, which elevates the value of localized compounding and qualified second-source additive packages.
Competitive Landscape
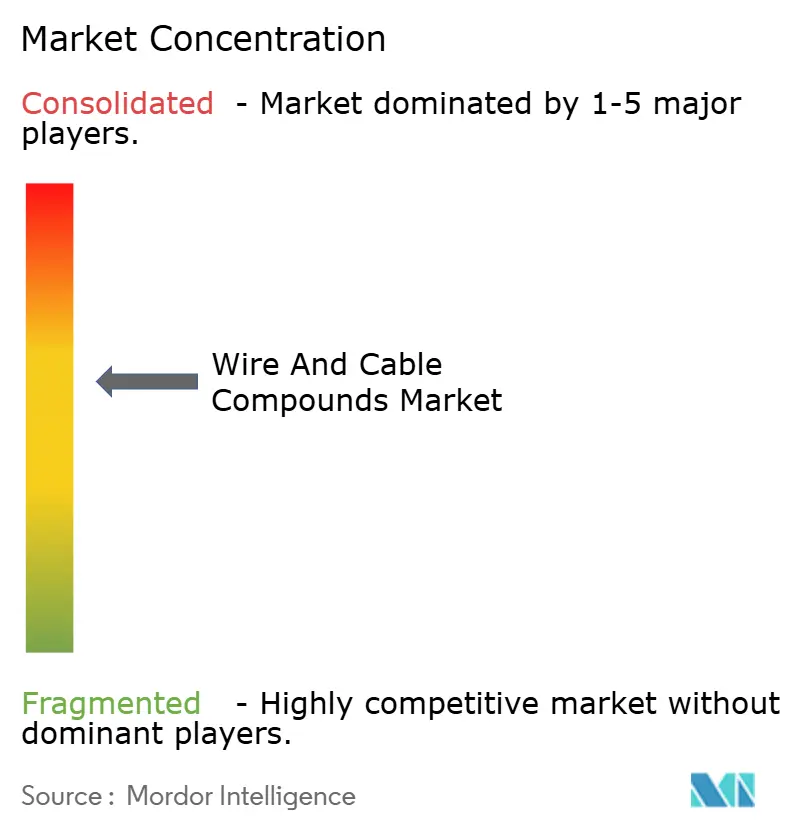
Market structure is moderately consolidated but trending toward higher concentration as integrated conglomerates absorb niche compounders to gain scale, technology, and customer intimacy. Prysmian’s USD 3.9 billion acquisition of Encore Wire in 2024 and its USD 950 million purchase of Channell Commercial Corporation in 2025 broadened its North American copper-wire and FTTH enclosure capability, illustrating strategic portfolio expansion. Arkema, Dow, SABIC, and Solvay leverage backward integration into monomers and additives to secure feedstock reliability and margin capture across the wire and cable compounds market.
Specialist houses such as Electric Cable Compounds, Teknor Apex, and ECC supply customized halogen-free, irradiation-cross-linkable, and nano-filled recipes alongside rapid color-matching services. Their agility in tailoring formulations grants them defensible niches despite scale disadvantages. Capacity expansions are capital-intensive: Nexans’ Norwegian HVDC plant incorporates a 200-meter extrusion tower and on-site clean-room pellet storage to ensure contaminant-free insulation for 525 kV exports[2]Nexans SA, “Extrusion Tower Investment,” nexans.com .
Technology competition concentrates on sustainability and performance. Solvay’s PFAS-alternative fluoropolymers target 5G millimeter-wave dielectrics, while Avient’s bio-sourced TPEs address consumer-electronics jackets. Digital-twin modeling tools accelerate compound qualification, cutting the development cycle by up to 30% and providing a data-rich feedback loop to refine formulations. Skilled-labor scarcity in high-purity extrusion offers incumbents with deep process know-how a durable moat, but long-term success will hinge on continuous compliance with evolving chemical-safety statutes and carbon-footprint disclosure norms that increasingly shape procurement decisions in the wire and cable compounds market.
Wire And Cable Compounds Industry Leaders
Solvay
Borealis GmbH
Teknor Apex
Dow
SCG Chemicals Public Company Limited
- *Disclaimer: Major Players sorted in no particular order
Wire And Cable Compounds Market Companies Covered in this Report
- AFL
- Arkema
- Borealis GmbH
- BUSS AG
- Cabot Corporation
- ChemCeed
- Dow
- Electric Cable Compounds Inc.
- Hanwha Solutions Chemical Division Corporation
- Jiangsu Dewei New Materials Co., Ltd
- Melos GmbH
- Nexans
- Orbia
- Prysmian
- Relicab Cable
- SABIC
- SCG Chemicals Public Company Limited
- Solvay
- Teknor Apex
- Trelleborg AB

Market Opportunities and Future Outlook
A key opportunity lies in performance and compliance upgrades that reduce requalification pain for cable makers facing tighter fire and chemical rules. Demand pull is visible in halogen-free flame-retardant (HFFR) and higher fire-performance solutions aligned with construction and infrastructure standards such as CPR Euroclass B2ca. It is also supported by portfolio migration away from legacy lead-stabilized PVC systems following the EU REACH lead restrictions effective from November 2024. In 2026, Borouge International introduced FR6012, a halogen-free flame-retardant monolayer sheathing compound positioned for medium- to extra-high-voltage cable designs and advertised to meet ST12 fire-performance requirements, showing where compound innovation is being commercialized.
Capacity localization and scaling of HV and HVDC-capable materials is another opportunity, since cable performance requirements increase the value of consistent, contamination-controlled compounding. Borealis and Borouge have an announced EUR 200 million investment program to upgrade and expand XLPE and semiconductive compounding assets across European sites, including Antwerp (Belgium) and Stenungsund (Sweden). In parallel, Borouge commissioned a 100,000-metric-ton XLPE capacity expansion at the Borouge 4 facility in Ruwais (UAE). These actions support a market opening for compounders that can provide stable long-run supply, validated semicon systems, and formulations tuned for higher voltage ratings and harsher operating environments, alongside recycled-content or bio-attributed options that help cable OEMs align procurement with circularity targets.
Recent Industry Developments in Wire And Cable Compounds Market
- April 2026: Borouge International reported progress on wire and cable materials capacity expansion initiatives spanning Asia, Europe, and the Middle East. The update signals continued investment in supply availability for cable insulation and sheathing materials as grid and electrification projects demand higher volumes and tighter quality consistency.
- April 2025: Prysmian partnered with Dow to support production of Sirocco microduct cables using Dow's AXELERON telecommunications cable compound. The collaboration strengthens material-performance alignment for telecom copper and fiber builds, linking compound selection more directly to cable manufacturability and deployment reliability.
- March 2024: AFL invested USD 50 million to expand fiber optic cable manufacturing operations in South Carolina. The expansion emphasized sustainable fiber optic cable solutions and compliance with American-made materials requirements, increasing regional capacity to serve U.S. broadband and connectivity programs.


Wire And Cable Compounds Market Report Scope and Research Methodology
Market Definition and Coverage
For this methodology, the wire and cable compound market is defined as the value of polymer compounds used to insulate and jacket wire and cable products, which are sold into power, building, telecom, industrial, and mobility related cabling demand.
Scope exclusions: We exclude finished wires and cables, metal conductors, and non-compound accessories such as connectors and conduits.
Segments Covered in This Report
- By Product Type
- Fiber Optic Cable
- Coaxial Cable
- Other Products (Specialty cables, etc.)
- By Polymer Type
- Polyvinyl Chloride (PVC)
- Thermoplastic Olefins (TPO)
- Thermoplastic Elastomer (TPE)
- Thermoplastic Polyurethane (TPU)
- Other Polymer Types (Fluoropolymers, etc.)
- By Functional Class
- Insulation Compounds
- Sheathing/Jacketing Compounds
- Bedding and Filling Compounds
- Shielding and Semiconductive Compounds
- By End-User Industry
- Power
- Construction
- Automotive
- Telecommunications
- Electrical and Electronics
- Healthcare
- Other End-user Industries (Industrial, etc.)
- By Geography
- Asia-Pacific
- China
- Japan
- India
- South Korea
- ASEAN Countries
- Rest of Asia-Pacific
- North America
- United States
- Canada
- Mexico
- Europe
- Germany
- United Kingdom
- France
- Italy
- Spain
- Russia
- NORDIC Countries
- Rest of Europe
- South America
- Brazil
- Argentina
- Rest of South America
- Middle East and Africa
- Saudi Arabia
- South Africa
- Rest of Middle East and Africa
- Asia-Pacific
Data Sources, Market Sizing, and Validation
Desk Research
Desk work starts with getting the demand context and material flow right, since compounds move with cable output and resin pricing. We use public sources such as the World Bank and IMF for macro indicators, UN Comtrade for trade signals on relevant polymers and additives, and IEA for electricity and grid expansion indicators that influence cable demand.
To keep the industry side grounded, we also review items such as U.S. Census construction data, Eurostat industrial production series, and standards and compliance notes published by well-known regulators and associations (for example, safety and material restriction updates). Company annual reports, investor decks, and plant announcements are added to understand capacity changes and product mix shifts, and a paid subscription covering company financials, patent databases, and shipment-level trade logs is used selectively to validate directionally. These are illustrative sources only, and many other public references were also used for cross-checking and clarification during the study.
Primary Interviews and Surveys
Primary discussions are used to pressure test the model inputs that are hard to read from public data alone, including compound conversion rates per cable type, typical pricing reset cycles, and the split between halogenated and halogen-free formulations. We spoke with a mix of compound producers, cable makers, distributors, and downstream specifiers across APAC, EMEA, and the Americas, which helped us align assumptions and close gaps where desk indicators were noisy.
Distribution of primary research fieldwork respondents
| Company type | Respondent position | Region |
|---|---|---|
| Top tier: 35% | CXOs: 13% | APAC: 40% |
| Mid tier: 50% | Functional/Unit leaders: 43% | EMEA: 33% |
| Smaller Players: 15% | Managers: 44% | Americas: 27% |
Market-Sizing & Forecasting
The market is built using a top-down approach where wire and cable output and end-use build activity are translated into a compound demand pool, and then converted into value using region-specific pricing logic. Since a single indicator can mislead, results are corroborated with selective bottom-up approximations, such as sampled supplier revenue splits, channel checks on volumes, and ASP times volume sanity checks for a few high-usage applications.
Key inputs tracked in the model include construction and infrastructure activity, grid and renewable additions, automotive harness and EV build trends, telecom fiber and 5G rollout pace, and resin and additive price movement that feeds into compound ASPs. Where pricing is volatile, we handle it with a staged ASP progression that reflects contract reset frequency and mix shifts between halogenated and halogen-free compounds, instead of assuming a straight-line price trend.
For forecasting, scenario analysis is used on the demand drivers and then reconciled to an exponential smoothing path for short-term stability in volumes, followed by expert-led adjustments when policy or large project cycles are expected to change timing. If a bottom-up check is missing for a small geography, the gap is filled using nearby country intensity ratios (compound spend per unit of cable output), and the impact is kept visible during review.
Data Validation & Update Cycle
Validation is done in steps so the numbers stay consistent with real market signals. We compare modeled demand and pricing against independent indicators like construction output, power and grid investment direction, and reported resin price movement, and then we recheck any large variances by region before sign-off.
Outliers are investigated with follow-up calls when a change is driven by one assumption, like an unusual ASP jump or a sudden capacity addition that is not visible in public records yet. The report is refreshed annually, with interim updates when material events occur, and a final pre-delivery review is completed so the most recent macro, pricing, and industry developments are reflected.
Mordor Intelligence's Wire and Cable Compound Market Size Measured Against Other Published Estimates
It is common to see different market sizes for wire and cable compounds, even when the topic sounds the same at a high level. The spread usually comes from how each study treats pricing timing, what it counts as a compound versus an adjacent material, and whether volume signals are checked against real end-market activity.
When exchange rates, resin-linked surcharges, and contract reset cycles are updated on a consistent cut-off date and then validated against build indicators and polymer price signals, the market total changes in a visible way, which is a refresh discipline used in Mordor Intelligence's 2026 estimate.
Benchmark comparison
| Source | Market Size | Gaps in Research Methodology |
|---|---|---|
| Mordor Intelligence | USD 16.05 B (2026) | |
| Global Consultancy A | USD 16.82 B (2025) | Uses a different base year and a longer forecast window, which can inflate near-term value if resin price cycles and currency timing are not aligned to the same cut-off month. |
| Industry Publisher B | USD 8.88 B (2025) | Appears to apply a narrower pricing and scope treatment for compounds, and the lower base value suggests differences in what is counted as compound content per cable and how halogen-free and specialty formulations are priced. |
Reading the table together, the main lesson is that year selection and price timing drive large swings in a market where raw material pass-through is frequent. Our approach keeps the size traceable to a clear demand pool and a practical ASP build, and then it is cross-checked against independent activity signals before the final number is locked in for the study year.


Key Questions Answered in the Report
What is the current size of the wire and cable compounds market?
The wire and cable compounds market size reached USD 16.05 billion in 2026 and is on track to hit USD 20.64 billion by 2031.
Which product category holds the largest share of global demand?
Fiber-optic cable compounds led with a 53.78% share of 2025 revenues, reflecting rapid data-infrastructure deployment worldwide.
Which end-use industry is growing the fastest?
Electrical and electronics applications are forecast to expand at a 6.58% CAGR through 2031 as cloud-computing and connected-device penetration accelerates.
How will regulatory bans affect PVC-based formulations?
The EU lead-stabilizer ban effective November 2024 and upcoming phthalate restrictions are prompting compounders to transition toward lead-free and bio-plasticized PVC or alternative thermoplastic elastomers.
Why is Asia-Pacific the dominant regional market?
Asia-Pacific accounts for 45.88% of global demand due to strong manufacturing capacity, aggressive 5G and renewable-energy investment, and expanding EV production.
Page last updated on:


 Your data is secure and never sold or shared.


