
United States Pet Market Size and Share
Market Overview
| Study Period | 2021 - 2031 |
|---|---|
| Forecast Data Period | 2026 - 2031 |
| Base Year Market Size (2025) | USD 155.40 Billion |
| Market Size (2026) | USD 165.60 Billion |
| Market Size (2031) | USD 228 Billion |
| Growth Rate (2026 - 2031) | 6.60 % |
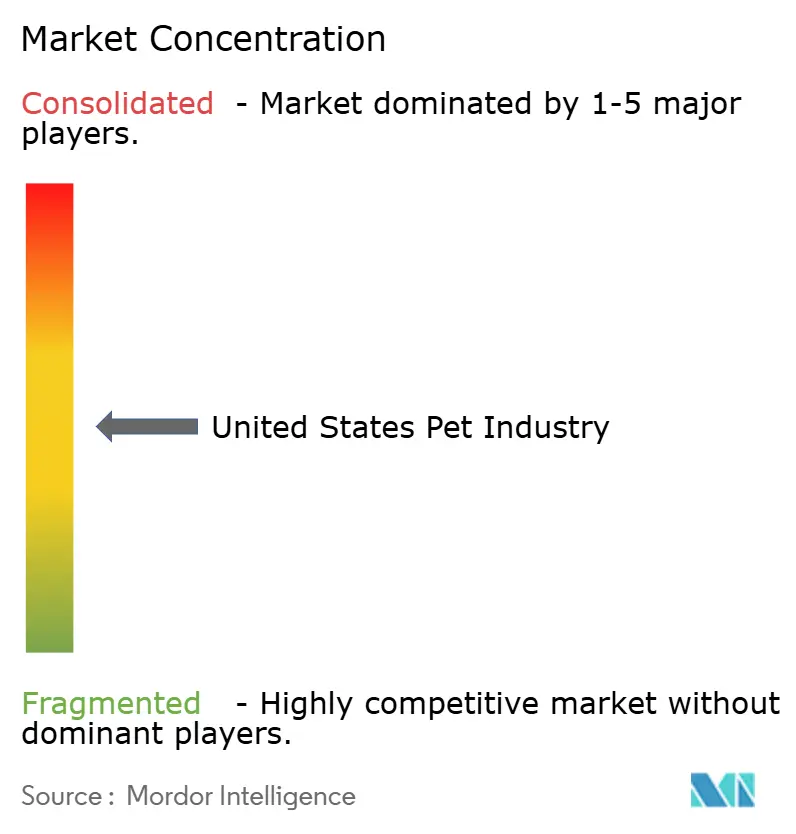
| Market Concentration | Medium |
Major Players *Disclaimer: Major Players sorted in no particular order Image © Mordor Intelligence. Reuse requires attribution under CC BY 4.0. | |
United States Pet Market Analysis by Mordor Intelligence
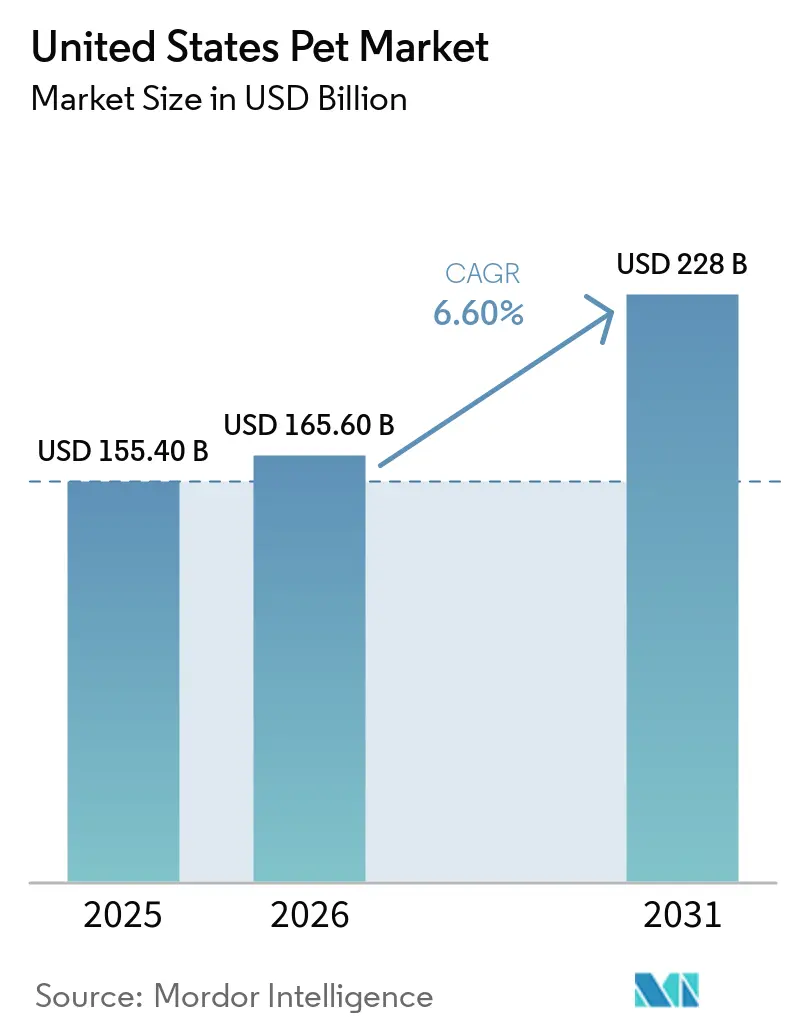
The United States pet market was valued at USD 155.4 billion in 2025 and estimated to grow from USD 165.6 billion in 2026 to reach USD 228.0 billion by 2031, at a CAGR of 6.60% during the forecast period (2026-2031). This expansion demonstrates how pets have shifted from household companions to lifestyle investments, prompting stable demand for premium nutrition, preventive healthcare, and digitally enabled services. Rising employer-sponsored pet benefits, the popularity of fresh and frozen food, and streamlined drug approvals for companion animals are expanding the addressable market while protecting margins against inflation. Online autoship models, direct-to-consumer subscriptions, and omnichannel fulfillment continue to gain traction, reshaping the competitive cost structure and accelerating consolidation. At the same time, veterinary workforce shortages, extended producer responsibility packaging fees, and inflation-driven trade-down behavior temper above-trend growth, underscoring the need for strategic agility to remain critical for brand owners.
Key Report Takeaways
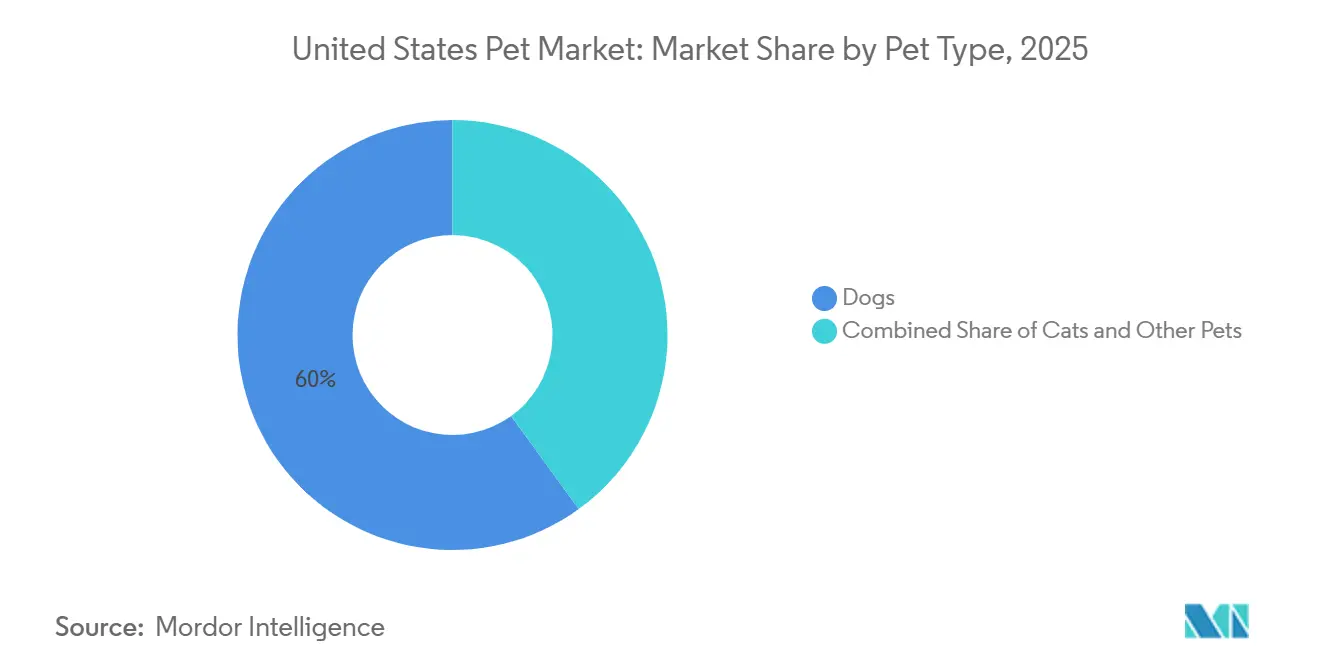
- By pet type, dogs captured 60% of the United States pet market share in 2025, while cats are advancing at a 7.8% CAGR through 2031.
- By product type, food commanded 38.7% of the United States pet market size in 2025, whereas services are forecast to expand at a 16.5% CAGR to 2031.
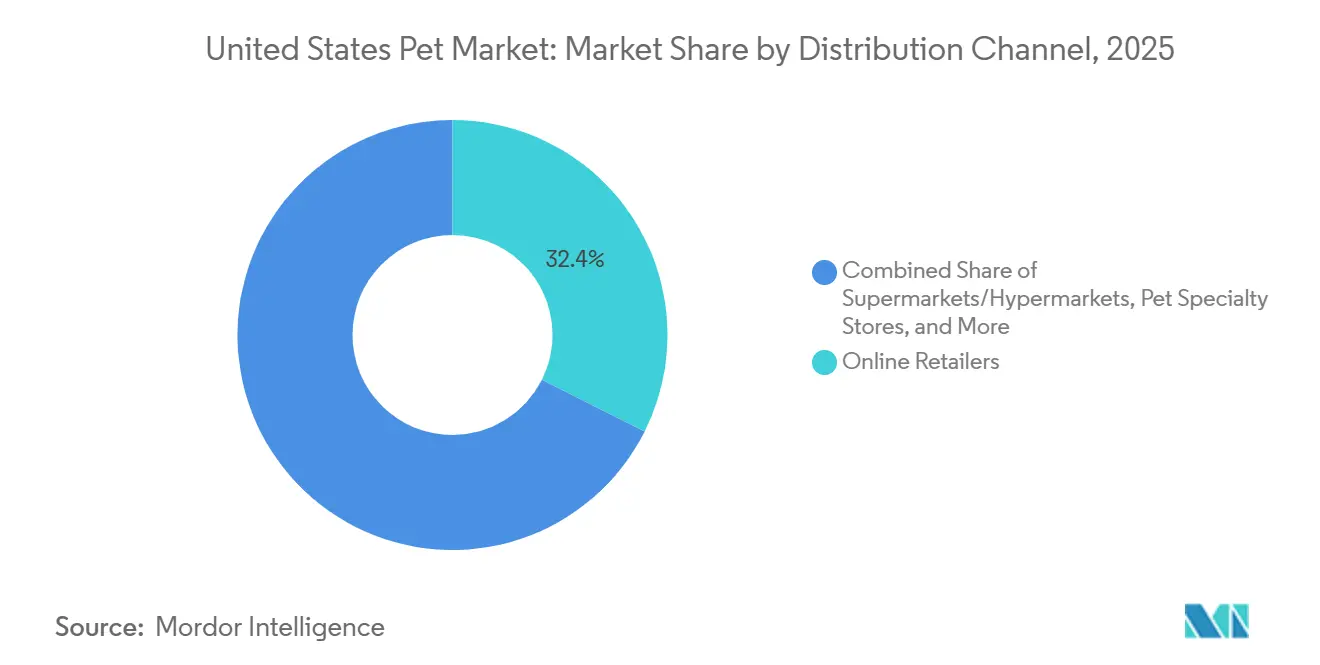
- By distribution channel, online retailers held 32.4% share of the United States pet market size in 2025, while direct-to-consumer brands are scaling at an 18.9% CAGR to 2031.
Note: Market size and forecast figures in this report are generated using Mordor Intelligence’s proprietary estimation framework, updated with the latest available data and insights as of January 2026.
United States Pet Market Trends and Insights
Drivers Impact Analysis*
| Driver | (~) % Impact on CAGR Forecast | Geographic Relevance | Impact Timeline |
|---|---|---|---|
| Humanization-Driven Premium Spend | +1.80% | Urban coastal metros and nationwide midsize cities | Long term (≥ 4 years) |
| Accelerating E-commerce and Omnichannel Penetration | +1.50% | Metropolitan areas with same-day delivery infrastructure | Medium term (2-4 years) |
| Rising Pet-Insurance Adoption | +1.20% | States with high employer-benefit adoption and technology hubs | Medium term (2-4 years) |
| Employer-Sponsored Pet-Care Benefits Expansion | +0.70% | Fortune 500 headquarters and technology clusters | Long term (≥ 4 years) |
| FDA Fast-Track Pathway for Novel Therapeutics | +0.60% | Nationwide through FDA Center for Veterinary Medicine | Short term (≤ 2 years) |
| Climate-Resilient Novel Protein Sourcing | +0.50% | Nationwide supply chains and ingredient-sourcing regions | Long term (≥ 4 years) |
| Source: Mordor Intelligence | |||
Humanization-Driven Premium Spend
Fresh and frozen meals have highlighted consumers' willingness to invest in minimally processed, nutritious options. The emphasis on premium offerings has expanded to include services such as grooming, behavioral training, and spa treatments, creating recurring revenue opportunities for specialty retailers. Transparency in product ingredients, including single-protein formulas and non-GMO (genetically modified organism) labels, strengthens brand loyalty among health-conscious pet owners. Additionally, social media platforms contribute to the normalization of high-end purchases by promoting aspirational pet lifestyles, thereby increasing peer-to-peer influence on purchasing decisions. Companies that integrate personalization and functional health claims continue to experience consistent demand for premium products, even during broader economic uncertainties.
Accelerating E-commerce and Omnichannel Penetration
Online channels captured a significant share of the United States pet market revenue in 2025, a share driven by autoship subscriptions that reduce churn and elevate lifetime value. E-retailer Chewy generated USD 11.86 billion in net sales for fiscal 2024, with the majority share derived from autoship customers. Brick-and-mortar chains responded by launching click-and-collect services, deploying mobile apps, and partnering with last-mile couriers to match the immediacy of pure plays. Direct-to-consumer newcomers leverage higher gross margins to fund agile innovation and rapid brand storytelling. This distribution shift compresses prices in commodity categories while widening the gap in premium, data-driven services.
Rising Pet-Insurance Adoption
Pet insurance penetration reached about 3.9% of the United States' pets in 2024, as employer subsidies expanded coverage and reduced out-of-pocket costs. Subscriber growth demonstrates how predictable premiums encourage pet owners to approve diagnostic testing and elective procedures. Aggressive pricing strategies by new entrants are expanding consumer options and increasing market awareness. While state-level regulation remains inconsistent, proposed model legislation under review seeks to standardize policy terms, potentially expanding the addressable market. Additionally, insurance adoption helps stabilize veterinary clinic revenue by mitigating seasonal fluctuations in visit frequency.
FDA Fast-Track Pathway for Novel Therapeutics
An expedited review process compressed approval timelines for monoclonal antibody therapies designed for osteoarthritis, with two treatments cleared in 2024 [1]Source: Association of American Feed Control Officials, “2025 Ingredient Definitions,” aafco.org. Faster market access encourages pharmaceutical firms to reallocate R&D budgets toward companion animals, a segment historically overshadowed by livestock. First movers gain a pricing window before biosimilars arrive, spurring additional research into chronic disease categories such as dermatology and oncology. The regulatory program aligns with broader digital health guidance, facilitating telemedicine integration and prescription fulfillment through online pharmacies.
Restraints Impact Analysis*
| Restraint | (~) % Impact on CAGR Forecast | Geographic Relevance | Impact Timeline |
|---|---|---|---|
| Inflation-Driven Trade-Down to Value Brands | −1.1% | Nationwide, most acute in lower-income and rural households | Short term (≤ 2 years) |
| Veterinary Workforce Shortage | −0.9% | Nationwide, severe in rural and underserved urban areas | Medium term (2-4 years) |
| Extended Producer-Responsibility Packaging Fees | −0.5% | California, Oregon, and Maine with additional states considering laws | Long term (≥ 4 years) |
| Social-Media Trend Volatility and Inventory Risk | −0.4% | Nationwide specialty retail and direct-to-consumer channels | Short term (≤ 2 years) |
| Source: Mordor Intelligence | |||
Inflation-Driven Trade-Down to Value Brands
Consumer budgets tightened in 2025 as food and energy prices rose, shifting demand toward private-label offerings at mass merchants. A leading warehouse club’s in-house pet food line gained share, compressing volume for mid-tier brands. Bank transaction data indicated that category spending grew just 3.2% in 2025, below long-term averages [2]Source: Bank of America Institute, “Consumer Spending Pulse 2025,” bankofamerica.com. Brands have responded with smaller pack sizes and value-tier extensions to preserve shopper loyalty. While inflation is projected to moderate, price sensitivity could outlast the immediate economic cycle, making portfolio depth essential for manufacturers.
Veterinary Workforce Shortage
Thirty-four percent of veterinarians reported burnout symptoms in 2025, intensifying capacity constraints at clinics [3]Source: American Veterinary Medical Association, “Workforce Report 2025,” avma.org. The average graduate debt deters new entrants from entering companion-animal practice, especially in rural communities. Appointment backlogs prolong elective procedures, curtailing sales of dental, orthopedic, and nutritional products. Telehealth triage and expanded technician scope offer partial relief but cannot fully replace in-person diagnostics. Unless enrollment and retention improve, the shortage will weigh on service revenues through at least 2029.
*Our forecasts treat driver/restraint impacts as directional, not additive. The impact forecasts reflect baseline growth, mix effects, and variable interactions.
Segment Analysis
By Pet Type: Cats Narrow the Gap
Dogs accounted for 60% of the United States pet market size in 2025, while cats are projected to outpace with a 7.8% CAGR through 2031. The faster feline trajectory stems from apartment-friendly ownership patterns among young professionals and the recent rollout of premium cat-specific nutrition, therapeutic, and insurance products. Other pets, such as birds, freshwater fish, reptiles, and small mammals, combined, represented comparatively less revenue, benefiting from specialized diets and habitat innovations that boost average basket size. Cats’ expanding penetration into employer-sponsored insurance programs reinforces the frequency of clinical care, narrowing historical disparities with canine coverage. Regulatory approvals, such as the monoclonal antibody for feline osteoarthritis in 2024, further catalyze veterinary spend and anchor the species’ upgrade cycle.
Lower ownership costs and an independent nature make cats attractive for urban dwellers, while social media visibility elevates their cultural status, propelling accessory and furniture purchases. Dogs retain leadership in services such as daycare, training, and outdoor gear, where behavioral complexity supports higher ticket prices. Reptile and exotic avian ownership is limited by interstate transport rules and veterinary accessibility, capping their upside despite niche enthusiasm. Small mammal sales remain stable, buoyed by educational campaigns underscoring responsible care. To succeed across species, manufacturers and retailers must tailor communication and product design to distinct behavioral and health drivers rather than adopting a monolithic strategy.



By Product Type: Services Outpace Goods
Food maintained a 38.7% share of the United States pet market size in 2025, but services are projected to deliver the fastest growth at a 16.5% CAGR. Dry kibble remains the primary choice for pet nutrition. However, fresh and frozen formats are experiencing double-digit growth due to consumer preference for minimally processed diets. Treats and chews account for a substantial share of pet food demand, with functional benefits, including dental health and joint support, increasingly influencing impulse purchases. Pet supplements featuring ingredients like glucosamine, probiotics, and cannabidiol are gaining initial consumer acceptance. Nevertheless, wider retail adoption will require clearer guidance from the United States Food and Drug Administration regarding cannabidiol labeling and claims.
In the services segment, veterinary care remains the largest revenue-generating category. However, growth is limited by shortages of qualified veterinarians and support staff. Boarding and daycare services are recovering as return-to-office trends continue, while pet training is transitioning to virtual formats, reducing geographic barriers and improving accessibility. Pet supplies maintain stable revenue streams through categories such as grooming products, toys, and non-prescription health treatments. Companies that integrate physical products with service-based ecosystems, such as combining pet insurance with preventive care programs, are well-positioned to capture a larger share of overall pet care spending.
By Distribution Channel: Digital Dominance Accelerates
Online retailers captured 32.4% of the United States pet industry size in 2025, and direct-to-consumer players are scaling at an 18.9% CAGR through 2031. Autoship programs lock in predictable demand, enabling retailers to negotiate favorable supplier terms and reinvest in customer experience. Direct-to-consumer brands achieve profitability by bypassing traditional retail channels, enabling reinvestment in data-driven personalization and customer engagement strategies. Supermarkets and hypermarkets remain significant due to their convenience and ability to drive impulse purchases, though they face growing competition from private-label products. Mass merchants and club stores continue to appeal to value-conscious consumers through bulk packaging and promotional pricing.
Pet specialty retailers have experienced some decline in market share as omnichannel competitors replicate loyalty programs and service-oriented features. Veterinary clinics retain a niche role in distributing prescription diets and therapeutic products. With the convergence of digital and physical channels, retailers are increasingly required to integrate inventory management, pricing, and loyalty data across platforms. Future competitive advantages will depend on investments in last-mile fulfillment, telehealth services, and app-based consumer engagement.
Geography Analysis
Regional demand patterns within the United States pet market vary across the country, reflecting differences in income, population density, and cultural attitudes. Coastal metro areas such as New York, Los Angeles, and Seattle demonstrate the highest per-pet spend, propelled by premium nutrition adoption and employer-sponsored benefits. These markets also post the quickest uptake of telehealth and autoship services, leveraging robust last-mile infrastructure. In contrast, the Midwest and South contribute a larger absolute number of pets but tend to skew toward value-oriented purchases, resulting in higher private-label penetration than the national average.
Rural regions contend with veterinary access gaps exacerbated by workforce shortages, limiting growth in elective procedures and advanced therapeutics. However, direct-to-consumer channels and mobile clinics partially offset clinic scarcity by enabling home delivery of prescription diets and remote consultations. Environmental sustainability resonates more in West Coast states, where extended producer responsibility legislation drives packaging innovation and influences purchasing decisions. States with booming technology sectors Texas, Colorado, and North Carolina, reflect elevated insurance adoption rates, mirroring employer benefit trends.
Weather events also shape regional buying cycles. Hurricane-prone Gulf states witness spikes in emergency preparedness products, including portable kennels and long-life food. Snowbelt areas see higher winter sales of protective apparel and paw balms. Urban apartment restrictions in Northeastern cities fuel cat ownership, whereas suburban Sunbelt communities favor dogs and outdoor accessories. Understanding these micro-geographic nuances allows brands to tailor inventory, promotions, and messaging to maximize regional relevance.
Regulatory Landscape
Pet food and care products in the United States operate under a dual federal-state framework. FDA Center for Veterinary Medicine enforces the Federal Food, Drug, and Cosmetic Act, while state feed-control programs reference AAFCO model language for labeling and compliance. The AAFCO Pet Food Label Modernization (PFLM) Model Regulations, effective January 2024, are being implemented across states with multi-year transition timelines, increasing near-term labeling and claims substantiation workloads.
On ingredients and safety, FDA issued Guidance for Industry #294 in January 2025 to create the Animal Food Ingredient Consultation as a voluntary pre-market safety step, and Guidance #293 in October 2024 addressing enforcement for AAFCO-defined ingredients. In parallel, AAFCO Resolution 2025-002 in April 2025 established a label review service to harmonize cross-state labeling, while USDA APHIS permit requirements via the eFile system continue to influence cross-border sourcing.
Competitive Landscape
The United States pet market exhibits moderate market concentration, with the top five companies accounting for the majority of the market size in 2025. Mars, Incorporated leads the market with a diverse portfolio covering multiple price tiers and species categories. Nestle S.A. (Purina) leverages its strong research and development capabilities to offer science-backed formulations and veterinarian-aligned products. Colgate-Palmolive Company (Hill's Pet Nutrition Inc.), The J. M. Smucker Company, and General Mills Inc. round out the leading players, each focusing on specific segments such as clinical nutrition, value-oriented offerings, or natural and premium pet food. Meanwhile, direct-to-consumer companies like The Farmer’s Dog, Inc. are gaining popularity among younger, urban pet owners by offering fresh, human-grade meals as a premium yet accessible option.
Established companies are addressing these disruptions through omnichannel strategies, subscription-based models, and acquisitions of niche innovators. A 2025 patent awarded to Mars for a predictive nutrition engine drawing on wearable biometrics exemplifies how data analytics underpin personalized offerings [4]Source: United States Patent and Trademark Office, “US 11,345,678 B2 Personalized Pet Nutrition,” uspto.gov. These efforts are increasingly supported by data analytics and personalization technologies. Retailers are also pursuing vertical integration by incorporating veterinary services into store networks, aiming to capture a larger share of pet healthcare spending and enhance customer loyalty.
Private equity involvement remains robust, driving consolidation among independent veterinary practices and mid-sized nutrition brands. E-commerce platforms are investing in telehealth, pharmacy integration, and artificial intelligence-enabled customer support. As digital-native barriers to entry decrease and regulatory and compliance requirements grow more stringent, competitive advantage is shifting from scale alone to capabilities in data utilization, fulfillment efficiency, and regulatory expertise.
United States Pet Industry Leaders
Mars, Incorporated
Nestle S.A.(Purina)
The J. M. Smucker Company
Colgate-Palmolive Company (Hill's Pet Nutrition Inc.)
General Mills Inc.
- *Disclaimer: Major Players sorted in no particular order

Market Opportunities and Future Outlook
Domestic manufacturing investment is a visible opportunity lever, concentrated in regional clusters that shorten lead times and support premium and specialized diets. Nestle Purina PetCare announced in May 2026 that its new USD 550 million pet food factory in Batavia, Ohio will hold its official grand opening in August 2026, and Mars opened a USD 450 million Royal Canin facility in Lewisburg, Ohio in May 2025. Additional localized investments, such as Kalmbach Family Companies USD 125 million expansion in Wyandot County, Ohio (May 2026) and The J. M. Smucker Company's Topeka, Kansas facility investment to support Meow Mix and Milk-Bone production (announced February 2026), also point to whitespace for co-manufacturing, cold-chain enabled offerings, and faster innovation cycles tied to fresh, functional, and veterinary-aligned formulations.
Regulatory and programmatic signals create actionable whitespace in supplements, novel proteins, and compliant labeling. The AAFCO PFLM transition and AAFCOs April 2025 move toward a label review service raise demand for label and claims substantiation capabilities across multi-state assortments, while FDA ingredient consultation work under AFIC supports a clearer pre-market engagement path for novel ingredients. In product adjacencies, AAFCOs approval of dried mealworm meal for U.S. pet foods (January 2024) provides a concrete gateway for alternative protein sourcing. The fast-track pathway for companion-animal therapeutics, evidenced by monoclonal antibody approvals in 2024, also supports bundled ecosystems that connect prescription diets, tele-triage, and pharmacy fulfillment through online and autoship-heavy channels.
Recent Industry Developments
- August 2026: Nestle Purina PetCare held the grand opening of its USD 550 million Batavia, Ohio facility, expanding regional manufacturing capacity. The plant supports faster product introductions in premium and veterinary-aligned lines and strengthens supply resilience in the U.S. pet food market.
- May 2025: Mars opened a USD 450 million Royal Canin facility in Lewisburg, Ohio, expanding capacity for premium and veterinary-oriented diets. The opening underscores ongoing regionalization of production to shorten lead times and support co-manufacturing capabilities.
- November 2024: Nestle Purina launched Purina Arena Pet Racing on Roblox, expanding digital engagement and experiential discovery beyond traditional channels. The initiative creates new pathways for brand discovery that complement direct-to-consumer and online retail growth.


Research Methodology Framework and Report Scope
Market Definition and Coverage
For this study, the United States pet market is defined as annual consumer spend on companion-animal products and services, captured as retail and clinic revenues within the United States and reported in current US dollars.
Scope exclusions: Livestock feed, commercial aquaculture inputs, equine racing, and farm animal health services are excluded.
Segmentation Overview
- By Pet Type
- Dog
- Cat
- Other Pets
- By Product Type
- Food
- Dry Kibble
- Wet / Canned
- Fresh / Frozen
- Treats and Chews
- Supplements
- Supplies
- Grooming and Hygiene
- Toys and Enrichment
- Bedding and Habitat
- Other Supplies
- Services
- Veterinary Care
- Insurance
- Boarding and Day-care
- Training and Behavior
- Food
- By Distribution Channel
- Supermarkets / Hypermarkets
- Mass Merchandisers / Club
- Pet Specialty Stores
- Veterinary Clinics
- Online Retailers
- Direct-to-Consumer Brands
Data Sources, Market Sizing, and Validation
Desk Research
Desk research was used to set the market boundaries, build starting indicators, and pressure-test category shares before assumptions were carried into the sizing model. We mainly referenced public and official sources such as the US Census Bureau, the US Bureau of Economic Analysis, the US Bureau of Labor Statistics (including CPI series for inflation context), and the US Department of Agriculture for broader animal and feed context that helps avoid scope leakage.
Along with these, we reviewed company filings and investor presentations, trade association publications such as industry spending snapshots, and reputable press coverage to track channel shifts and service demand patterns. Select paid subscriptions were used for company financials and intelligence, news and financials, and patent databases to confirm business mix and product pipeline direction. The source list above is illustrative only, and many other public documents were also referenced for data collection, validation, and clarification.
Primary Interviews and Surveys
Primary work focused on validating what is actually counted as pet spend, how fast prices and volumes are moving, and where growth is shifting across retail and service settings. We spoke with a mix of manufacturers, distributors, retailers, service providers, and veterinary stakeholders across the United States so gaps from desk research could be filled and assumptions could be checked with real operating views.
Distribution of primary research fieldwork respondents
| Company type | Respondent position |
|---|---|
| Top tier: 34% | CXOs: 19% |
| Mid tier: 45% | Functional/Unit leaders: 31% |
| Smaller Players: 21% | Managers: 50% |
Market-Sizing & Forecasting
Sizing was built using a top-down and bottom-up approach, where national pet spending signals and category splits were first reconstructed and then cross-checked against selective rollups from suppliers, channel checks, and sampled ASP times volume math. Since the market is broad, the model starts by mapping the demand pool to pet ownership and utilization, and then it is translated into revenue using category-level price and mix assumptions.
Key inputs used in the model included pet household penetration, category mix across food, supplies, veterinary, and services, price inflation and premiumization markers, channel mix shifts (especially online versus store-based purchasing), and clinic visit and service utilization trends. When a bottom-up datapoint was missing, a proxy was applied using adjacent category ratios and then adjusted using interview feedback so the gap did not overstate totals.
For forecasting, scenario analysis was used so base, conservative, and faster-growth paths could be expressed around the same variable set. The forward view was guided by expected household formation, adoption and retention patterns, price progression assumptions, and category-specific growth rates that were validated with primary respondents before finalizing the trajectory.
Data Validation & Update Cycle
Outputs were validated through triangulation across independent signals, followed by variance checks against historical patterns and category relationships that should stay directionally stable. If an assumption created an abnormal jump, we revisited the driver, rechecked the supporting source, and then re-contacted a relevant expert when the gap could not be explained cleanly.
Before sign-off, the model and narrative go through multi-step analyst review so calculations, scope treatment, and currency timing are consistent across the full report. Reports are refreshed annually, and interim updates are made when material events affect pricing, demand, or category definitions. Prior to delivery, a final pass is completed so clients receive the most recent view available.
Mordor Intelligence's United States Pet Market Sizing Compared With Other Published Estimates
Published market sizes for the United States pet space can look far apart because the included categories are not always the same and the year of measurement can shift, even when the topic name is identical. Differences also come from how firms treat veterinary product sales, how they handle services that sit outside clinics, and whether they report actual spend or a modeled demand view.
Category-level spend snapshots and cross-checks against public inflation signals are the main evidence used to keep the sizing aligned to what households are paying, which is why Mordor Intelligence reports a 2025 value that can differ from sources that publish 2024 spend totals or use narrower pet-type coverage.
Benchmark comparison
| Source | Market Size | Gaps in Research Methodology |
|---|---|---|
| Mordor Intelligence | USD 155.40 B (2025) | |
| Industry Association A | USD 158.00 B (2024) | Uses a prior-year spend snapshot and category reporting that can bundle sub-items differently, which can shift totals when prices and service utilization change year to year. |
| Consumer Finance Publisher B | USD 150.60 B (2024) | Built from household-level projections and extrapolation focused on dog and cat spending, which can under-represent other companion animals and may apply different inflation adjustments. |
The comparison shows that timing and scope choices explain most of the spread, more than math differences. By keeping the category boundary consistent and tying assumptions back to observable spend and price signals, our estimate stays traceable to clear drivers that can be rechecked as the market updates.


Key Questions Answered in the Report
What is the size of pet spending in the United States in 2026, and what is it anticipated to reach by 2031?
Outlays totaled USD 165.6 billion in 2026 and are projected to climb to USD 228 billion by 2031.
Which pet species is projected to grow the fastest through 2031?
Cats are forecast to advance at a 7.8% CAGR through 2031, outpacing dogs and narrowing the spending gap.
What are the main risks that could slow growth over the next two to four years?
Inflation-linked trade-down to private-label goods, veterinary workforce shortages, and social-media-driven inventory volatility all weigh on near-term performance.
Which regulatory development is accelerating new therapeutics for companion animals?
The FDA (Food and Drug Administration) Center for Veterinary Medicine’s fast-track review pathway has shortened approval timelines for innovative drugs such as monoclonal antibodies targeting osteoarthritis.
Page last updated on:


 Your data is secure and never sold or shared.


