
Dry Chilies Market Size and Share
Dry Chilies Market Analysis by Mordor Intelligence
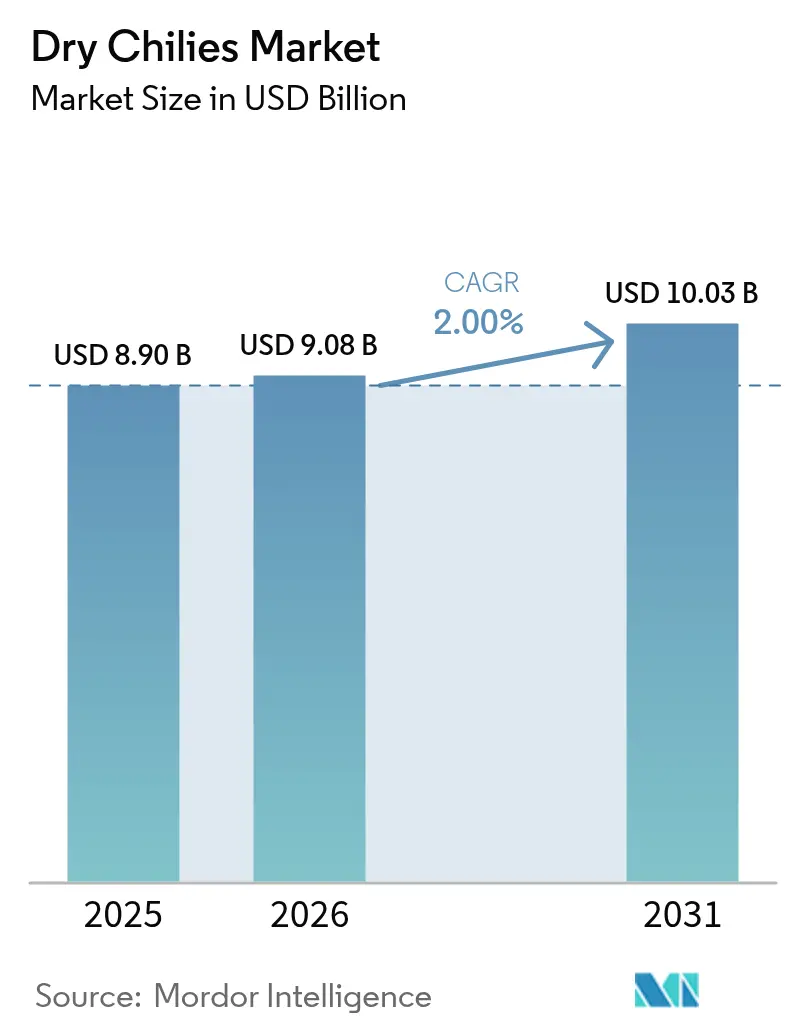
The dry chilies market size was valued at USD 8.90 billion in 2025 and is estimated to grow from USD 9.08 billion in 2026 to reach USD 10.03 billion by 2031, at a CAGR of 2.0% during the forecast period (2026-2031). Rising penetration of hot and ethnic cuisines, clean-label mandates favoring natural colorants, and supply-side gains from hybrid cultivars are boosting demand for food, beverage, and pharmaceutical formulations. India and China dominate global output, yet import-dependent regions such as the European Union and North America sustain robust trade flows, encouraging vertical integration by multinational flavor houses. Hybrid seed adoption and blockchain-enabled traceability mitigate quality risks, but tighter pesticide limits and weather-driven price swings still temper margins for processors and exporters. Competitive intensity remains moderate, with regional processors consolidating and global ingredient companies acquiring capacity to secure raw material pipelines.
Key Report Takeaways
- By geography, Asia-Pacific held 54.7% of the dry chilies market share in 2025 and is forecast to grow at an 8.7% CAGR through 2031.
Note: Market size and forecast figures in this report are generated using Mordor Intelligence’s proprietary estimation framework, updated with the latest available data and insights as of 2026.
Global Dry Chilies Market Trends and Insights
Drivers Impact Analysis*
| Driver | (~) % Impact on CAGR Forecast | Geographic Relevance | Impact Timeline |
|---|---|---|---|
| Surging demand for hot and ethnic cuisines | +1.2% | Global, with concentration in Asia-Pacific, North America, and Europe | Medium term (2-4 years) |
| Expansion of spicy snacks and processed foods | +1.0% | Global, led by North America, Europe, and Asia-Pacific urban centers | Medium term (2-4 years) |
| Growth in cross-border agri-commodity logistics | +0.8% | Global, with early gains in India-China, Turkey-EU, and Mexico-USA corridors | Long term (≥ 4 years) |
| Adoption of high-yield hybrid chili cultivars | +0.9% | Asia-Pacific (India, China, Thailand), South America (Mexico, Brazil) | Long term (≥ 4 years) |
| Rising use of natural red pigments | +0.7% | Global, with North America and Europe driving clean-label mandates | Medium term (2-4 years) |
| Blockchain-enabled traceability premiums | +0.4% | Global, with pilot adoption in India, Turkey, and Mexico export chains | Long term (≥ 4 years) |
| Source: Mordor Intelligence | |||
Surging Demand for Hot and Ethnic Cuisines
Global appetite for Sichuan hotpot, Korean kimchi, Mexican salsas, and similar dishes is expanding household and foodservice use of whole dried chilies, powders, and sauces. China imported 179,000 metric tons of Indian dried chilies in FY 2023-24, a 14% volume rise, while Bangladesh lifted purchases by 67% to 90,570 metric tons, confirming regional spill-over demand[1]Source: Agricultural and Processed Food Products Export Development Authority, “India’s Spices Exports FY 2023-24,” apeda.gov.in. Masan Consumer’s Chin-su chili sauce entry into Japan in 2023 underlined how consumer acceptance in quality-sensitive markets catalyzes wider Asia-Pacific distribution[2]Source: VietnamPlus, “Vietnamese Firms Aim for Stronger Presence on Japanese Market,” vietnamplus.vn. Retail platforms in Europe are reporting 30-40% year-on-year growth in chili-based condiments, and streaming recipe content is accelerating at-home experimentation. Foodservice chains in the United States report menu penetration of spicy builds surpassing 78%, spurring ingredient off-take from bulk traders.
Expansion of Spicy Snacks and Processed Foods
Snack producers increasingly replace synthetic heat agents with capsicum oleoresin standardized for 66-69% capsaicin to secure label transparency. The European Union absorbed dried-chili imports, growing as ethnic snacks and spice-infused convenience meals proliferated. Ajinomoto’s February 2025 sourcing pact with Indian suppliers locks in long-term supply for capsicum derivatives. North American brands launched 185 new hot-flavored snack Stock Keeping Units (SKUs) in 2025, up from 2024, illustrating momentum. Standardized oleoresin yields of 90-120 grams per kilogram of dried pods underpin cost efficiency. Collective manufacturer adoption translates to a lift in the dry chilies market CAGR.
Growth in Cross-Border Agri-Commodity Logistics
Logistics infrastructure improvements and digitization are compressing lead times and reducing spoilage, unlocking new trade corridors for dried chilies. Turkey invested in mechanized harvesting and cold-chain hubs in Gaziantep, Kahramanmaraş, and Şanlıurfa, enabling paprika export in 2025. Mexico-United States corridor efficiencies under the United States–Mexico–Canada Agreement (USMCA) cut customs dwell time by 28 hours. These improvements reduce spoilage, expand trade windows, and are projected to lift the dry chilies market.
Adoption of High-Yield Hybrid Chili Cultivars
Heterosis-bred hybrids in India deliver up to 130 quintals per hectare, against 80-90 quintals for open-pollinated lines, narrowing the area constraint in land-scarce districts. Telangana’s 1,813 kilograms per acre productivity for 2024-25 ranks second nationally. Mexico’s decline from 1,539,400 metric tons (2007-2009 average) to 678,800 metric tons in 2022-23 exposes underinvestment in improved genetics[3]Source: USDA Economic Research Service, “Mexico Chile Production and United States Imports,” ers.usda.gov. Marker-assisted selection of Pun1 and MYB31 alleles accelerates hybrid release, while government subsidies cover up to 40% of certified-seed costs in China. Yield stability lifts farmer incomes and ensures a steadier supply to the dry chilies market.
Restraints Impact Analysis*
| Restraint | (~) % Impact on CAGR Forecast | Geographic Relevance | Impact Timeline |
|---|---|---|---|
| Price volatility from weather-driven cycles | -0.6% | Global, with acute exposure in India, Mexico, Turkey, and Spain | Short term (≤ 2 years) |
| Crop losses from pest and disease outbreaks | -0.5% | Asia-Pacific (India, China, Thailand), North America (Mexico, Brazil) | Medium term (2-4 years) |
| Tighter MRL enforcement in key import markets | -0.4% | Global, with primary impact on India-EU, India-USA, and Turkey-EU corridors | Medium term (2-4 years) |
| Substitution by synthetic capsaicinoid extracts | -0.3% | Global, with North America and Europe as early-adoption markets | Long term (≥ 4 years) |
| Source: Mordor Intelligence | |||
Price Volatility from Weather-Driven Cycles
Erratic monsoons in India and drought in Spain squeeze planting windows and inflate prices. Khammam wholesale quotes for January-March 2026 are spread, complicating processor hedging. Spain’s August 2025 rainfall fell to 14.4 millimeters, only 34% of historical norms, cutting Murcia's irrigated acreage. China recorded dried-chili trade prices oscillating between USD 0.63 and USD 2.83 per kilogram in April 2025, underscoring volatility. Such swings erode margins and shave off the dry chilies market.
Crop Losses from Pest and Disease Outbreaks
Thrips, aphids, and fungal pathogens can reduce yield by 50–80% in unmanaged plots. Tamil Nadu field trials show that heat stress can raise mortality to 91% unless integrated pest management (IPM) is implemented. Smallholders often lack access to biocontrol agents, accelerating dependence on broad-spectrum pesticides that increase residue infractions. APEDA (Agricultural and Processed Food Products Export Development Authority) labs cut non-conformities by 50.53% in 2023, but disease pressure still threatens steady farm output. Resulting supply disruptions are estimated to depress the dry chilies market.
*Our forecasts treat driver/restraint impacts as directional, not additive. The impact forecasts reflect baseline growth, mix effects, and variable interactions.
Geography Analysis
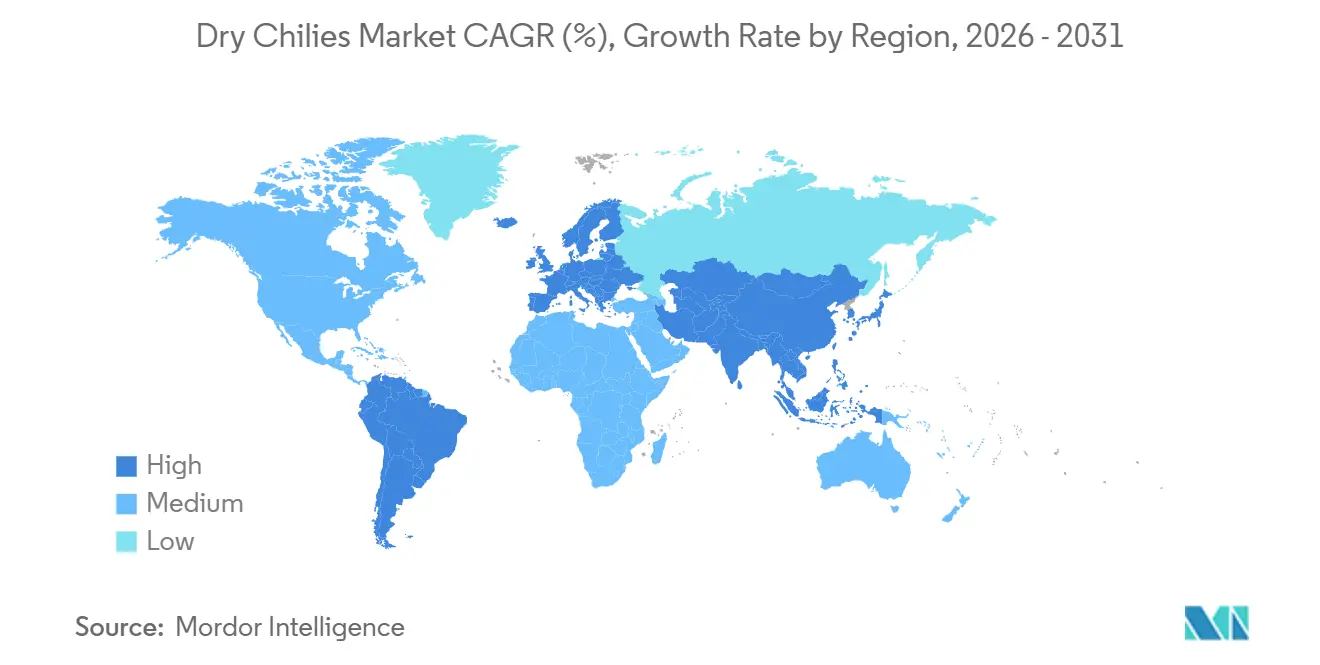
Asia-Pacific accounted for 54.7% of the dry chilies market in 2025 and is forecast to grow at an 8.7% CAGR to 2031. India produced 2.693 million metric tons of dried chilies in 2024-25, with Andhra Pradesh and Telangana together accounting for 63% of the national output. India exported primarily during FY 2023-24, with China and Bangladesh as the leading buyers. China’s 17 million metric tons of fresh chili harvest supports domestic cuisine, yet imports plug seasonal gaps. Thailand, Viet Nam, and Indonesia expand as secondary suppliers, aided by drip irrigation and Halal certifications.
North America and the European Union exhibit consumption growth tied to clean-label regulations. The European Union imported 40% of dried chili volumes during 2021-24. Spain produced pimiento para pimentón in 2025, due to greenhouse adoption. Turkey exported paprika valued at EUR 180 million (USD 195 million) in 2023, making it the largest paprika exporter. The United States imported chili peppers from Mexico in 2022-23 under the United States–Mexico–Canada Agreement. Demand centers on ethnic retail, spice-infused snacks, and industrial formulations that prioritize natural colorants.
South America, the Middle East, and Africa, though smaller, hold strategic significance. The United Arab Emirates re-exports Asian dried chilies to Africa and South Asia, while Viet Nam shipped USD 265 million of spices through Gulf hubs. Algeria, Ghana, and Côte d’Ivoire grow as African import markets. Egypt and South Africa scale domestic cultivation to hedge import bills, yet water scarcity curbs expansion. Brazil and Argentina retain niche production, while Turkey’s southeastern Anatolia remains a bridge between Europe and the Middle East. Together, these regions diversify demand and buffer global price volatility across the dry chilies market.


Regulatory Landscape
Food safety and quality requirements for dried chilies are increasingly anchored to Codex and tightened in key import markets, influencing export eligibility and testing intensity. The Codex Alimentarius Commission amended CXS 353-2022 (Standard for dried or dehydrated chili pepper and paprika) in November 2025 to align with the General Standard for Food Additives (CXS 192-1995), reinforcing additive and specification alignment across jurisdictions. In India, updated Food Safety and Standards (Food Products Standards and Food Additives) requirements took effect on February 1, 2026 under FSSAI, while export-side compliance is also supported by the Spices Board of India network (83 offices and Quality Evaluation Laboratories), which reported a 50.53% reduction in non-conformities in 2023.
China and the United States remain pivotal compliance gatekeepers for traded lots. China published GB/T 15691-2026 (General technical specifications for spices and seasonings) on March 31, 2026, with an effective date of October 1, 2026, replacing GB/T 15691-2008, increasing the need for specification alignment for exporters serving Chinese buyers. In the United States, FDA inspection and compliance guidance for capsicum pods continues to emphasize defects and contamination controls (for example insect or rodent filth and mold risks), while tariff frameworks shifted in late 2025 when certain agricultural products, including specific spice categories, were exempted from reciprocal tariffs under a White House Executive Order, adding trade-policy monitoring alongside residue and phytosanitary checks.
Value Chain Analysis
The dry chilies value chain spans input supply (hybrid seeds, crop protection, irrigation), farm production dominated by smallholders, and post-harvest handling that determines export viability. After harvest, pods move through aggregators and mandi networks, then into primary processing (drying, destemming, grading) and secondary processing (milling, blending, oleoresin extraction), before export and downstream use in packaged foods, sauces, seasoning blends, and industrial natural colorants. Moisture control is a technical checkpoint because export-grade dried chilies are commonly stabilized near 9-12% moisture, and quality grading is increasingly supported by optical sorting and digital traceability in large processing operations.
Value capture and risk concentrate in processing and compliance, where residue, mycotoxin, and contamination failures trigger rejections and costly rework. Testing and certification costs, fragmented logistics, and inconsistent post-harvest practices remain bottlenecks, while infrastructure such as India-focused Spices Parks (for example Edlapadu, Guntur) is positioned for value addition but faces utilization constraints in export-grade lines. Trade-facing frictions can propagate through the chain: in June 2026, the Chillies Exporters Association India sought intervention from the Spices Board of India over consignment rejections, delayed Chinese registrations, and suspension of three major exporters by Chinas General Administration of Customs, highlighting how importer-side controls can shift procurement toward residue-controlled lots and tighter processor-farmer linkage models.
Competitive Landscape
India's Spices Board manages 83 offices and Quality Evaluation Laboratories, reducing non-conformities by 50.53% in 2023, thereby strengthening export reliability in the dry chillies market, which remains a significant segment of the global spice trade. Key developments in this market include Sensient Natural Ingredients' planned plant acquisition in January 2025, Olam Food Ingredients' facility purchase scheduled for December 2024, and McCormick's capacity expansion in Rajasthan set for September 2024, highlighting multinational efforts to enhance upstream integration. Additionally, Kerry Group invested USD 12 million in Jalisco, Mexico, to serve North American buyers, capitalizing on its proximity and the benefits of the United States–Mexico–Canada Agreement.
In the dry chillies market, natural-color producers such as Kalsec, Symrise, and Givaudan expanded their extraction capacities during 2024-2025 to capitalize on the growing demand for clean-label products. ADM implemented artificial intelligence-based quality grading and IoT-enabled cold-chain monitoring systems in Illinois, which reduced recall risks and labor costs while ensuring product quality. Regional cooperatives in India and Turkey leveraged digital platforms to bypass traditional traders, thereby increasing farm-gate prices and reducing intermediary margins, particularly in the dry chilli supply chain. Compliance capabilities have become a key differentiator in this market, as the European Food Safety Authority (EFSA) and the Food and Drug Administration (FDA) intensify residue audits to ensure product safety. Additionally, blockchain traceability, hot water immersion treatment, and ISO certification are emerging as competitive advantages, enabling certified suppliers in the dry chillies market to secure 10-15% price premiums in high-value markets.
Industry 4.0 technologies strengthen scale advantages, automated grinding reduces volatile loss and optical-sorting ejects contaminant fractions. While synthetic capsaicinoids pose long-term substitution risk, natural extracts retain clout in food and cosmetics. Multinationals hedge exposure by pursuing both natural and synthetic R&D pipelines. Market entry barriers, including compliance capital and hybrid seed access, are rising, reinforcing consolidation trends across the dry chilies market.
Market Opportunities and Future Outlook
Compliance-led value addition appears as a clearer whitespace, as buyers in the European Union, the United States, and China increasingly differentiate suppliers by residue control, traceability, and validated post-harvest processing rather than commodity volume alone. Programs and enforcement actions are driving investment toward standardized drying and microbial reduction steps, and toward lab-aligned supply bases: in June 2026, the Spices Board of Indias Guntur regional office increased post-harvest quality improvement programs after export shipment rejections by China tied to pesticide-residue concerns. This environment supports exporters and processors that can contract residue-managed production, run consistent sorting and grading, and maintain documentation that can withstand intensified audits.
Technology upgrades in drying and processing also offer a tangible pathway to improved shelf stability and color and pungency consistency for powders, blends, and extracts. Recent food-science evidence points to improved quality retention from advanced approaches such as vacuum drying with pre-treatments compared with conventional hot-air drying, reinforcing the case for processors to invest in upgraded dehydration and handling. In parallel, new dehydration capacity deployment outside traditional hubs expands competitive supply: in April 2026, EnWave signed an exclusive commercial license agreement with The Dry Hub in Egypt to deploy a 10 kW REV dehydration system with a commitment to purchase additional equipment within 18 months, underscoring how specialty dehydration platforms are being industrialized for ingredient markets that overlap with dried chili and spice applications.
Recent Industry Developments
- April 2026: EnWave Corporation signed an exclusive commercial license agreement with The Dry Hub in Egypt to deploy a 10 kW REV dehydration system, with a requirement to purchase additional equipment within 18 months. The deal strengthens industrial dehydration capacity in a trade-facing region that re-exports food ingredients, supporting higher-throughput, more consistent dried formats relevant to spice and chili supply chains.
- March 2026: Leo Dryfruits & Spices Trading Limited, via its subsidiary Vandu Food Processing Private Limited, entered a 5-year supply agreement with Haldiram Marketing Private Limited that the company described as providing revenue visibility of more than INR 750 crore. A multi-year offtake arrangement of this size incentivizes tighter procurement and quality control across upstream spice sourcing, reinforcing processor-led consolidation dynamics.
- December 2024: Syngenta set up a solar-drying facility in Tamil Nadu, India, enabling more than 500 chilli farmers to dry crops about five times faster than traditional methods. Faster drying reduces post-harvest losses and helps stabilize moisture and quality metrics that influence acceptance in residue- and contamination-sensitive export markets.


Research Methodology Framework and Report Scope
Market Definition and Coverage
This market covers dried chili products traded and consumed as whole pods or processed forms, where demand is tied to food use and ingredient buying across households, foodservice, and manufacturers, and values are expressed in USD.
Scope exclusions: Fresh chilies, fresh capsicum, and on-farm seedling and cultivation services are excluded unless they are sold as dry chili products in commercial trade.
Segmentation Overview
- By Geography
- North America
- United States
- Production Analysis (Area Harvested, Yield, and Production Volume)
- Consumption Analysis (Consumption Value and Volume)
- Import Market Analysis (Import Value, Volume, and Key Supplying Markets)
- Export Market Analysis (Export Value, Volume, and Key Destination Markets)
- Wholesale Price Trend Analysis and Forecast
- Regulatory Framework
- List of Key Players
- Logistics and Infrastructure
- Seasonality Analysis
- Canada
- Production Analysis (Area Harvested, Yield, and Production Volume)
- Consumption Analysis (Consumption Value and Volume)
- Import Market Analysis (Import Value, Volume, and Key Supplying Markets)
- Export Market Analysis (Export Value, Volume, and Key Destination Markets)
- Wholesale Price Trend Analysis and Forecast
- Regulatory Framework
- List of Key Players
- Logistics and Infrastructure
- Seasonality Analysis
- Mexico
- Production Analysis (Area Harvested, Yield, and Production Volume)
- Consumption Analysis (Consumption Value and Volume)
- Import Market Analysis (Import Value, Volume, and Key Supplying Markets)
- Export Market Analysis (Export Value, Volume, and Key Destination Markets)
- Wholesale Price Trend Analysis and Forecast
- Regulatory Framework
- List of Key Players
- Logistics and Infrastructure
- Seasonality Analysis
- United States
- Europe
- United Kingdom
- Production Analysis (Area Harvested, Yield, and Production Volume)
- Consumption Analysis (Consumption Value and Volume)
- Import Market Analysis (Import Value, Volume, and Key Supplying Markets)
- Export Market Analysis (Export Value, Volume, and Key Destination Markets)
- Wholesale Price Trend Analysis and Forecast
- Regulatory Framework
- List of Key Players
- Logistics and Infrastructure
- Seasonality Analysis
- France
- Production Analysis (Area Harvested, Yield, and Production Volume)
- Consumption Analysis (Consumption Value and Volume)
- Import Market Analysis (Import Value, Volume, and Key Supplying Markets)
- Export Market Analysis (Export Value, Volume, and Key Destination Markets)
- Wholesale Price Trend Analysis and Forecast
- Regulatory Framework
- List of Key Players
- Logistics and Infrastructure
- Seasonality Analysis
- Germany
- Production Analysis (Area Harvested, Yield, and Production Volume)
- Consumption Analysis (Consumption Value and Volume)
- Import Market Analysis (Import Value, Volume, and Key Supplying Markets)
- Export Market Analysis (Export Value, Volume, and Key Destination Markets)
- Wholesale Price Trend Analysis and Forecast
- Regulatory Framework
- List of Key Players
- Logistics and Infrastructure
- Seasonality Analysis
- Spain
- Production Analysis (Area Harvested, Yield, and Production Volume)
- Consumption Analysis (Consumption Value and Volume)
- Import Market Analysis (Import Value, Volume, and Key Supplying Markets)
- Export Market Analysis (Export Value, Volume, and Key Destination Markets)
- Wholesale Price Trend Analysis and Forecast
- Regulatory Framework
- List of Key Players
- Logistics and Infrastructure
- Seasonality Analysis
- United Kingdom
- Asia-Pacific
- China
- Production Analysis (Area Harvested, Yield, and Production Volume)
- Consumption Analysis (Consumption Value and Volume)
- Import Market Analysis (Import Value, Volume, and Key Supplying Markets)
- Export Market Analysis (Export Value, Volume, and Key Destination Markets)
- Wholesale Price Trend Analysis and Forecast
- Regulatory Framework
- List of Key Players
- Logistics and Infrastructure
- Seasonality Analysis
- India
- Production Analysis (Area Harvested, Yield, and Production Volume)
- Consumption Analysis (Consumption Value and Volume)
- Import Market Analysis (Import Value, Volume, and Key Supplying Markets)
- Export Market Analysis (Export Value, Volume, and Key Destination Markets)
- Wholesale Price Trend Analysis and Forecast
- Regulatory Framework
- List of Key Players
- Logistics and Infrastructure
- Seasonality Analysis
- Australia
- Production Analysis (Area Harvested, Yield, and Production Volume)
- Consumption Analysis (Consumption Value and Volume)
- Import Market Analysis (Import Value, Volume, and Key Supplying Markets)
- Export Market Analysis (Export Value, Volume, and Key Destination Markets)
- Wholesale Price Trend Analysis and Forecast
- Regulatory Framework
- List of Key Players
- Logistics and Infrastructure
- Seasonality Analysis
- China
- South America
- Brazil
- Production Analysis (Area Harvested, Yield, and Production Volume)
- Consumption Analysis (Consumption Value and Volume)
- Import Market Analysis (Import Value, Volume, and Key Supplying Markets)
- Export Market Analysis (Export Value, Volume, and Key Destination Markets)
- Wholesale Price Trend Analysis and Forecast
- Regulatory Framework
- List of Key Players
- Logistics and Infrastructure
- Seasonality Analysis
- Argentina
- Production Analysis (Area Harvested, Yield, and Production Volume)
- Consumption Analysis (Consumption Value and Volume)
- Import Market Analysis (Import Value, Volume, and Key Supplying Markets)
- Export Market Analysis (Export Value, Volume, and Key Destination Markets)
- Wholesale Price Trend Analysis and Forecast
- Regulatory Framework
- List of Key Players
- Logistics and Infrastructure
- Seasonality Analysis
- Brazil
- Middle East
- United Arab Emirates
- Production Analysis (Area Harvested, Yield, and Production Volume)
- Consumption Analysis (Consumption Value and Volume)
- Import Market Analysis (Import Value, Volume, and Key Supplying Markets)
- Export Market Analysis (Export Value, Volume, and Key Destination Markets)
- Wholesale Price Trend Analysis and Forecast
- Regulatory Framework
- List of Key Players
- Logistics and Infrastructure
- Seasonality Analysis
- Turkey
- Production Analysis (Area Harvested, Yield, and Production Volume)
- Consumption Analysis (Consumption Value and Volume)
- Import Market Analysis (Import Value, Volume, and Key Supplying Markets)
- Export Market Analysis (Export Value, Volume, and Key Destination Markets)
- Wholesale Price Trend Analysis and Forecast
- Regulatory Framework
- List of Key Players
- Logistics and Infrastructure
- Seasonality Analysis
- United Arab Emirates
- Africa
- South Africa
- Production Analysis (Area Harvested, Yield, and Production Volume)
- Consumption Analysis (Consumption Value and Volume)
- Import Market Analysis (Import Value, Volume, and Key Supplying Markets)
- Export Market Analysis (Export Value, Volume, and Key Destination Markets)
- Wholesale Price Trend Analysis and Forecast
- Regulatory Framework
- List of Key Players
- Logistics and Infrastructure
- Seasonality Analysis
- Egypt
- Production Analysis (Area Harvested, Yield, and Production Volume)
- Consumption Analysis (Consumption Value and Volume)
- Import Market Analysis (Import Value, Volume, and Key Supplying Markets)
- Export Market Analysis (Export Value, Volume, and Key Destination Markets)
- Wholesale Price Trend Analysis and Forecast
- Regulatory Framework
- List of Key Players
- Logistics and Infrastructure
- Seasonality Analysis
- South Africa
- North America
Data Sources, Market Sizing, and Validation
Desk Research
Desk research was used to set the factual frame for global dry chili supply and trade, before any assumptions were added. We relied on public sources such as FAOSTAT for production, UN Comtrade for import and export flows, USDA and national agriculture ministries for crop and area signals, and trade bodies and standards references for product definitions and grades.
Price and demand context were then cross-checked using wholesale and commodity market publications, customs and port statistics where available, and company filings and investor materials for packaged spice and ingredient demand cues. Where it helped to sanity check volumes and trade consistency, a paid subscription focused on shipment-level import and export records and a general company financials database were used selectively. These are illustrative sources only, and many other public documents were reviewed for collection, validation, and clarification.
Primary Interviews and Surveys
Primary interviews and short surveys were used to validate conversion assumptions from volume to value, and to pressure-test price and mix shifts by region. We spoke with stakeholders across farming and aggregation, trading and exporting, processing and grinding, and downstream buying teams, with coverage balanced across APAC, EMEA, and the Americas so regional crop and trade realities were captured in the same way the model treats unit values.
Distribution of primary research fieldwork respondents
| Company type | Respondent position | Region |
|---|---|---|
| Top tier: 39% | CXOs: 17% | APAC: 43% |
| Mid tier: 44% | Functional/Unit leaders: 32% | EMEA: 36% |
| Smaller Players: 17% | Managers: 51% | Americas: 21% |
Market-Sizing & Forecasting
Sizing starts with a top-down build where production, trade, and consumption signals are reconciled by region, then translated into value using observed wholesale price movements and mix by form (whole, crushed, powder) as practical anchors. To keep the totals realistic, selective bottom-up checks were run using sampled exporter and processor throughput discussions, channel checks on pack sizes and pricing, and simple volume times ASP calculations for a few high-trade corridors.
Key inputs used in the model include harvested area and yield direction, export and import volumes and unit values, domestic consumption pull in major producing countries, and the spread between wholesale and export pricing through the year, which helps prevent overstating value when prices spike temporarily. For forecasting, we used scenario analysis supported by trend lines on production variability and trade redirection, followed by expert-led adjustments for expected price normalization, quality grades, and policy effects on pesticide compliance. When bottom-up references were missing in smaller markets, gaps were handled by applying region-specific price bands and form-mix shares validated through interviews, rather than copying global averages blindly.
Data Validation & Update Cycle
Validation is done through triangulation across trade volumes, production direction, and price series so the final value does not move without a clear driver. We run variance checks year over year, review anomalies at country and corridor level, and re-contact experts when a change looks too large to be explained by weather, yields, or a known policy shift.
Each report is refreshed annually, and interim updates are triggered when material events occur such as sharp crop shortfalls, major trade restrictions, or sustained currency moves in key producing countries. Before delivery, one last pass is completed to recheck the latest trade and price indicators so the client receives an updated view, not an older snapshot.
Mordor Intelligence's Dry Chilies Market Sizing Compared With Other Published Estimates
Published market sizes for dry chilies often look different because the year used, price basis, and even the product boundary can change from one study to another. In practice, the biggest gaps usually come from how volume is converted to value, how currency timing is handled across producing and importing countries, and how often the model is refreshed.
A refresh-led gap shows up quickly in this market because seasonal harvest patterns and short-term price spikes can inflate annual value if the average selling price is not normalized with trade unit values and wholesale checks. By updating FX timing assumptions around the same calendar points used for trade statistics, and revalidating the ASP logic with recent corridor-level unit values, Mordor Intelligence reduces the risk of counting temporary inflation as structural market growth.
Benchmark comparison
| Source | Market Size | Gaps in Research Methodology |
|---|---|---|
| Mordor Intelligence | USD 8.90 B (2025) | |
| Global Publisher A | USD 6.53 B (2025) | This estimate appears to apply a broader end-use lens across food, cosmetics, and pharmaceutical applications, but it can understate value when trade-led pricing and regional wholesale spreads are not fully reconciled with the annual average ASP used for 2025. |
| Industry Research Desk B | USD 4.51 B (2024) | The scope places more weight on retail and end-user segmentation and uses a 2024 base, which can leave out trade-linked value captured in export and import unit values, and it may reflect a different currency conversion window than a calendar-year trade alignment. |
The spread mainly comes from how each source treats price averaging, currency timing, and whether trade and wholesale checks are used to keep value consistent with observed physical flows. When these choices are made explicit and refreshed on a steady cadence, the resulting market size is easier to reproduce and explain with clear inputs.


Key Questions Answered in the Report
What is the projected value of the dry chilies market by 2031?
The dry chilies market is forecast to reach USD 10.03 billion by 2031.
Which region leads global demand for dried chilies?
Asia-Pacific commands the largest share at 54.7% in 2025 and is the fastest-growing region through 2031.
Why are natural red pigments gaining traction in food formulations?
Regulatory pressure on synthetic dyes and clean-label consumer preferences drive manufacturers to adopt paprika oleoresin and capsanthin extracts derived from dried chilies.
How are blockchain systems impacting the chili supply chain?
Blockchain traceability reduces recall times from days to minutes and secures 10-15% price premiums for batches with verifiable provenance.
Page last updated on:




