
Market Overview
| Study Period | 2020 - 2031 |
|---|---|
| Market Size (2026) | USD 86.36 Billion |
| Market Size (2031) | USD 141.06 Billion |
| Growth Rate (2026 - 2031) | 10.31 % |
| Fastest Growing Market | Africa |
| Largest Market | Asia Pacific |
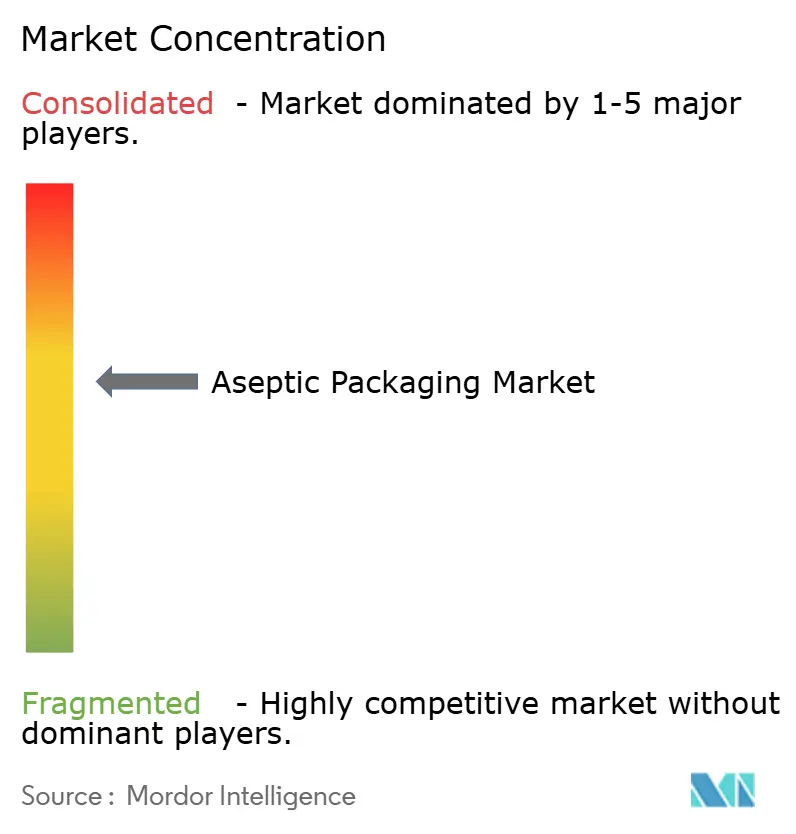
| Market Concentration | Medium |
Major Players *Disclaimer: Major Players sorted in no particular order Image © Mordor Intelligence. Reuse requires attribution under CC BY 4.0. | |
Aseptic Packaging Market Analysis by Mordor Intelligence
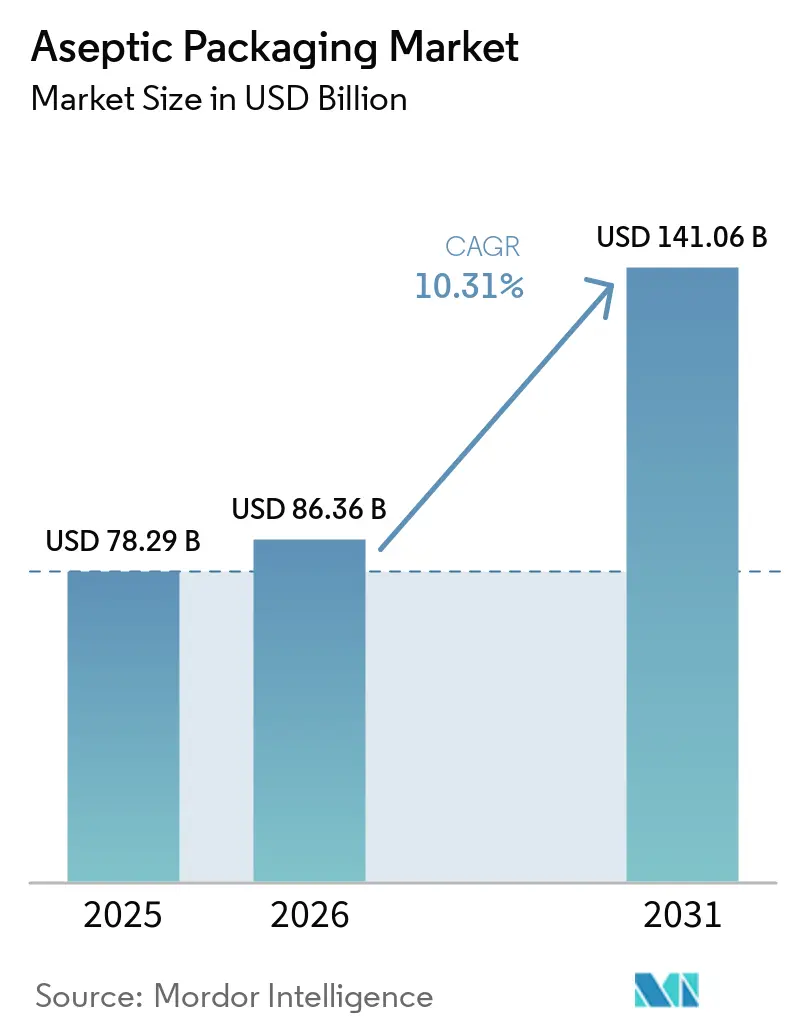
The aseptic packaging market size is expected to grow from USD 78.29 billion in 2025 to USD 86.36 billion in 2026 and is forecast to reach USD 141.06 billion by 2031 at a 10.31% CAGR over 2026-2031. Momentum stems from rising logistics costs that favor ambient-temperature distribution, regulatory moves that reward sterile shelf-stable formats, and investments in digitally printed flexible packs that reduce minimum-order quantities for emerging direct-to-consumer brands. Cartons continued to anchor dairy and juice volumes in 2025, yet bags and pouches are gaining share as their cube efficiency trims freight outlays by 20-30%. Composite laminates are also expanding because fiber-based structures with high-barrier coatings sidestep the recycling complications of aluminum foil. Regionally, Asia Pacific leads in volume, while Africa records the fastest growth as cold-chain energy costs rise. Competitive intensity remains moderate, with the five largest suppliers controlling roughly 45% of revenue and regional converters using short-run flexibility to win local orders.
Key Report Takeaways
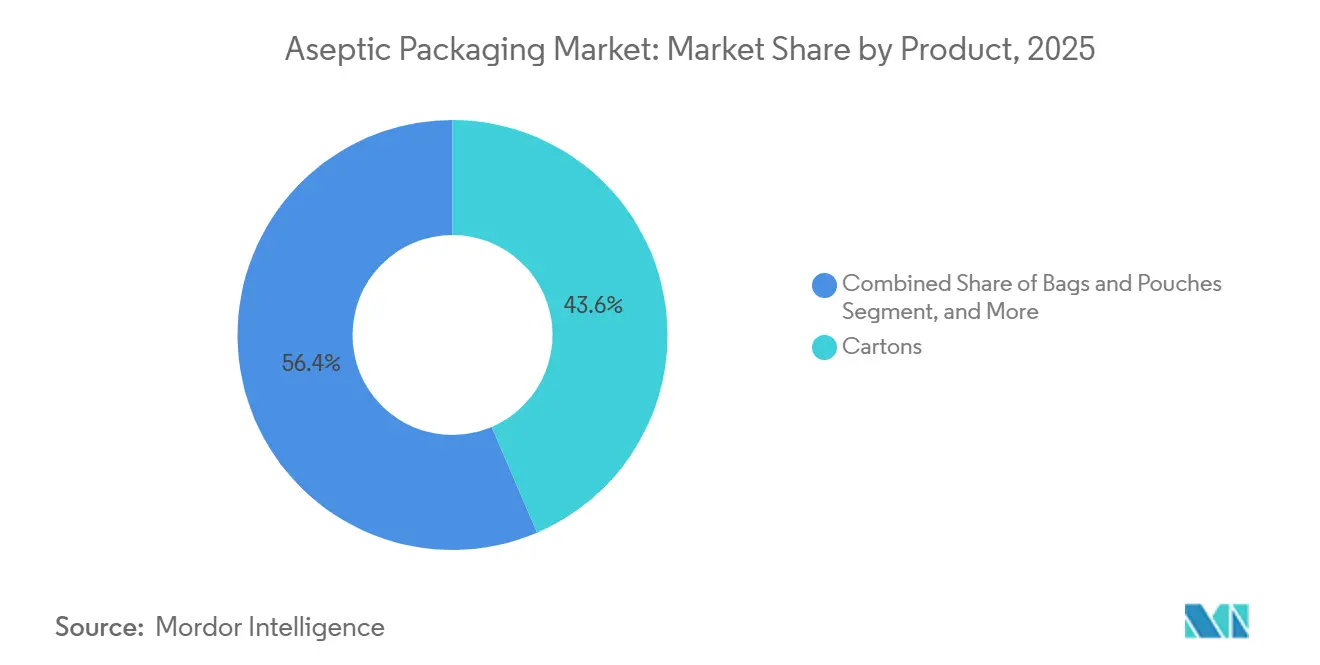
- By product, cartons led with a 43.56% revenue share in 2025, while bags and pouches are forecast to advance at a 11.31% CAGR through 2031.
- By material composition, paper and paperboard held 47.13% of the aseptic packaging market in 2025, whereas composite laminates are projected to grow at an 11.39% CAGR through 2031.
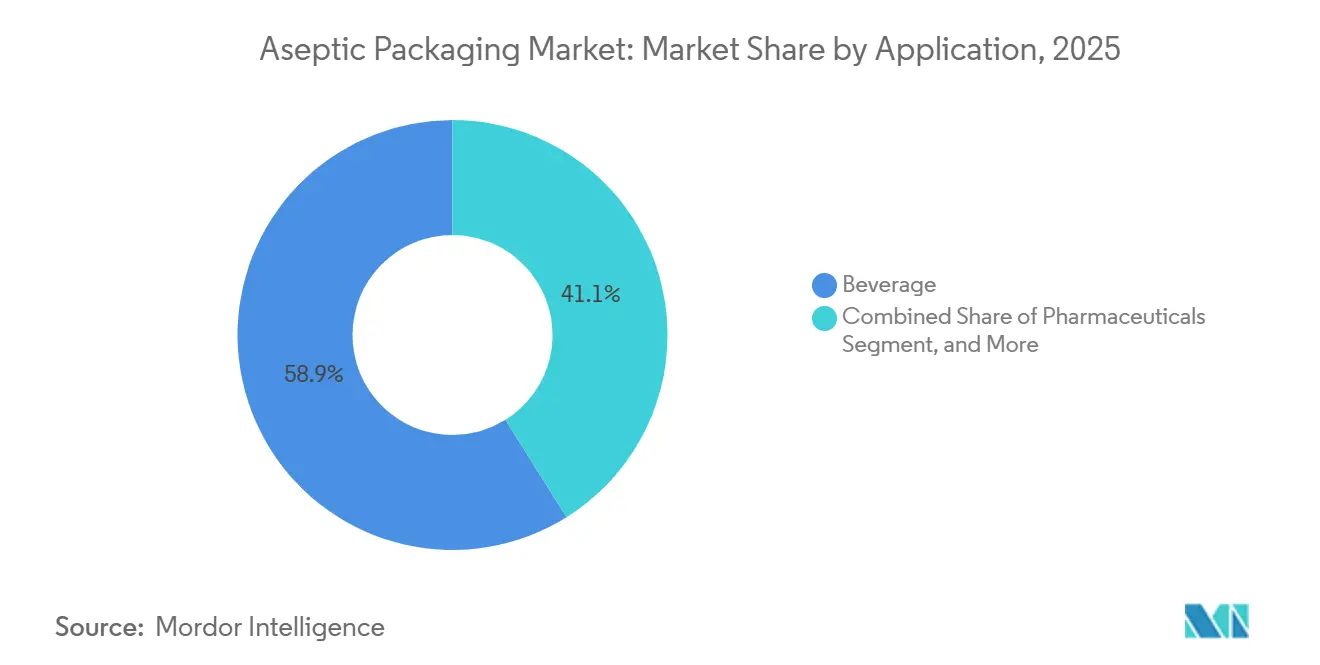
- By application, beverages accounted for 58.89% of the aseptic packaging market share in 2025, and pharmaceuticals are expected to register an 11.13% CAGR between 2026-2031.
- By filling technology, form-fill-seal captured 42.36% revenue in 2025, yet injection systems are on track for an 11.17% CAGR to 2031.
- By geography, Asia Pacific accounted for 35.67% of sales in 2025, while Africa is set to post an 11.34% CAGR through 2031.
Note: Market size and forecast figures in this report are generated using Mordor Intelligence’s proprietary estimation framework, updated with the latest available data and insights as of 2026.
Market Trends and Insights
Drivers Impact Analysis of Aseptic Packaging Market*
| Driver | (~) % Impact on CAGR Forecast | Geographic Relevance | Impact Timeline |
|---|---|---|---|
| Rapid Growth of RTD Functional Beverages | +2.1% | Global, most visible in North America, Europe, Asia Pacific urban centers | Medium term (2-4 years) |
| Expansion of Ambient Dairy Distribution in Emerging Asia | +1.8% | India, Indonesia, Vietnam, spillover to Middle East and Africa | Long term (≥ 4 years) |
| Stringent Food-Safety Regulations Pushing Sterile Packaging Adoption | +1.5% | North America and EU, cascading to Latin America and Middle East | Short term (≤ 2 years) |
| Inflation-Linked Shift from Cold-Chain to Shelf-Stable Logistics | +1.9% | Global, acute in Africa, Latin America, South Asia | Medium term (2-4 years) |
| Shift Toward Sustainable, Lightweight Packaging Mandates | +1.3% | EU, North America, early adopters Japan and South Korea | Long term (≥ 4 years) |
| Rise of Digital-Print-Enabled Short SKUs for D2C Brands | +0.9% | North America and EU, emerging in urban Asia Pacific | Short term (≤ 2 years) |
| Source: Mordor Intelligence | |||
Rapid Growth of RTD Functional Beverages
Ready-to-drink shakes, probiotic drinks, and fortified plant-based milks are switching to ambient cartons and pouches, enabling national distribution without refrigeration and supporting aseptic packaging market growth. Brand examples such as protein beverages in North America cut logistics bills by roughly one-quarter when they moved from cold-chain to aseptic packaging.[1] Capital spending reflects the shift, with functional beverage producers accounting for 40% of new carton-filler installations in 2025. Smaller entrants lean on co-packers that run aseptic pouches in lots of 10,000-25,000 units, accelerating flavor tests and limiting inventory exposure. Consumer willingness to pay premiums for claims linked to immunity, gut health, and recovery underpins the higher material cost of aseptic solutions.
Expansion of Ambient Dairy Distribution in Emerging Asia
Ultra-high-temperature milk and yogurt now reach rural consumers who lack reliable refrigeration. Indian cooperatives increased carton capacity by roughly one-fifth during 2024-2025 to penetrate tier-2 and tier-3 cities. Ambient formats reduce monsoon-season spoilage, stabilize demand, and earn modest price premiums over fresh milk while remaining affordable relative to imported powders. Government tax incentives for aseptic equipment in Indonesia and Vietnam sharpened the investment case, and multinational processors recorded double-digit growth from ambient dairy portfolios.[2]
Stringent Food-Safety Regulations Pushing Sterile Packaging Adoption
The United States Food and Drug Administration updated aseptic processing guidelines in 2024, raising validation requirements for low-acid foods.[3] Europe followed by flagging migration risks in certain adhesive systems. Together, these measures pushed food companies toward aseptic processes that avoid chemical preservatives and achieve commercial sterility through ultra-high-temperature treatment coupled with sterile filling. Large processors absorb compliance costs across high volumes, whereas smaller firms increasingly outsource to aseptic co-packers, supporting aseptic packaging market growth.
Inflation-Linked Shift from Cold-Chain to Shelf-Stable Logistics
Rising diesel and electricity prices since 2024 have widened the cost gap between refrigerated and ambient distribution. Across several Sub-Saharan corridors, refrigerated warehousing can absorb 18-22% of delivered costs, compared with 8-10% for shelf-stable products. Beverage multinationals responded by reformulating juice and dairy lines for aseptic treatment, boosting retail reach by roughly 40% in pilot African markets. A similar pattern appears in emerging pharmaceutical supply chains, where ambient aseptic vials reduce spoilage losses associated with inconsistent refrigeration.
Restraints Impact Analysis of Aseptic Packaging Market*
| Restraint | (~) % Impact on CAGR Forecast | Geographic Relevance | Impact Timeline |
|---|---|---|---|
| Volatility in Multilayer Polymer Prices | -1.4% | Global, sharpest in import-dependent Africa and Latin America | Short term (≤ 2 years) |
| High Initial CAPEX for Aseptic Filling Lines | -1.6% | Africa, Latin America, South Asia | Medium term (2-4 years) |
| Limited Recycling Infrastructure for Aluminum-Foil Laminates | -0.8% | Global, regulatory focus EU and North America | Long term (≥ 4 years) |
| Regulatory Uncertainty Around PFAS Barrier Coatings | -0.7% | North America and EU, potential spillover to Asia Pacific | Medium term (2-4 years) |
| Source: Mordor Intelligence | |||
Volatility in Multilayer Polymer Prices
Swinging polyethylene and polypropylene prices shaved converter margins and forced quarterly price realignments with brand owners. Small converters in Africa and Latin America, lacking hedging options, absorbed the full cost shock, undermining competitiveness against imported pre-made pouches. Forward-looking suppliers are investing in recycled-resin streams to secure feedstock, yet recycled polyethylene currently trades at a noticeable premium over virgin grades, limiting near-term relief.
High Initial CAPEX for Aseptic Filling Lines
Entry-level pouch form-fill-seal systems cost roughly USD 2 million, while high-speed rotary carton fillers climb to USD 15 million. Financing challenges in Sub-Saharan Africa and parts of Latin America raise effective borrowing rates above 12%, concentrating capacity among large cooperatives and multinationals. Smaller brands, therefore, rely on co-packers that charge premiums for short runs, while aging lines in Southeast Asia operate with lower efficiency because upgrades are delayed.
*Our forecasts treat driver/restraint impacts as directional, not additive. The impact forecasts reflect baseline growth, mix effects, and variable interactions.
Aseptic Packaging Market Segment Analysis
By Product:
Pouches Gain on CartonsBags and pouches are projected to deliver an 11.31% CAGR through 2031, the swiftest among aseptic packaging formats, as direct-to-consumer beverage and sauce brands need lightweight packs that suit digital graphics. Cartons retained 43.56% of revenue in 2025, yet their growth rate moderates as retailers reward pouches with 20-30% warehouse cube savings. Bottles continue to serve premium coffees and probiotic drinks that justify higher pack costs, while cans cater to energy cocktails, leveraging metal’s barrier and recyclability.
Cost and branding factors underpin the pouch trajectory. Each flexible pack reduces shipping weight by close to half versus a similar-volume carton, translating to lower freight emissions, an advantage spotlighted by retailers with sustainability scorecards. Digital press advances now permit full-color artwork for runs of fewer than 50,000 pieces, avoiding plate fees that historically handicapped small-batch cartons. Cans and bottles still dominate café or gym channels where resealability and perceived quality matter, yet resealable spouted pouches are narrowing that functional gap, indicating continued share migration toward flexibles in the aseptic packaging market.

By Material Composition:
Composite Laminates Outpace PaperPaper and paperboard accounted for 47.13% of revenue in 2025, reflecting carton dominance in dairy and juice, yet composite laminates are on track for an 11.39% CAGR as converters stack polyethylene and ethylene-vinyl-alcohol layers to achieve foil-barrier performance while meeting recyclability rules. Plastics have broad utility across pouches and bottles, while glass remains niche in ultra-premium cold brews, and metal focuses on energy drinks.
Innovation in laminate structures is reducing reliance on aluminum foil. Amcor’s polyethylene plus silicon oxide laminate achieves sub-0.5 cc oxygen transmission with 20% less weight. The European Union’s 2030 recyclability targets are steering converters toward mono-material solutions, particularly polyethylene. These shifts suggest composite structures will continue to displace foil-lined cartons across the aseptic packaging market, especially in regions with active extended producer responsibility schemes.
By Application:
Pharmaceuticals Surge AheadIn 2025, beverages accounted for 58.89% of total revenue. However, pharmaceuticals are projected to see an 11.13% CAGR through 2031, driven by biologic approvals necessitating sterile, oxygen-free packaging. Meanwhile, as consumers increasingly avoid preservatives, food categories like ambient soups and sauces stand to gain. Personal care, on the other hand, continues to occupy a niche segment.
Blow-fill-seal lines, which mold, fill, and seal single doses without human contact, reduce unit costs by up to 40% compared to traditional vials and stoppers. This cost efficiency is a significant boon for high-volume vaccine production. As a result, the aseptic packaging market for biologics is witnessing rapid growth. In response to this surge, leaders in the glass-vial sector are now incorporating polymer capacities to cater to the rising demand for lightweight and shatterproof formats.
By Filling Technology:
Injection Systems Gain ShareForm-fill-seal maintained a 42.36% share in 2025, but injection filling is projected to post an 11.17% CAGR as premium dairy and pharmaceutical co-packers install modular heads that finish changeovers in under an hour. Blow-fill-seal technology remains the frontrunner in sterile pharmaceutical formats. Meanwhile, in large-scale dairies, rotary systems prove indispensable, with their ability to deliver 20,000 units per hour justifying the steeper initial investment.
Major equipment suppliers have introduced servo-driven models that seamlessly integrate with existing aseptic tunnels, reducing retrofit challenges. These advancements address the issue of viscous yogurts and smoothies clogging continuous web systems. Additionally, predictive-maintenance sensors have been implemented, significantly reducing unplanned downtimes and enhancing overall equipment effectiveness in the aseptic packaging market.
Geography Analysis
APAC Aseptic Packaging Market
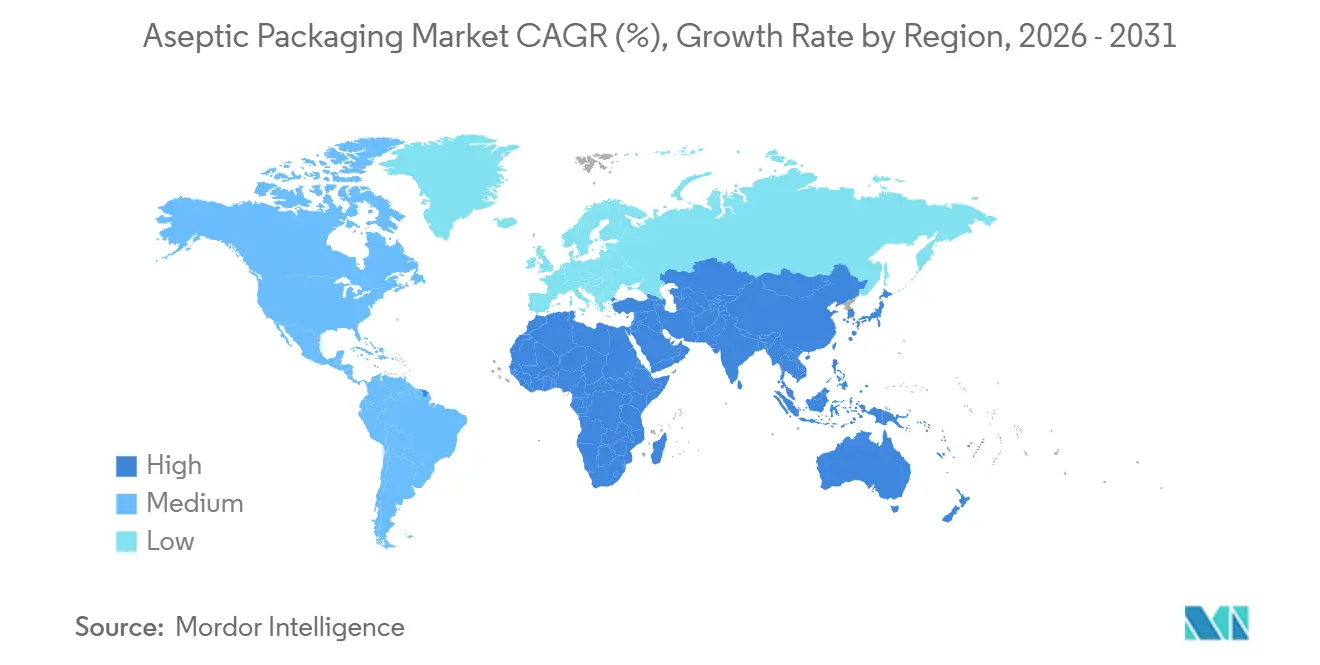
Asia Pacific accounted for 35.67% of global revenue in 2025, led by expanding dairy demand in India and the growth of ready-to-drink tea in China. Ultra-high-temperature milk in India grew at double-digit rates as ambient packs reached tier-2 cities without reliable refrigeration. Japan and South Korea show premium uptakes in single-serve yogurts, while Southeast Asian startups adopt pouches to penetrate rural channels.
Africa Aseptic Packaging Market
From 2026 to 2031, Africa is projected to witness a robust CAGR of 11.34%. In Nigeria, Kenya, and South Africa, soaring diesel and grid-power expenses are rendering cold chain operations economically unfeasible. As a result, dairy cooperatives and juice processors in these nations are shifting their focus towards shelf-stable product formats. While local production of cartons and pouches is still in its infancy, leading to heightened landed-cost pressures, multinational corporations are proactively forging partnerships with regional converters, aiming to bolster local supply chains.
Europe, North America, LATAM and Middle East Aseptic Packaging Market
Europe and North America grow more slowly yet drive sustainability mandates. The EU’s Packaging and Packaging Waste Regulation is accelerating the adoption of mono-material laminates. North America’s growth clusters around functional drinks and sterile biologic fills, while Latin America balances currency volatility against strong demand for ambient dairy. The Middle East offers opportunities in Saudi Arabia and the United Arab Emirates, where high ambient temperatures naturally favor the aseptic packaging market.
Regulatory Landscape
Regulation for aseptic packaging covers both food-safety process control and packaging sustainability requirements. In the United States, aseptic processing and packaging for low-acid foods is governed by FDA requirements under 21 CFR Part 113, including process filing, validation of sterilization parameters, and documentation of packaging integrity, which raises compliance expectations for brand owners and co-packers running aseptic lines.
In the European Union, food-contact compliance continues to be shaped by the EU framework for materials intended to contact food and the related oversight of migration risks, while packaging sustainability requirements are tightening. The EU Packaging and Packaging Waste Regulation (EU) 2025/40 entered into force on 11 February 2025 and applies from 12 August 2026, introducing new obligations around recyclability and other packaging performance requirements, alongside specific exemptions for certain perishable beverages where aseptic technology is integral to safety and shelf life. Commission Regulation (EU) 2024/3190 restricts bisphenol A (BPA) in food-contact materials, with the transition for single-use articles ending on 20 July 2026, increasing scrutiny of multi-material structures, adhesives, and coatings used in aseptic cartons, pouches, and closures.
Value Chain Analysis
The aseptic packaging value chain connects materials supply, conversion, equipment, and sterile filling operations. Upstream inputs include paperboard, polymers (PE, PP, PET), specialty barrier layers such as EVOH, inks and adhesives qualified for food contact, and aluminum foil in some structures, feeding converters that laminate, print (increasingly via digital print for shorter runs), and fabricate cartons, pouches, bottles, and closures. Equipment OEMs provide aseptic filling and sealing systems (FFS, BFS, injection, rotary), along with validation, maintenance, and digital monitoring services, while downstream brand owners and contract packers run UHT/sterilization, sterile filling, secondary packaging, and distribution that benefits from ambient logistics.
The main bottlenecks include long lead times for custom aseptic filling lines and dependence on high-precision imported components. Capacity constraints in food-contact testing and migration labs also slow commercialization of new barrier structures. The chain is becoming more regional through investments in packaging material capacity closer to demand centers, as reflected in 2025 expansions and new plants in India and Vietnam, and through shifts toward alu-layer-free and recycled-content structures that reduce exposure to foil-related recycling constraints. Industry groups, including the Food and Beverage Carton Alliance and packaging-technology associations, function as coordination points for circularity initiatives and technical alignment across converters, equipment suppliers, and brand owners.
Competitive Landscape
Tetra Pak, SIG Combibloc, and Amcor together hold roughly 40-45% of global revenue, combining materials, equipment, and service contracts. Regional converters across China, India, and Brazil, meanwhile, target the aseptic packaging market with cost-effective pouches and small-order flexibility. The new investment includes Tetra Pak’s sensor-enabled seal-integrity technology, filed with the World Intellectual Property Organization.
To secure customer loyalty and boost recurring revenue, multinationals are now bundling digital monitoring subscriptions with their machinery. In response, regional players are catering to craft beverage labels by offering minimum orders ranging from 10,000 to 50,000 units. Meanwhile, pharmaceutical contract packagers are venturing into a lucrative territory, utilizing blow-fill-seal lines to provide unit doses at about one-third the cost of conventional vial assembly.
As supplier differentiation intensifies, sustainability credentials are taking center stage. Elopak has introduced a fiber-based carton featuring a water-based barrier, successfully eliminating foil layers and ensuring complete recyclability within the paper stream. Additionally, Chinese pouch manufacturers, boasting ISO 22000 and FSSC 22000 certifications, have started exporting to Europe at 20-25% discounts, exerting added price pressure on global leaders in the aseptic packaging arena.
Aseptic Packaging Industry Leaders
-
Tetra Pak International SA
-
SIG Combibloc Group
-
Amcor PLC
-
Elopak ASA
-
Greatview Aseptic Packaging
- *Disclaimer: Major Players sorted in no particular order
Aseptic Packaging Market Companies Covered in this Report
- Tetra Pak International SA
- SIG Combibloc Group
- Amcor PLC
- Elopak ASA
- IPI SRL (Coesia Group)
- DS Smith PLC
- Smurfit Kappa Group
- Mondi PLC
- Uflex Limited
- Schott AG
- Gerresheimer AG
- Toyo Seikan Group
- CDF Corporation
- BIBP Sp. z o.o.
- Nampak Ltd
- Greatview Aseptic Packaging
- OPLATEK Group
- Sealed Air Corporation
- ProAmpac Holdings Inc.
Market Opportunities and Future Outlook
A major opportunity is emerging at the intersection of food safety, ambient distribution economics, and materials redesign that improves recyclability outcomes without undermining barrier performance. EU Packaging and Packaging Waste Regulation (EU) 2025/40, applying from 12 August 2026, provides a compliance timetable that rewards converters and brands with qualified mono-material or foil-reduced structures and validated food-contact performance, while preserving aseptic use cases in perishable beverages through stated exemptions where reuse is not practical. In parallel, the 20 July 2026 transition endpoint under Commission Regulation (EU) 2024/3190 on BPA in food-contact materials increases near-term demand for audited, compliant adhesives, coatings, and closures across multi-material aseptic formats.
Capacity localization and technology upgrades also create workable whitespace in regions where cold-chain limitations and long logistics corridors lift delivered costs. In 2025, Tetra Pak's expanded Binh Duong, Vietnam facility ramped capacity from 12 billion to 30 billion packages per year, and SIG added large-scale carton capacity in China through its Suzhou aseptic carton plant (4 billion packs per year). The approach is extending to other emerging hubs, including Asepto (UFlex Limited) establishing a manufacturing facility in Egypt with 12 billion packs per year capacity to support Middle East and Africa demand while reducing lead times and import dependence. Demand-side investment is likewise focusing on flexible, rapid-changeover aseptic lines and alu-layer-free barrier materials, supporting suppliers that can qualify new structures quickly and scale them across multi-serve and single-serve applications.
Recent Industry Developments in Aseptic Packaging Market
- June 2026: SIG commercially launched SIG Terra Alu-free + Full barrier packaging material for multi-serve aseptic cartons, enabling up to 12 months shelf life without an aluminum layer. The product broadens aluminum-reduction pathways for carton structures while keeping barrier performance aligned to ambient distribution needs. It also intensifies competitive differentiation around recyclability positioning and carbon-footprint reduction claims in carton-based aseptic packaging.
- May 2026: SIG and PulPac entered a strategic partnership to develop Dry Molded Fiber, paper-based closures for aseptic cartons. This targets a key pain point in carton circularity, the polymer cap and closure system, by accelerating an alternative that fits fiber-forward packaging strategies. The partnership aligns material innovation with high-volume manufacturability, which is central to adoption in mainstream dairy and beverage lines.
- April 2026: Tetra Pak and Sterilgarda Alimenti launched a 1-liter aseptic carton with a paper-based barrier, raising renewable content to around 90%. By validating a paper-based barrier approach in a commercial brand context, the launch supports a shift away from conventional barrier layers while maintaining aseptic performance requirements. It also signals how large suppliers are using partnerships with food producers to de-risk new-material qualification and line compatibility.
Aseptic Packaging Market Report Scope and Research Methodology
Market Definition and Coverage
For this study, the aseptic packaging market covers packaging formats and related filling approaches used to pack products under sterile conditions, so shelf life can be extended without relying on heavy preservatives.
Scope exclusions: We exclude non-aseptic conventional packaging and ordinary cold chain packaging that does not require sterile filling and validated aseptic handling.
Segments Covered in This Report
- By Product
- Cartons
- Bottles
- Cans
- Bags and Pouches
- Vials and Ampoules
- By Material Composition
- Paper and Paperboard
- Plastics (PP, PE, PET)
- Glass
- Metal (Aluminum, Steel)
- Composite Laminates
- By Application
- Beverage
- Ready-to-Drink (RTD) Beverages
- Dairy-Based Beverages
- Food
- Processed Food
- Fruits and Vegetables
- Dairy Food
- Pharmaceuticals
- Personal Care and Cosmetics
- Beverage
- By Filling Technology
- Form-Fill-Seal (FFS)
- Blow-Fill-Seal (BFS)
- Injection Aseptic Filling
- Rotary Aseptic Filling
- By Geography
- North America
- United States
- Canada
- Mexico
- Europe
- United Kingdom
- Germany
- France
- Italy
- Rest of Europe
- Asia Pacific
- China
- Japan
- India
- South Korea
- Rest of Asia Pacific
- Middle East and Africa
- Middle East
- United Arab Emirates
- Saudi Arabia
- Turkey
- Rest of Middle East
- Africa
- South Africa
- Egypt
- Rest of Africa
- Middle East
- South America
- Brazil
- Argentina
- Rest of South America
- North America
Data Sources, Market Sizing, and Validation
Desk Research
Desk research was first used to set the market boundaries and gather the most dependable public indicators that move aseptic packaging demand. For packaging format and material direction, we relied on sources such as US FDA packaging and food safety references, European Commission food contact and safety documentation, and standards bodies such as ISO, which define sterility and validation language used in industry.
To anchor the demand side, we also reviewed sources such as UN Comtrade trade flows for relevant packaging materials and formats, FAO and national statistics on dairy and beverage output, and peer reviewed papers that discuss aseptic processing, shelf life, and barrier materials. Company filings, investor presentations, press releases, and trusted packaging association sites were used to confirm capacity additions, technology shifts, and application trends. Where needed, paid database subscriptions were used for company financials, patent lookups, and shipment level trade checks to reduce data gaps. These desk sources are not exhaustive, and we also reviewed many other public references for data collection, validation, and clarification.
Primary Interviews and Surveys
Primary work was used to pressure test the desk assumptions that matter most, such as adoption by application, practical price ranges, and how filling technology choices change cost and conversion timelines. We spoke with a mix of packaging suppliers, converters, equipment and technology stakeholders, and end users across beverages, food, and pharma and medical applications. Regional discussions covered APAC, EMEA, and the Americas so that one geography does not drive the final view.
Distribution of primary research fieldwork respondents
| Company type | Respondent position | Region |
|---|---|---|
| Top tier: 26% | CXOs: 14% | APAC: 47% |
| Mid tier: 55% | Functional/Unit leaders: 39% | EMEA: 29% |
| Smaller Players: 19% | Managers: 47% | Americas: 24% |
Market-Sizing & Forecasting
Market sizing was built using a top-down and bottom-up approach, where packaging demand pools were reconstructed from application output and pack conversion behavior, and then cross-checked with supplier and channel signals. The top-down logic starts from aseptic-heavy end markets (like dairy, ready to drink beverages, and shelf stable foods), applies aseptic penetration and packaging mix, and then converts it into value using observable price bands by format and material.
To keep the model grounded, selective bottom-up approximations were then used, such as rollups of revenue signals from major format categories, sampled ASP times volume checks in key countries, and channel conversations on typical order sizes and contract resets. Inputs used in the model included packaged dairy and beverage production trends, shelf stable product launches, packaging material price movement (paperboard, polymers, aluminum), filling line additions and utilization expectations, and the mix shift across cartons, bottles, cans, and pouches. When gaps appeared in smaller country data, we filled them through proxy indicators such as per capita consumption, trade intensity, and neighboring market adoption patterns, and then rechecked these assumptions with interview input.
For forecasting, scenario analysis was used so changes in aseptic adoption, material pricing, and capacity additions could be reflected without overfitting the model. The final forecast path was guided by consensus ranges heard in primary discussions, and it was adjusted when leading indicators, such as beverage shelf stable growth or pharma and medical packaging demand, moved differently than the base assumptions.
Data Validation & Update Cycle
Validation was handled through multiple cross-checks, before numbers were finalized. Model outputs were compared against independent signals such as end market growth, packaging material trade direction, and announced capacity or line expansions, which helps spot over-counting and missed demand.
Any large variance by region, format, or application triggers a deeper review, and the assumptions are re-tested through follow-up outreach when needed. Before sign-off, the analysis is reviewed step by step so that calculation logic, unit conversions, and currency timing are consistent across all regions. Reports are refreshed annually, and interim updates are made when material events occur, such as sudden material price shifts, regulatory changes affecting food contact packaging, or major capacity changes. Before delivery, a final update pass is completed so clients receive the latest available view.
Mordor Intelligence's Aseptic Packaging Market Size Measured Against Other Published Estimates
Published numbers for aseptic packaging often come out different because the scope is not always aligned, and because assumptions around format mix and pricing can vary by region. Differences also show up when one study reports a demand view based on packaged food and beverage output, and another reports a supply side view based on packaging shipments or equipment activity.
Some estimates include adjacent conventional packs that are shelf stable but not truly aseptic, and some apply a single global ASP curve even when paperboard, polymer, and aluminum cost movements differ by geography. The split is also driven by base year selection and update timing, since exchange rates and material prices can change the value view quickly. In Mordor Intelligence, only sterile filled packs aligned to aseptic processing and filling technology scope are counted, and conventional non-aseptic shelf stable packaging is kept out of the total so the value stays tied to real aseptic adoption signals.
Benchmark comparison
| Source | Market Size | Gaps in Research Methodology |
|---|---|---|
| Mordor Intelligence | USD 86.36 B (2026) | |
| Industry Publisher A | USD 76.56 B (2024) | Uses an earlier base year and a shorter window, and the scope description is broader in format and application language, which can shift totals if non-aseptic shelf stable packaging is blended into the counted demand. |
| Global Publisher B | USD 63.42 B (2024) | Builds from a different base year and may apply more conservative adoption and pricing progressions across regions, which tends to reduce the value estimate when material price cycles and format mix changes are not refreshed frequently. |
Across the three figures, the main takeaway is that year selection, included pack types, and the way ASP and mix are carried forward can move the market value by a wide margin. By keeping the counted demand tied to aseptic processing use cases and by checking the totals against end market output and packaging signals, the final number can be traced back to clear and repeatable steps.
Key Questions Answered in the Report
What is the current value of the aseptic packaging market and how fast is it growing?
The aseptic packaging market size was USD 78.29 billion in 2025, is USD 86.36 billion in 2026, and is forecast to reach USD 141.06 billion by 2031 at a 10.31% CAGR.
Which product type is expanding fastest in aseptic applications?
Bags and pouches are the fastest growing, projected for an 11.31% CAGR through 2031 as brands favor lightweight, digitally printed flexibles.
Why are pharmaceuticals adopting aseptic packs at a rapid rate?
Biologic drug approvals and the cost advantages of blow-fill-seal technology are propelling pharmaceutical demand at an expected 11.13% CAGR.
How are sustainability regulations affecting material choices?
European and North American rules that prioritize recyclability are accelerating the shift toward mono-material polyethylene laminates and foil-free fiber cartons.
Which region is expected to post the highest growth through 2031?
Africa leads on growth with an 11.34% CAGR forecast as processors seek shelf-stable formats to bypass limited cold-chain infrastructure.
What is the main barrier for smaller processors switching to aseptic filling?
High capital expenditure, ranging from USD 2 million to USD 15 million per line, limits access to financing in many emerging markets.