
Market Overview
| Study Period | 2020 - 2031 |
|---|---|
| Forecast Data Period | 2026 - 2031 |
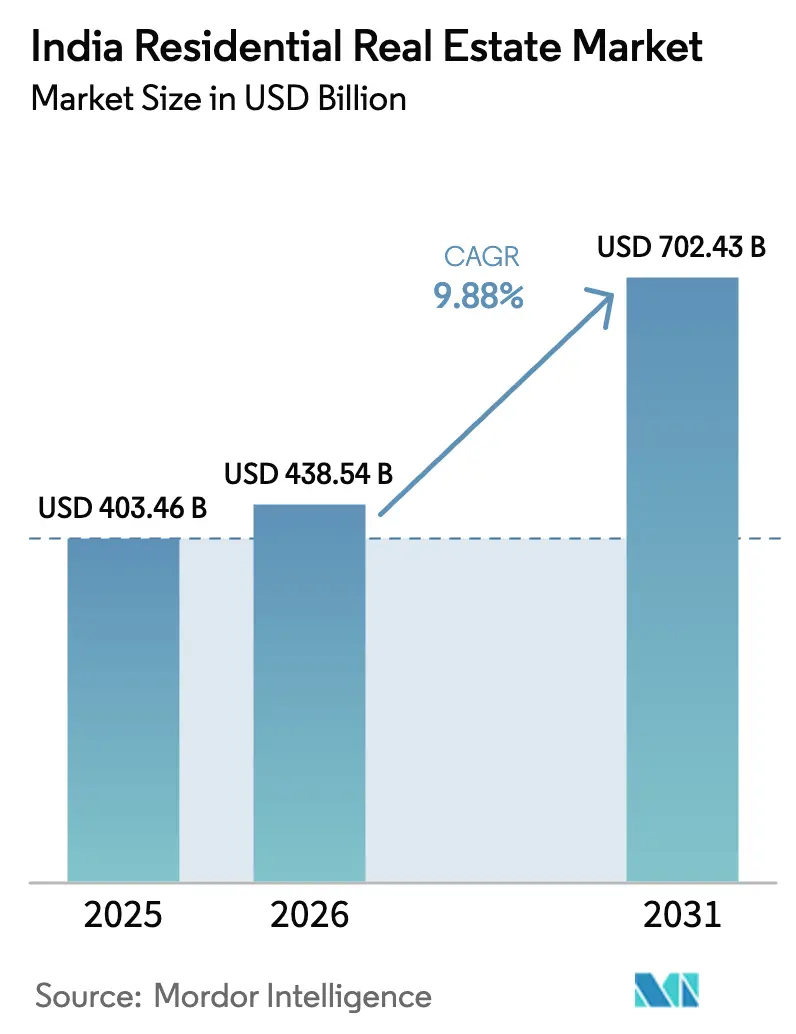
| Base Year Market Size (2025) | USD 403.46 Billion |
| Market Size (2026) | USD 438.54 Billion |
| Market Size (2031) | USD 702.43 Billion |
| Growth Rate (2026 - 2031) | 9.88 % |
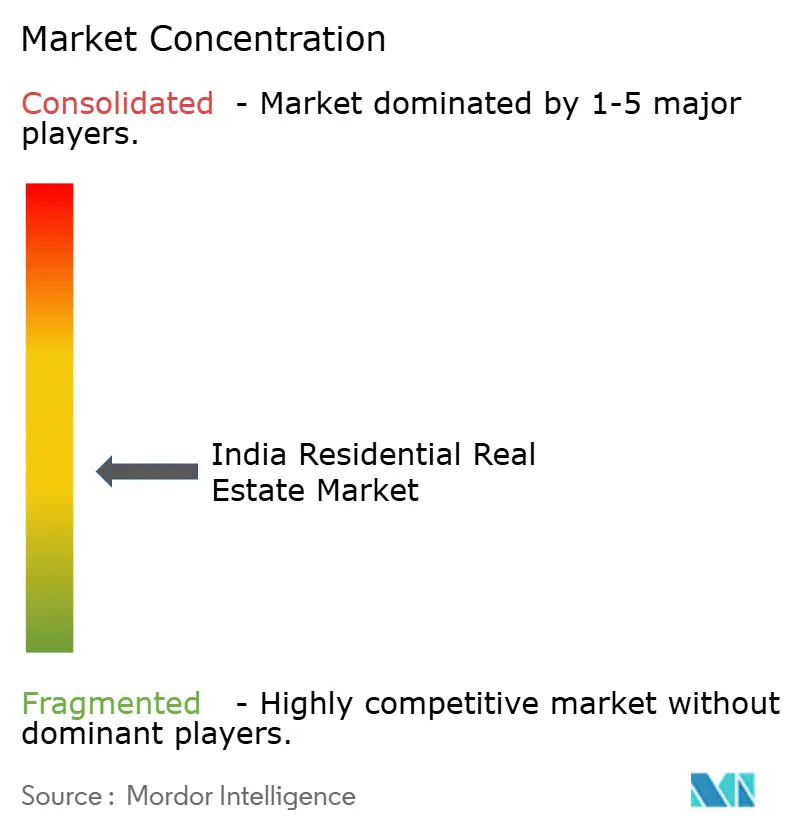
| Market Concentration | Medium |
Major Players *Disclaimer: Major Players sorted in no particular order Image © Mordor Intelligence. Reuse requires attribution under CC BY 4.0. | |
India Residential Real Estate Market Analysis by Mordor Intelligence
The India Residential Real Estate Market size is projected to be USD 403.46 billion in 2025, USD 438.54 billion in 2026, and reach USD 702.43 billion by 2031, growing at a CAGR of 9.88% from 2026 to 2031.
Demand is pivoting around easier mortgage terms after a 125-basis-point rate-cut cycle, the Union Budget’s green-home incentives, and a decisive shift of IT and Global Capability Center employment toward Tier-2 hubs. Completion-focused funds such as SWAMIH 2 and the Urban Challenge Fund are narrowing the affordable-housing deficit, while digitized land records shorten due diligence times for domestic and NRI buyers. Institutional capital continues to reshape the India residential real estate market through build-to-rent platforms and fractional-ownership vehicles that dilute traditional developer equity returns.
Key Report Takeaways
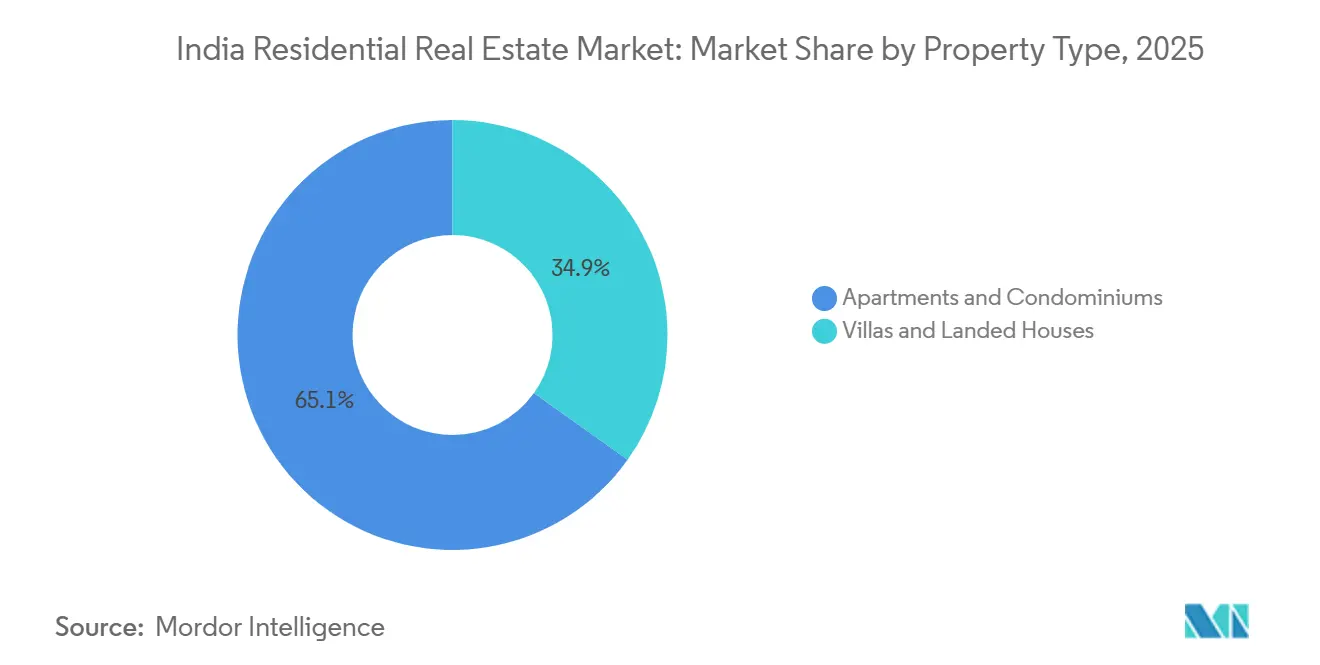
- By property type, apartments captured 65.14% of the Indian residential real estate market share in 2025, while villas and landed houses are forecast to grow at a 10.49% CAGR through 2031.
- By price band, the mid-market segment held 48.12% of the 2025 transaction value; the affordable segment is advancing at a 10.36% CAGR to 2031.
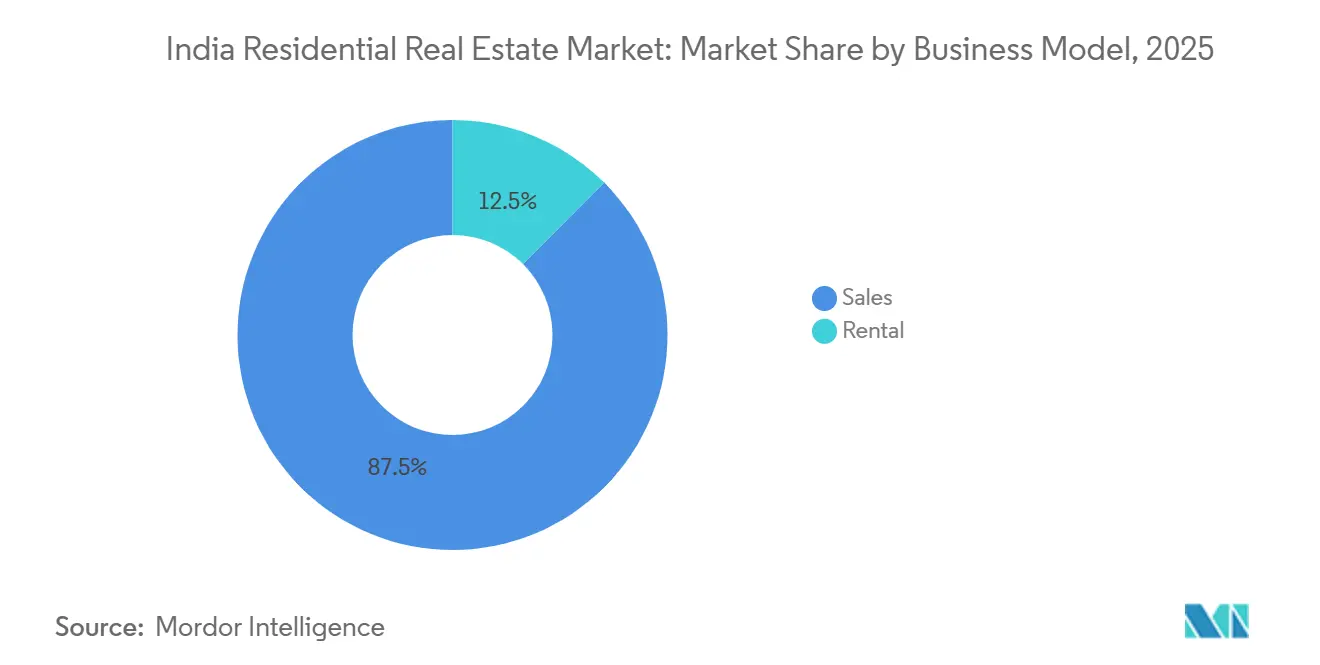
- By business model, the sales channel accounted for 87.54% of the 2025 value, yet rentals are projected to expand at a 10.70% CAGR through 2031.
- By mode of sale, primary transactions represented 63.67% of the 2025 value, while secondary transactions are set to rise at a 10.60% CAGR through 2031.
- By geography, the Rest of India, Tier-2, and Tier-3 cities captured 59.87% of the 2025 value; Hyderabad is the fastest-growing city with a 10.76% CAGR forecast to 2031.
Note: Market size and forecast figures in this report are generated using Mordor Intelligence’s proprietary estimation framework, updated with the latest available data and insights as of January 2026.
Market Trends and Insights
Drivers Impact Analysis of India Residential Real Estate Market*
| Driver | (~) % Impact on CAGR Forecast | Geographic Relevance | Impact Timeline |
|---|---|---|---|
| RBI rate-cut cycle from Q4 2024 reinvigorating mortgage affordability across Tier-1 cities | +2.1% | Mumbai, Delhi-NCR, Bengaluru, Pune, Hyderabad, Chennai | Short term (≤ 2 years) |
| IT & GCC expansion into Tier-2 hubs unlocking fresh residential corridors | +1.8% | Coimbatore, Jaipur, Kochi, Visakhapatnam, Indore, Chandigarh | Medium term (2-4 years) |
| Near-completion of “Housing for All” targets releasing pent-up affordable demand | +1.6% | National (focus in Uttar Pradesh, Bihar, Madhya Pradesh, Rajasthan) | Long term (≥ 4 years) |
| Union Budget 2025 “green home” tax deductions accelerating sustainable unit launches | +1.5% | National (early gains in Bengaluru, Pune, Hyderabad) | Medium term (2-4 years) |
| API-based land-record digitization slashing NRI due-diligence timelines | +1.2% | National (early gains in Karnataka, Maharashtra, Tamil Nadu, Gujarat) | Short term (≤ 2 years) |
| Fractional ownership and REIT-lite platforms drawing millennial capital into premium projects | +1.0% | Mumbai, Bengaluru, Delhi-NCR, Pune, Hyderabad | Medium term (2-4 years) |
| Source: Mordor Intelligence | |||
RBI Rate-Cut Cycle From Q4 2024 Reinvigorating Mortgage Affordability Across Tier-1 Cities
The December 2025 repo cut to 5.25 % lowered average home-loan rates to 8.10 %, trimming monthly installments on a USD 60,000 loan by USD 385. Mortgage penetration in Tier-1 cities rose from 62 % in 2024 to 68 % in 2025 amid 422,765 unit sales[1]. First-time buyers in the USD 60,000–120,000 bracket gain the most as banks pass through rate cuts within 90 days. The full demand impulse is set to coincide with the January-March 2026 purchase season when disbursements align with festival bonuses. Affordable EMI profiles are likely to keep the India residential real estate market on its projected growth trajectory.
IT & GCC Expansion into Tier-2 Hubs Unlocking Fresh Residential Corridors
Tier-2 cities added 187,000 new IT jobs in 2024, a 23 % jump that catalyzed housing launches within 10 km of new office clusters. Hyderabad’s 10.8 million sq ft office absorption and Pune’s 6.2 million sq ft reinforced sales spikes in Kokapet, Narsingi, Hinjewadi, and Kharadi. Lower land costs, often 35 % below Tier-1 averages, allow twin-bedroom units to be priced at USD 42,000–66,000. Single-window clearances in Tamil Nadu, Rajasthan, and Kerala have halved approval timelines, encouraging faster project rollouts. Sustained white-collar migration will keep the India residential real estate market anchored in these emerging corridors.
Near-Completion of “Housing for All” Targets Releasing Pent-Up Affordable Demand
PMAY-G has completed 2.82 million rural units, and PMAY-U has finished 91 lakh urban homes, together reaching 73 % of stated targets. The September 2024 launch of PMAY-U 2.0 earmarks 1 crore more units, enlarging an annual demand pool of almost 2 million households. States that dominate completions, Uttar Pradesh, Bihar, Madhya Pradesh, Rajasthan, still lack sufficient private supply in the USD 30,000–60,000 bracket, creating a structural gap. Interest subsidies up to USD 3,200 are available, yet awareness levels remain below 40 % in Tier-3 cities. Converting these latent buyers is vital for balanced growth within the India residential real estate market.
Union Budget 2025 “green home” tax deductions accelerating sustainable unit launches
The budget grants a USD 1,800 annual interest deduction on certified green homes in addition to the existing USD 2,400 cap, directly nudging high-income buyers toward IGBC- or LEED-rated projects[2]. Developers in Bengaluru, Pune, and Hyderabad fast-tracked 87 certified projects totaling 1.2 million sq ft in Q1 2026. The higher TDS threshold on rental income lowers compliance costs and could lift formal rental supply by 18% by 2028. Alignment with the Energy Conservation Building Code’s net-zero provisions further binds fiscal benefits to regulatory mandates. The result is a clear pipeline of green-tagged launches that will support premium pricing.
Restraints Impact Analysis of India Residential Real Estate Market*
| Restraint | (~) % Impact on CAGR Forecast | Geographic Relevance | Impact Timeline |
|---|---|---|---|
| Peripheral micro-market inventory glut suppressing price appreciation | -1.10% | Delhi-NCR (Greater Noida West), Bengaluru (Yelahanka), Mumbai (Navi Mumbai periphery) | Medium term (2-4 years) |
| Skilled construction-labor diversion to infra megaprojects delaying completions | -0.90% | National (acute in Maharashtra, Uttar Pradesh, Karnataka, Tamil Nadu) | Medium term (2-4 years) |
| Potential FY 2026 capital-gains surcharge hikes discouraging short-term upgrades | -0.80% | National (higher impact in Mumbai, Delhi-NCR, Bengaluru) | Short term (≤ 2 years) |
| SEBI BRSR 2.0 ESG compliance costs squeezing mid-sized developer margins | -0.60% | National (listed developers in Mumbai, Bengaluru, Pune, Hyderabad) | Long term (≥ 4 years) |
| Source: Mordor Intelligence | |||
Peripheral micro-market inventory glut suppressing price appreciation
Greater Noida West holds 47,000 unsold units, while Yelahanka carries 18,500, each representing more than 24 months of sales. Subvention schemes and assured buybacks dilute developer margins by up to 12 %. Lack of nearby Grade-A offices and slow infrastructure delivery reduces end-user demand. Similar oversupply in Navi Mumbai’s periphery confirms a pattern: distant micro-markets lag core zones on both price and absorption. Sticky inventory will act as a drag on the broader India residential real estate market pricing until cleared.
Skilled Construction-Labor Diversion to Infra Megaprojects Delaying Residential Completions
Bharatmala II and multiple metro builds absorbed 1.2 million skilled workers, hiking daily wages by roughly 20 % in 2024-25. Residential projects in Bengaluru, Pune, and Hyderabad face six-month delays as labor availability drops below 70 % of need. Higher mechanization offers relief but requires capital that small and mid-sized developers lack. The labor deficit is expected to persist until at least 2027, tightening project timelines. Completion delays undermine buyer trust and could inflate inventory-carrying costs within the India residential real estate market.
*Our forecasts treat driver/restraint impacts as directional, not additive. The impact forecasts reflect baseline growth, mix effects, and variable interactions.
India Residential Real Estate Market Segment Analysis
By Property Type:
Apartment Dominance Drives Urban DensityApartments accounted for a leading 65.14% of the India residential real estate market size in 2025, reflecting entrenched urban preferences for gated security and shared amenities[3]. Villas and landed houses are slated to expand at a 10.49% CAGR through 2031, surpassing apartments’ 9.6% pace as dual-income households prioritize private gardens and larger layouts. Bengaluru, Hyderabad, Pune, and Chennai captured 72% of villa demand, with projects such as Prestige City and Sobha Neopolis illustrating renewed developer focus on horizontal formats. Land scarcity keeps Mumbai and Delhi-NCR anchored to vertical stock, yet suburban corridors offer limited villa pockets financed by NRI capital inflows.
Developers launched 47 villa projects totaling 8,200 units during 2024-25, mainly on 50-plus-acre land parcels where economies of scale cushion construction costs. Customization flexibility, a clear title, and faster hand-overs offset the higher ticket sizes that average USD 220,000-430,000. Regulatory oversight under RERA has trimmed apartment delays, improving confidence, whereas villas often fall outside escrow mandates. Even so, lifestyle shifts and work-from-home norms ensure a stable pipeline for landed homes that will steadily enlarge their share of the India residential real estate market.

By Price Band:
Mid-Market Stability Anchors GrowthThe mid-market bracket of USD 60,000-180,000 held a dominant 48.12% share in 2025. Credit-linked subsidies, employer-assisted housing, and the RBI’s 125-basis-point easing cycle underpin demand stability. Affordable units under USD 60,000 are projected to grow at a 10.36% CAGR through 2031, buoyed by PMAY-U 2.0 and completion financing via SWAMIH 2. Developers had cut affordable launches by 54% in early 2025, chasing luxury margins; however, fresh government funds are pushing brownfield completions in high-deficit states.
Luxury units above USD 180,000 formed 42% of H1 2026 launches, led by DLF, Oberoi Realty, and Macrotech projects. Equities-driven wealth creation and NRI repatriation uphold this segment even as higher capital-gains levies loom. Future demand hinges on green-home tax deductions and branded-residence appeal, cushioning luxury prices. The dual-track trend keeps the India residential real estate market well diversified across income cohorts.
By Business Model:
Sales Dominance Reflects Ownership PreferencesSales transactions represented 87.54% of 2025 market value, underscoring a cultural bias toward ownership and tax incentives such as Section 24(b). Rental transactions are forecast to rise at a 10.70% CAGR through 2031, propelled by institutional build-to-rent capital worth USD 3 billion and the co-living expansion by operators like Stanza Living. Bengaluru leads with a 4.45% gross yield, while Mumbai and Gurugram hover near 4.1%.
The increased TDS threshold on rental income and growing professional management are expected to raise formal supply by nearly one-fifth by 2028. Still, sales will remain sizable because of inter-generational wealth planning and mortgage tax shields. The healthy coexistence of both channels supports liquidity and portfolio diversification across the India residential real estate market size spectrum.
By Mode of Sale:
Primary Market Leadership Signals New Supply ConfidencePrimary sales made up 63.67% of 2025 value thanks to 390,000 new launches and stronger RERA enforcement. Secondary deals are set to climb at a 10.60% CAGR, moving from 43% of unit volumes in 2025 toward almost half the market by 2031. Digitized land records that verify titles in hours rather than weeks have increased buyer confidence in ready-to-occupy stock.
States such as Karnataka and Maharashtra captured 62 % of resale value, aided by NRI interest. Fractional-ownership platforms now curate premium resale inventory, easing exit options for early buyers. Faster capital churn in the resale space will keep liquidity healthy and broaden participation in the India residential real estate market.
Geography Analysis
Hyderabad leads growth prospects, clocking a forecast 10.76% CAGR through 2031 as 10.8 million sq ft of 2024 office absorption translates into brisk housing demand in Kokapet, Narsingi, and Financial District micro-markets. Steady infrastructure, Outer Ring Road upgrades, and the 56-km metro Phase II operational by late 2025 will reduce commute times and lift mid-market ticket prices to USD 82 per square foot. Bengaluru, Mumbai, and Delhi-NCR still aggregate 40.13% of value, yet diverge in momentum: Bengaluru enjoys 8-10% annual price rises in Whitefield, while Mumbai’s land scarcity pushes developers toward vertical redevelopments financed by GIC and Blackstone. Delhi-NCR’s Greater Noida West inventory glut exceeds 24 months of sales, holding price growth to a modest 3-4% and prompting subvention schemes that erode developer margins.
Pune occupies a stable 12% share of national transactions; its Hinjewadi and Kharadi corridors command premiums of USD 14-22 per square foot over peripheral locations thanks to sustained IT leasing. Chennai’s OMR stretch logs 7-9% annual appreciation on the back of automotive and pharma expansion, although its 3.85% rental yield trails Bengaluru’s 4.45%, reflecting slower job creation. Ahmedabad and Kolkata combine for 8% of value, characterized by lower ticket sizes around USD 54,000 that attract first-time owners. The migration of IT and GCC roles to Coimbatore, Jaipur, Kochi, Visakhapatnam, Indore, and Chandigarh keeps Tier-2 cities prominent; their land costs run 30-40% below Tier-1 averages, enabling 2-bedroom units at USD 42,000-66,000.
State RERA enforcement shapes momentum: MahaRERA’s stringent escrow and reporting norms have cut delays by 28% since 2019, whereas UP-RERA’s capacity gaps permit project extensions in 40% of delayed schemes. Affordable-band shortages persist in states like Uttar Pradesh and Bihar despite PMAY progress, spurring brownfield redevelopment via SWAMIH 2. Across metros and emerging hubs alike, land parcels within 3 km of operational metro stations secure premiums up to 60%, reinforcing the transit-oriented development thesis that underpins sustained expansion of the India residential real estate market.
Regulatory Landscape
India residential real estate is governed primarily by the Real Estate (Regulation and Development) Act, 2016 (RERA), implemented through state regulators and the central RERA portal under the Ministry of Housing and Urban Affairs (MoHUA). RERA-driven requirements for project registration, escrow discipline, disclosures, and grievance redressal continue to shape developer timelines and buyer confidence across key states through their respective authorities (for example, TN-RERA, Kerala RERA, and West Bengal RERA).
On construction and sustainability compliance, standards are tightening and becoming more codified for residential assets. The Bureau of Indian Standards replaced the National Building Code 2016 with SP 7: 2026 (National Building Construction Standards 2026), effective 30 April 2026, requiring design, safety, and execution practices to align with the updated framework. In parallel, the Bureau of Energy Efficiencys Eco Niwas Samhita 2024 applies energy-efficiency provisions to larger residential projects (minimum connected load of 100 kW or contract demand of 120 kVA), reinforcing the shift toward measurable performance and certified green-home delivery alongside state adoption of standardized building regulations (SP 73:2023).
Value Chain Analysis
The residential real estate value chain in India covers land identification and aggregation (direct purchase, joint development agreements, or redevelopment), statutory approvals and RERA registration, design and engineering, procurement of materials and labor, construction execution, sales and channel partners, financing and mortgage origination, handover, and post-handover facility or property management. Developers sit at the center of this process, coordinating contractors and specialist consultants, while institutional investors and structured capital increasingly influence project phasing, governance, and reporting requirements.
Execution capacity and input-cost volatility are recurring frictions across the chain. Developers are leaning more on large contractors and EPC-grade partners to protect delivery schedules amid labor tightness and competing infrastructure demand. A visible example is Godrej Properties awarding a large construction contract (INR 1,100 crore) to Tata Projects for luxury residential projects in Gurugram, which points to the growing importance of assured construction capacity in the delivery stack. Materials sourcing is another pressure lever, with reported supply constraints and price volatility in items such as steel and building services products amid Gulf-linked disruptions in early 2026. Industry discussions also continue to cite the GST structure and limited Input Tax Credit on residential projects as a cost add-on that flows through procurement economics and developer pricing strategies.
Competitive Landscape
The top 10 developers captured just 18% of national unit sales in FY 2025, underlining a fragmented field where regional specialists and unorganized builders still dominate. Brands such as DLF, Godrej Properties, Prestige, Macrotech, and Brigade leverage institutional capital and green certifications to win city-center parcels, enabling 8-12% price premiums in luxury formats. Mid-caps like Casagrand and Total Environment lean on local land banks but feel a tighter squeeze from rising ESG costs and labor-rate inflation. SEBI’s BRSR 2.0 framework increases reporting overhead yet enhances buyer trust, favoring scaled players over smaller peers.
Institutional money reshapes balance sheets. Singapore’s GIC invested USD 504 million alongside DLF for a Gurugram luxury project in February 2025, demonstrating foreign appetite for marquee developments. Fractional platforms Strata, PropShare, and hBits pooled USD 300 million in 2024-25, lowering entry barriers and compressing developer equity timelines. SM-REIT guidelines promise USD 1.2 billion of new liquidity by 2027, potentially providing mid-tier builders with alternatives to high-cost private debt. Early tech adopters such as Godrej and Macrotech use virtual tours and AI-driven lead scoring to cut sales cycles by up to 20%, setting benchmarks peers must follow.
Green certification uptake remains an opportunity. IGBC’s 412-million-sq-ft residential portfolio represents less than 15 % of new annual launches, yet Union Budget tax perks have pushed Prestige, Oberoi Realty, and Kolte-Patil to fast-track Platinum ratings. Rising buyer awareness about operating-cost savings may widen demand for certified stock. As compliance outlays, land scarcity, and customer expectations converge, market share should gravitate toward transparent, well-capitalized entities, steadily reshaping the competitive contours of the India residential real estate market.
India Residential Real Estate Industry Leaders
-
Godrej Properties
-
Prestige Estate
-
DLF
-
Phoenix Mills
-
L&T Realty Ltd.
- *Disclaimer: Major Players sorted in no particular order
India Residential Real Estate Market Companies Covered in this Report
- DLF Ltd
- Godrej Properties
- Prestige Estates Projects
- Brigade Enterprises
- Sobha Ltd
- Oberoi Realty
- L&T Realty
- Phoenix Mills
- Mahindra Lifespace Developers
- Puravankara Ltd
- Kolte-Patil Developers
- Sunteck Realty
- Lodha Group (Macrotech Developers)
- Indiabulls Real Estate
- NBCC (India)
- Omaxe Ltd
- Ansal Properties & Infrastructure
- Bharti Realty
- Total Environment
- Casagrand Builders
Market Opportunities and Future Outlook
Affordable housing and formal rental supply remain the most policy-backed whitespace areas, with PMAY-U 2.0 providing a near-term operating framework for delivery and financing support. In May 2026, MoHUA released operational guidelines for PMAY-U 2.0 to support one crore urban poor and middle-class families up to 2029, and the program explicitly includes Affordable Rental Housing models that use both conversion of unused government stock and new public or private construction. This gives developers, contractors, and asset managers a clearer pathway to build repeatable pipelines in sub-USD 60,000 price points and in institutionally managed rental formats, particularly where SWAMIH-style completion funding and RERA enforcement improve delivery credibility.
Regulatory standardization and digital adoption also create opportunity lanes for differentiated developers and service providers. The BIS transition to SP 7: 2026 (effective 30 April 2026) raises the bar for compliant design and construction practices, favoring firms with stronger engineering, documentation, and quality systems. On process transformation, BIM adoption for Indian construction projects above INR 50 crore remains low (12.3% as of Q1 2026), leaving room for faster planning-to-launch cycles and better construction monitoring as adoption increases. Policy and legislative discussions point to further reform activity as well, including a draft Apartment Bill presented in July 2026 after long-standing demand, which supports clearer governance structures for apartments and could improve transaction confidence in large-format, multi-owner communities.
Recent Industry Developments in India Residential Real Estate Market
- June 2026: Godrej Properties sold over 1,000 apartments in the newly launched Godrej Vanantara project in Bengaluru, generating more than INR 2,000 crore in the launch week. The scale of absorption shows the depth of demand for well-located, branded apartment communities, even as developers navigate construction capacity and compliance requirements. Strong launch performance also supports internal cash-flow visibility, enabling faster phase execution and follow-on land monetization.
- May 2026: Godrej Properties partnered with Tata Projects for core and shell construction of three luxury residential projects along Golf Course Road, Gurugram, with a contract value of about INR 1,100 crore. The arrangement strengthens delivery assurance for premium inventory, where timelines and finishing quality can directly influence pricing and buyer confidence. It also reflects a broader shift toward capability-led partnerships to de-risk execution amid labor and materials volatility.
- February 2025: DLF and GIC formed a joint venture for a USD 504 million luxury project on Gurugrams Golf Course Road. The transaction highlighted the role of foreign institutional capital in scaling marquee residential developments and in setting project governance standards. It also pointed to continued appetite for prime micro-markets where land scarcity and brand-led positioning support higher ticket sizes.
India Residential Real Estate Market Report Scope and Research Methodology
Market Definition and Coverage
For this sizing, the market covers the transaction value created from residential housing activity in India, including new home sales, resale transactions, and residential leasing for personal living use, counted within legal residential zones.
Scope exclusions: We exclude informal self-built dwellings and residential second-home investments that are located outside India.
Segments Covered in This Report
- By Property Type
- Apartments & Condominiums
- Villas & Landed Houses
- By Price Band
- Affordable
- Mid-Market
- Luxury
- By Business Model
- Sales
- Rental
- By Mode of Sale
- Primary (New-Build)
- Secondary (Existing Home Resale)
- By Geography
- Bengaluru
- Mumbai
- Delhi-NCR
- Hyderabad
- Pune
- Chennai
- Ahmedabad
- Kolkata
- Rest of India
Data Sources, Market Sizing, and Validation
Desk Research
Desk research was used to set the market guardrails and to build starting assumptions that can be checked later in interviews. We relied on public sources such as Ministry of Housing and Urban Affairs releases, National Statistical Office publications, Reserve Bank of India data on housing credit and interest rates, and National Housing Bank or related housing finance indicators (where available).
Alongside this, we reviewed sources such as state-level RERA portals and registration volumes, city development authority updates, listed company filings and investor presentations, and reputed press coverage on launches, absorption, and price movement. In a few cases, paid subscriptions for company financials and news were used to reduce gaps in developer revenues and to sanity-check unusual jumps. These examples are illustrative only, and other public sources were also used for data collection, validation, and clarification.
Primary Interviews and Surveys
Primary work focused on confirming what desk sources cannot fully explain, especially the mix of primary sales versus resale, typical pricing progression in key cities, and the share of transactions that move to registered completion. We spoke with a spread of developers, brokers, housing finance professionals, and project consultants across major metros and fast-growing tier-2 markets. The inputs helped us tighten assumptions on demand drivers and timing.
Because some data points can look clean on paper but behave differently on the ground, follow-up checks were done when model outputs did not align with local absorption, financing availability, or policy changes.
Distribution of primary research fieldwork respondents
| Company type | Respondent position |
|---|---|
| Top tier: 38% | CXOs: 14% |
| Mid tier: 45% | Functional/Unit leaders: 31% |
| Smaller Players: 17% | Managers: 55% |
Market-Sizing & Forecasting
Sizing was built using a top-down demand pool reconstruction, where household formation, urbanization, mortgage disbursement trends, and registered residential transactions were translated into an implied value of activity by location and price points. To keep the totals realistic, the outputs were then corroborated with selective bottom-up approximations, such as sampled unit counts from major project launches, observed absorption patterns, and an average selling price (ASP) x volume check for key cities.
Inputs that mattered most in this market included residential price indices and ticket-size movement, new launches and absorption rates, housing credit growth and interest rate direction, the mix of ready-to-move versus under-construction inventory, and the pace of registrations visible through official channels. Forecasting leaned on scenario analysis supported by expert views, since rate cycles, policy actions, and affordability shifts can change buying timelines quickly. Where bottom-up checks had missing coverage for smaller cities, we used population and income proxies to scale, and then adjusted back based on interview feedback.
Data Validation & Update Cycle
Validation was done through multiple checks so the model does not rely on one indicator. We compared outputs against independent signals like mortgage growth, registration trends, and reported launch and absorption movement, and then reviewed any large variances city by city before sign-off.
If a sharp change was seen, such as a sudden price jump or a credit tightening phase, we re-contacted sources to confirm whether it was a temporary effect or a real shift. Reports are refreshed annually, and interim updates are made when material events occur. Before delivery, an analyst performs a final pass to ensure the latest public releases and market signals are reflected.
Mordor Intelligence's India Residential Real Estate Market Size Compared Against Other Published Estimates
Published market values for India residential real estate can vary widely, and that usually comes from what is being counted and how quickly assumptions are refreshed. Differences also show up when some studies mix up housing construction activity with property transaction value, or when they use aggressive long-term price growth without checking affordability and credit.
Informal self-built dwellings sit outside Mordor Intelligence's scope, and that single exclusion can move totals a lot in India where unorganized housing stock is large and unevenly tracked. Another common gap is that some estimates appear to treat the market as a stock value of all homes, rather than a flow of sales and lease activity in a year, which can inflate the number by orders of magnitude. Exchange-rate timing and whether resale and leasing are included also create visible spread across published figures.
Benchmark comparison
| Source | Market Size | Gaps in Research Methodology |
|---|---|---|
| Mordor Intelligence | USD 403.46 B (2025) | |
| Global Consultancy A | USD 36.02 T (2024) | The figure is closer to a total housing asset stock style view, which can blend accumulated property value with annual transaction value, thereby overstating a yearly market size. |
| Industry Publisher B | USD 293.37 B (2024) | Often scoped like a housing revenue pool with narrower transaction coverage and different base-year treatment, which can undercount resale and leasing value and apply faster growth assumptions. |
Taken together, the comparison mainly shows that scope and the unit of measurement matter more than small modeling tweaks. When the market is treated as annual residential activity and checked against financing, registration, and absorption signals, the result stays easier to explain and to repeat with the same inputs year after year.
Key Questions Answered in the Report
How large is the India residential real estate market in 2026?
The India residential real estate market size stands at USD 438.54 billion in 2026 and is projected to reach USD 702.43 billion by 2031.
Which city is expected to grow the fastest to 2031?
Hyderabad leads with a forecast CAGR of 10.76% on the back of strong office absorption and pharma-sector expansion.
What policy supports affordable housing demand?
PMAY-U 2.0, launched in September 2024, targets 1 crore additional urban units and offers interest subsidies up to USD 3,200 for eligible buyers.
How are green-home incentives influencing new launches?
Union Budget 2025 introduced an extra USD 1,800 interest deduction for certified green homes, prompting 87 IGBC-rated projects in Q1 2026 alone.