
Market Overview
| Study Period | 2020 - 2031 |
|---|---|
| Forecast Data Period | 2026 - 2031 |
| Base Year Market Size (2025) | USD 2.21 Billion |
| Market Size (2026) | USD 2.36 Billion |
| Market Size (2031) | USD 3.26 Billion |
| Growth Rate (2026 - 2031) | 6.71 % |
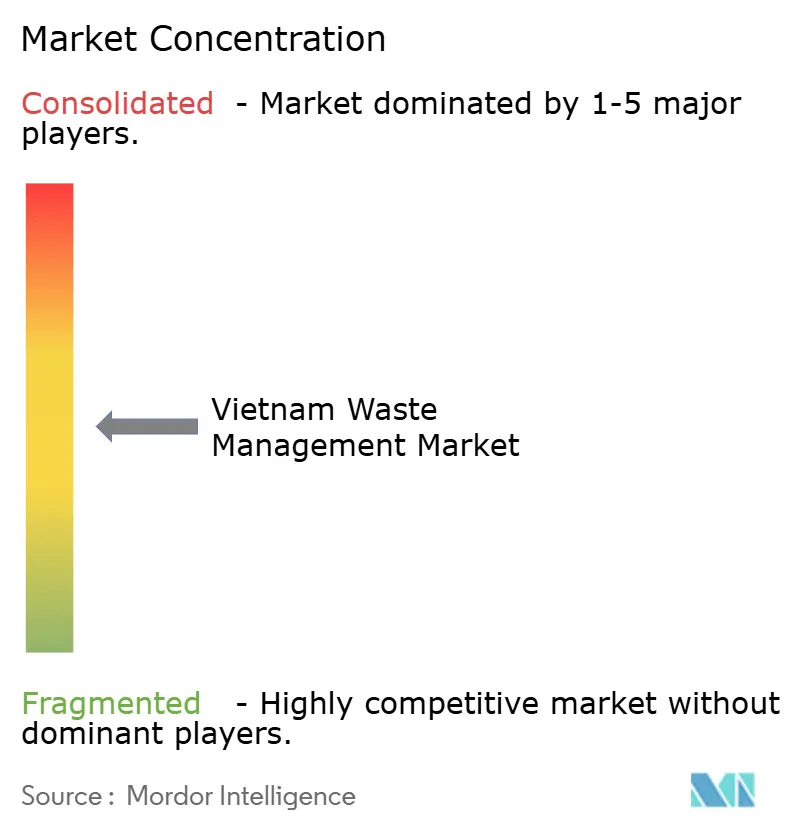
| Market Concentration | Medium |
Major Players *Disclaimer: Major Players sorted in no particular order Image © Mordor Intelligence. Reuse requires attribution under CC BY 4.0. | |
Vietnam Waste Management Market Analysis by Mordor Intelligence
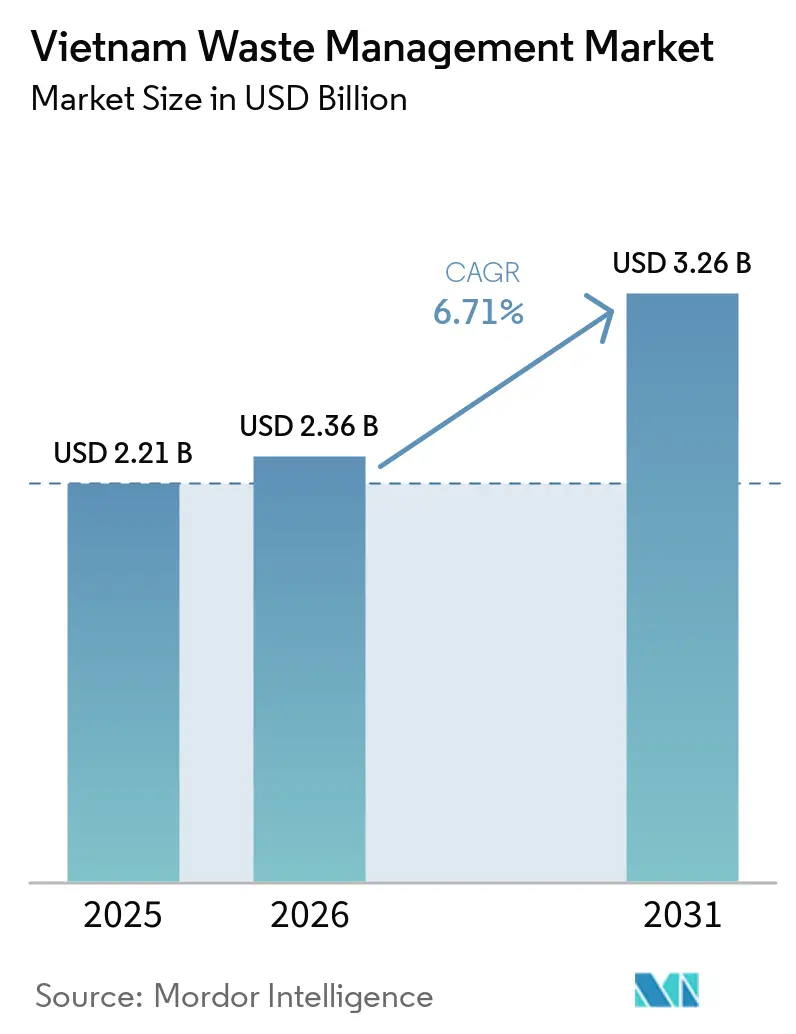
Vietnam Waste Management Market size in 2026 is estimated at USD 2.36 billion, growing from 2025 value of USD 2.21 billion with 2031 projections showing USD 3.26 billion, growing at 6.71% CAGR over 2026-2031. Accelerating urbanization, tighter environmental laws, and a national circular-economy roadmap continue to reshape demand, while extended-producer-responsibility (EPR) rules nudge manufacturers toward formal recycling channels. Public-health campaigns and digital route-optimization tools are raising source-separation rates in Ho Chi Minh City and Hanoi, creating new volumes for advanced treatment. Rising foreign direct investment is bringing waste-to-energy, polyester-to-polyester recycling, and high-purity composting technologies to provincial markets. At the same time, project developers must work around land-acquisition hurdles, rural collection gaps, and constrained provincial budgets, all of which slow down infrastructure roll-outs.
Key Report Takeaways
- By source, residential streams dominated with a 55.12% share of the Vietnam waste management market size in 2025, while commercial waste is set to record the highest 7.92% CAGR to 2031.
- By service type, collection, transportation, sorting, and segregation captured 46.31% of the Vietnam waste management market share in 2025, whereas recycling and resource recovery are forecast to advance at an 8.02% CAGR through 2031.
- By waste type, municipal solid waste accounted for a 56.74% share in 2025, while e-waste is expected to register the quickest 6.82% CAGR during the forecast window.
- By geography, Ho Chi Minh City led with 25.55% revenue share in 2025, whereas the Rest of Vietnam segment is projected to post the fastest 6.82% CAGR through 2031.
Note: Market size and forecast figures in this report are generated using Mordor Intelligence’s proprietary estimation framework, updated with the latest available data and insights as of 2026.
Vietnam Waste Management Market Trends and Insights
Drivers Impact Analysis*
| Driver | % Impact on CAGR Forecast | Geographic Relevance | Impact Timeline |
|---|---|---|---|
| National circular-economy roadmap targeting 85% waste collection by 2030 | +2.1% | National, prioritizing urban areas first | Long term (≥ 4 years) |
| Tightening environmental legislation & enforcement | +1.8% | National, with early gains in Ho Chi Minh City, Hanoi, Da Nang | Medium term (2-4 years) |
| Foreign-investor led technology transfer in waste-to-energy projects | +1.4% | Ho Chi Minh City, Hanoi, emerging in Binh Dinh, Thanh Hoa | Medium term (2-4 years) |
| Rising public health awareness & urban cleanliness campaigns | +1.2% | Urban centers, spill-over to provincial cities | Short term (≤ 2 years) |
| Extended Producer Responsibility expansion to packaging & electronics | +0.9% | National, concentrated in manufacturing hubs | Medium term (2-4 years) |
| Source: Mordor Intelligence | |||
National Circular-Economy Roadmap Targeting 85% Waste Collection by 2030
Under the 2030 circular-economy action plan, Vietnam aims for 95% urban and 80% rural waste collection, while cutting landfill use below 50%. The strategy also links biomass and municipal waste to renewable-energy targets, giving waste-to-energy developers a government-endorsed revenue story. Agriculture generates 93.61 million tons of waste annually, yet just 52% is reused; regulations now call for a 25% jump in organic-fertilizer output by 2025 and a 30% organic share of all registered fertilizers by 2030. These targets integrate rural income growth with emissions goals, opening farmland markets for biochar and compost initiatives. As collection targets rise, the Vietnam waste management market gains visibility on feedstock volumes, improving bankability for regional treatment hubs.
Tightening Environmental Legislation & Enforcement
Vietnam’s legal framework now revolves around Decree 05/2025/ND-CP, Decision 611/QD-TTg, and Decision 11/2025/QD-TTg, each introducing stricter EPR obligations, regional treatment-zone targets, and polluter-pays recovery rules. The new regime lifts revenue-exemption thresholds, formalizes 24 certified recyclers, and assigns full restoration costs to parties causing waste incidents. These rules accelerate market consolidation because smaller operators struggle to finance compliance upgrades, while integrated players monetize economies of scale. Predictable enforcement also reduces regulatory risk, unlocking long-tenor funding for large treatment plants. The net effect is a clearer, more investable backdrop that underpins the Vietnam waste management market’s medium-term expansion[1].
Foreign-Investor-Led Technology Transfer in Waste-to-Energy Projects
Multinational investors are scaling up capital-intensive assets such as Syre Group’s USD 1 billion polyester-to-polyester plant in Binh Dinh, Thai Binh’s USD 61 million waste-to-energy project (600 tons/day, 15 MW), and Thanh Hoa’s USD 50 million facility (1,000 tons/day, 12 MW). These projects import European gasification lines and Asian combustion systems, establishing technology baselines that domestic firms increasingly adopt. Local contractors gain know-how, and regulators refine permitting templates around proven designs, shortening future project timelines. The resulting spillover pushes the Vietnam waste management market toward higher energy yields and lower landfill dependency.
Rising Public-Health Awareness & Urban Cleanliness Campaigns
Digital citizen-engagement tools such as Ho Chi Minh City’s GRAC platform have lifted source-separation rates to 90% and trimmed citizen complaints by 50%, while managing 2.555 million tons of household waste each year. Citywide collection already captures 99% of daily solid waste, but only 40% receives advanced treatment, exposing the next capacity bottleneck. UNDP-backed programs are training informal collectors, 30% of the workforce, to become community ambassadors, further amplifying public-health messaging. Together, grass-roots campaigns and digital tracking tools reinforce responsible disposal habits, shrink litter hot-spots, and steer more recyclables toward formal processors. These outcomes feed back into higher demand for recycling, composting, and waste-to-energy services[2].
Restraints Impact Analysis*
| Restraint | % Impact on CAGR Forecast | Geographic Relevance | Impact Timeline |
|---|---|---|---|
| Limited landfill capacity & land-acquisition hurdles | -1.1% | National, acute in Ho Chi Minh City, Hanoi | Short term (≤ 2 years) |
| Capital constraints for provincial waste-infrastructure upgrades | -0.8% | Provincial cities, rural communes | Medium term (2-4 years) |
| Fragmented collection system in rural communes | -0.6% | Rural areas, Mekong Delta, mountainous regions | Long term (≥ 4 years) |
| Source: Mordor Intelligence | |||
Limited Landfill Capacity & Land-Acquisition Hurdles
Sites such as Dak R’lap in Dak Nong are operating beyond design limits because replacement projects like Dao Nghia remain stalled over land clearance, pushing completion to late 2025. In Ho Chi Minh City, four treatment complexes already span 1,670 ha, yet buffers mandated in earlier agreements are missing, constraining expansion. Waste-to-energy developers need larger footprints and special zoning, adding another layer of approvals that extends timelines. Scarcity of peri-urban land raises acquisition costs, forcing operators to pivot toward high-density or vertical technologies that demand larger upfront capital and more technical skill.
Capital Constraints for Provincial Waste-Infrastructure Upgrades
Only 30% of Vietnam’s disposal sites meet engineered-landfill standards, with most deficits outside Tier-1 cities. Rural collection averages 66% versus 92% in urban areas, reflecting lower tax bases and limited borrowing headroom. Vietnam Waste Solutions plans a USD 395 million shift from landfill to waste-to-energy, but needs higher service fees to keep cash flows viable. Provincial governments depend on central grants and multilaterals for co-financing, slowing project rollout and prolonging environmental risks. The Vietnam waste management industry, therefore, remains uneven, with bankable projects clustering in wealthier localities[3].
*Our forecasts treat driver/restraint impacts as directional, not additive. The impact forecasts reflect baseline growth, mix effects, and variable interactions.
Segment Analysis
By Source: Residential Dominance Drives Infrastructure Scaling
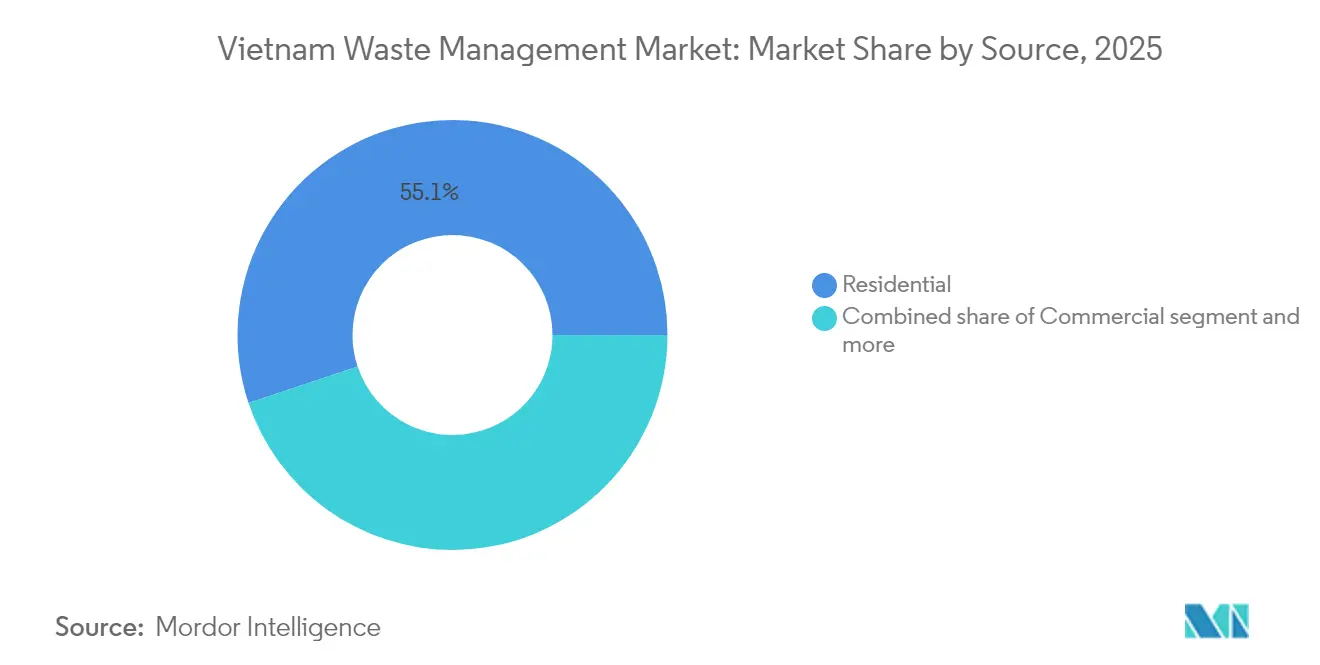
Residential streams held 55.12% of the Vietnam waste management market share in 2025, underpinned by an expanding urban population that generated predictable, route-dense tonnage. As a result, municipal operators have optimized pick-up times and standardized bins, bringing down per-household costs and freeing capital for treatment upgrades. The Vietnam waste management market size for commercial waste is much smaller today, yet it is forecast to rise at an 7.92% CAGR through 2031 as shopping centers, logistics hubs, and hospitality venues multiply across Tier-2 cities. Commercial clients also accept premium service packages, such as weekend pick-up and secure shredding, that carry higher margins.
Industrial, medical, and construction waste together account for the remaining share, yet each niche opens specialized revenue streams. Hazardous-waste contractors earn certification premiums to handle solvents and sludge, while hospitals in Bac Giang must conform to Decision 33/2025/QD-UBND’s strict segregation rules. Rubber producers have begun converting wastewater sludge into organic fertilizer, signaling agricultural up-cycling potential. With policy pressure mounting, these sub-segments will scale, but residential tonnage will continue to anchor fleet utilization across the Vietnam waste management market.

By Service Type: Collection Infrastructure Enables Treatment Innovation
Collection, transport, sorting, and segregation collectively captured 46.31% of the Vietnam waste management market size in 2025, reflecting the sector’s immediate priority of getting waste off the streets. Digitized routing software cut idle mileage and boosted on-time performance, while barcode-tagged bins improved traceability. Downstream, recycling and resource-recovery services are the fastest-growing segment, projected at an 8.02% CAGR, thanks to EPR mandates, rising PET re-processing capacity, and e-waste legislation.
Disposal and treatment still rely heavily on landfills, but mega-projects such as Hanoi’s Nam Son expansion (USD 300 million equivalent, 2,400 tons/day, 60 MW) embody the transition toward energy-from-waste. Composting plants like Phu Minh reach 99% organic sorting purity, showing viable alternatives for food and garden waste. Consulting, auditing, and training now form a small but rising slice of the Vietnam waste management industry, as producers need lifecycle data, carbon accounting, and ISO certification to meet export-market requirements.
By Waste Type: Municipal Solid Waste Foundation Supports Specialized Growth
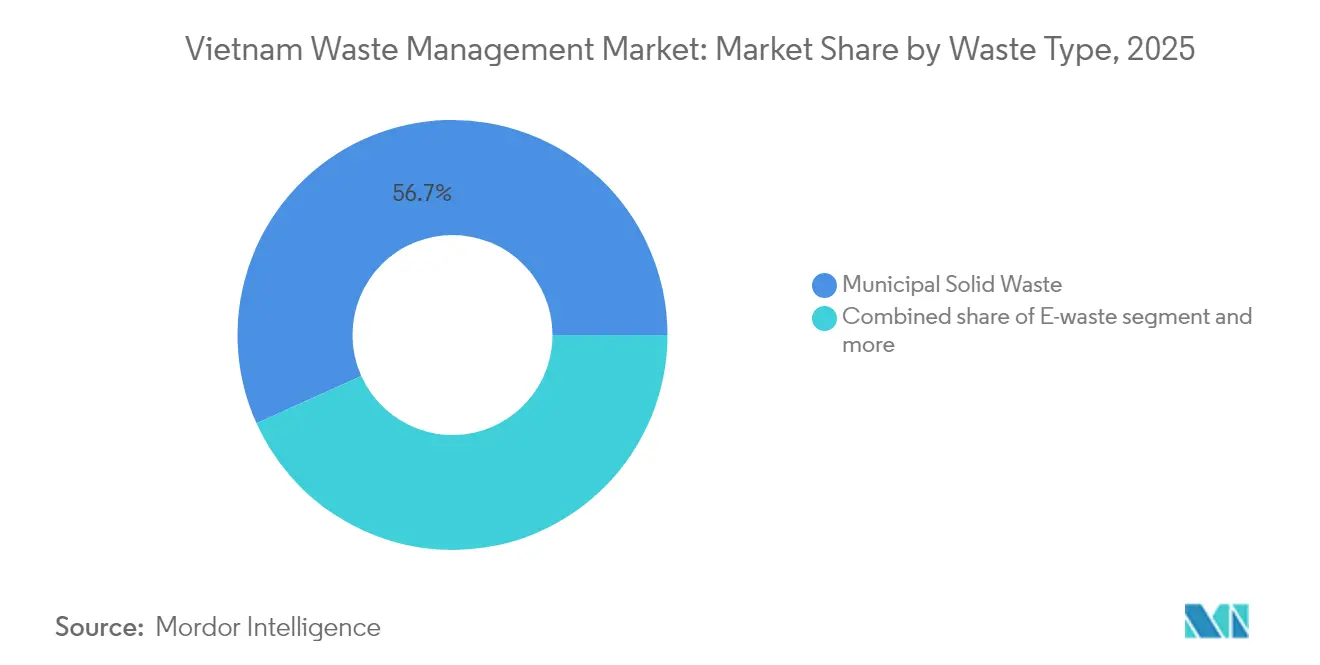
Municipal solid waste (MSW) accounted for 56.74% of total volume in 2025 and remains the bedrock feedstock for integrated facilities. MSW provides stable calorific value for incinerators and steady input for materials-recovery facilities, ensuring baseline revenues. However, e-waste is clocking a 6.82% CAGR, outpacing all other streams as smartphone and appliance ownership rise. The Vietnam waste management market size tied to e-waste will therefore expand disproportionately, driving demand for disassembly lines, precious-metal recovery, and specialized logistics.
Industrial hazardous waste needs costly treatment steps, chemical stabilization, encapsulation, high-temperature incineration, deterring smaller entrants, and concentrating revenue among licensed firms. Plastic waste also commands policy focus because Vietnam has committed to cutting marine leakage by 50% by 2025 and 75% by 2030. Construction debris volumes soar alongside infrastructure spending, yet recycling remains underdeveloped, given quality-control gaps for reclaimed aggregates. Taken together, these shifts push the Vietnam waste management market toward diversified, multi-line operators capable of handling heterogeneous input streams.
Geography Analysis
Ho Chi Minh City controlled 25.55% of the Vietnam waste management market in 2025, processing roughly 14,000 tons each day with 99% collection coverage. Two waste-to-energy plants scheduled before 2030 aim to treat up to 45% of that tonnage, displacing landfill use and generating grid power under feed-in tariffs. The GRAC digital platform has already raised source-separation to 90% and cut complaints by half, signaling strong citizen engagement. Pricing reforms index collection fees to service quality, improving cash flows for private contractors and lowering municipal subsidy burdens.
Hanoi ranks second, anchored by the Nam Son complex expansion worth USD 296 million (at VND 7,531 trillion), which will add 60 MW of renewable electricity and 2,400 tons-per-day capacity by late 2026. River-revitalization budgets totaling USD 825 million cover four pollution hotspots, pairing wastewater treatment with environmental restoration. Rural districts around Hanoi are piloting organic-waste hubs like Phu Minh, which hit 99% purity in compost input and produced zero secondary emissions, demonstrating replicable models for peri-urban zones.
The Rest-of-Vietnam cluster is on track for the fastest 6.82% CAGR through 2031 because provincial authorities are packaging multi-district concessions to attain scale. Thai Binh’s USD 61 million waste-to-energy facility (600 tons/day, 15 MW) and Thanh Hoa’s USD 50 million project (1,000 tons/day, 12 MW) exemplify that momentum. Binh Dinh’s polyester-recycling megaproject positions Vietnam as a regional textile-circularity hub. Rural collection still lags at 66%, yet mobile transfer stations and public-private partnerships show early gains in the Mekong Delta. Lower land prices and provincial tax incentives are attracting capital, gradually narrowing the infrastructure gap with Tier-1 cities and enlarging the Vietnam waste management market.
Regulatory Landscape
Vietnam's waste-management rulebook is anchored in the 2020 Law on Environmental Protection and its implementing guidance, notably Circular 02/2022/TT-BTNMT. From 2026, day-to-day compliance is increasingly shaped by the EPR refresh. Decree 110/2026/ND-CP, issued in April 2026 and effective from May 25, 2026, sets out recycling and waste-treatment obligations for manufacturers and importers, including annual declarations via the National EPR Information System (deadline April 1) and financial contributions for specified product and packaging groups.
Implementation clarity tightened further in June 2026 with the issue of Circular 24/2026/TT-BNNMT to guide execution of Decree 110/2026/ND-CP. The measures reinforce traceability requirements and formalize funding flows, including payments linked to waste-treatment responsibilities, raising the compliance bar for producers and for waste operators that service EPR-linked streams. They also support a shift from informal recovery toward certified recyclers and auditable treatment outcomes.
Value Chain Analysis
Vietnam's waste-management value chain runs from upstream waste generation (households, commercial premises, industrial zones) to municipal and private collection and transport fleets, then transfer and sorting infrastructure. Downstream, waste routes include landfilling, composting, recycling, co-processing, and waste-to-energy (WtE). Collection and street-cleaning functions remain the main entry point for CITENCO (Ho Chi Minh City) and URENCO (Hanoi). In major cities, routing digitalization and higher source-separation rates improve input quality into sorting lines and organics processing.
In practice, two parallel supply chains operate. One is a formal network of licensed waste companies and certified recyclers. The other is an informal ecosystem of collectors and traditional trading nodes that aggregate materials before they reach processors. Industry coalitions and platforms help connect these layers, including PRO Vietnam and the Public-Private Collaboration (PPC) on plastic waste. Ecosystem mapping also points to breadth of participants, with CEL Consulting identifying more than 1,150 actors across Vietnam's plastic recycling value chain. On the capacity side, new WtE build-outs, including a USD 201 million plant broken ground in southwestern Hanoi in May 2026 (2,000 tonnes/day, 45 MW), move the chain toward higher-capex, technology-led treatment. That, in turn, increases demand for reliable feedstock contracts, modern transfer stations, and emissions-compliance services.
Competitive Landscape
The sector remains moderately fragmented but is tilting toward consolidation as EPR compliance, emission norms, and capital intensity weed out under-capitalized operators. Top players such as Vietnam Waste Solutions, URENCO, and CITENCO are investing in thermal treatment, optical sorting, and digital fleet management to keep pace with regulatory tightening. Public-private partnerships dominate large assets, including Hanoi’s Nam Son and Ho Chi Minh City’s forthcoming WtE plants, which all carry ticket sizes above USD 200 million. Foreign developers bring turnkey plants and maintenance know-how, while domestic firms contribute land rights and local permitting.
Digital disruptors are entering via route-optimization software and blockchain-based traceability tools, enhancing customer satisfaction and regulatory reporting. The informal sector, accounting for over 30% of waste collection, is gradually being integrated through micro-franchise models and social-enterprise tie-ups backed by UNDP funding. Specialized niches, medical waste, e-waste, and biomass-to-fertilizer present high-margin pockets because technical barriers limit competition. As larger firms internalize multiple treatment lines, the Vietnam waste management market will likely settle into an oligopolistic structure, though regional cooperatives will persist in remote provinces.
Vietnam Waste Management Industry Leaders
-
CITENCO
-
URENCO (Urban Environment Company Hanoi)
-
INSEE Ecocycle
-
Vietnam Waste Solutions
-
Vietstar Environment
- *Disclaimer: Major Players sorted in no particular order
Market Opportunities and Future Outlook
The operationalization of EPR under Decree 110/2026/ND-CP (effective May 25, 2026) creates direct whitespace for auditable collection, sorting, and recycling services that can integrate with the National EPR Information System. This benefits scale operators and specialized service providers that can document material flows, certify treatment outcomes, and structure producer-funded programs, particularly for packaging and electronics where compliance reporting and traceability carry commercial weight.
Investment in waste-to-energy also expands the addressable market for integrated collection-to-treatment offerings, along with EPC, O&M, and emissions-control supply chains linked to large plants. In 2026, several projects moved into construction or permitting milestones, including the May 2026 groundbreaking of Hanoi's USD 201 million WtE facility (2,000 tonnes/day, 45 MW), June 2026 construction of a USD 72.8 million plant in Vinh Long (650 tonnes/day, 13 MW) led by Amaccao Group, and June 2026 progress on a WtE project in Gia Lai (USD 60.7 million). These additions raise demand for upstream reliability, including transfer stations, multi-district concessions, and source-separation programs, so plants can secure stable calorific value and reduce contamination-related downtime.
Recent Industry Developments
- June 2026: The Ministry of Agriculture and Environment issued Circular 24/2026/TT-BNNMT to guide implementation of Decree 110/2026/ND-CP on EPR-related recycling and waste-treatment responsibilities. The guidance tightens operating requirements around reporting and compliance procedures, increasing the need for traceable collection and certified downstream treatment partners.
- December 2025: URENCO, Vietcycle, KORA, and Deahan signed an MOU to promote the establishment of a joint venture and develop a plastic-waste sorting station project. The initiative supports modernization of domestic plastic sorting and can improve feedstock quality for formal recyclers and co-processing users, reinforcing the shift from fragmented informal recovery toward structured value chains.
- May 2024: Circular 35/2024/TT-BTNMT was issued to standardize key procedures for municipal solid waste management. Standardization at the municipal level supports consistent tender specifications for collection and treatment services and raises the baseline for service performance and monitoring.
Research Methodology Framework and Report Scope
Market Definition and Coverage
For this study, the Vietnam waste management market is measured as the revenue generated from organized services that handle waste after it is created, including collection, transport, sorting, treatment, recycling, and final disposal within Vietnam.
Scope exclusions: This sizing does not count informal waste picking income or the resale value of recovered materials unless it is captured as part of an accountable waste service transaction.
Segmentation Overview
- By Source
- Residential
- Commercial (retail, office, etc.)
- Industrial
- Medical (Health and Pharmaceutical)
- Construction & Demolition
- Others (institutional, agricultural, etc)
- By Service Type
- Collection, Transportation, Sorting & Segregation
- Disposal / Treatment
- Landfill
- Recycling & Resource Recovery
- Incineration & Waste-to-Energy
- Others (Chemical Treatment, Composting, etc.)
- Others (Consulting, Audit & Training, etc.)
- By Waste Type
- Municipal Solid Waste
- Industrial Hazardous Waste
- E-waste
- Plastic Waste
- Biomedical Waste
- Construction & Demolition Waste
- Agricultural Waste
- Other Specialized Waste (radio active, etc)
- By Geography
- Ho Chi Minh City
- Hanoi
- Da Nang
- Rest of Vietnam
Data Sources, Market Sizing, and Validation
Desk Research
Desk work started with building a fact base on Vietnam waste volumes, policy direction, and infrastructure status, so the later model inputs stayed realistic. We reviewed public sources such as Vietnam Ministry of Natural Resources and Environment publications, General Statistics Office releases, provincial environmental reports, and national legal documents on solid waste and extended producer responsibility.
To cross-check activity levels, we also referenced sources like customs and trade statistics for waste-related equipment where relevant, international databases such as World Bank indicators, and peer reviewed journal articles on landfill, incineration, and recycling performance in Vietnam. Company annual reports, investor decks, and credible local press helped map service coverage and common pricing logic. For hard-to-find context such as corporate structures and financial snapshots, a paid company intelligence database and a shipment-level import-export database were used selectively. These examples are not exhaustive, and additional public materials were used for data collection, validation, and research clarification.
Primary Interviews and Surveys
Primary work was used to validate how volumes move through the system and how pricing is typically applied across collection, treatment, recycling, and disposal. Interviews covered service operators, facility managers, municipal stakeholders, and industry experts across key cities and industrial corridors, so gaps from desk sources could be closed and assumptions could be checked before finalizing the model.
Distribution of primary research fieldwork respondents
| Company type | Respondent position |
|---|---|
| Top tier: 30% | CXOs: 13% |
| Mid tier: 53% | Functional/Unit leaders: 30% |
| Smaller Players: 17% | Managers: 57% |
Market-Sizing & Forecasting
Sizing was built using a top-down approach where national and city level waste generation indicators are translated into managed volumes by applying realistic collection and treatment shares, then converted into value using service price ranges in local currency. To keep the model practical, the value side was structured around a few repeatable drivers, including municipal solid waste generation, industrial output tied to waste intensity, regulated hazardous waste handling needs, treatment mix split between landfill, incineration, and recycling, and utilization levels at larger facilities.
Once the top line was formed, selective bottom-up checks were used so the totals did not drift from on-the-ground realities. These checks included sample operator capacity and throughput, typical contracts seen in large municipalities, and sanity checks of implied revenue per ton against interview ranges. Where bottom-up signals were missing for smaller provinces, gaps were handled by using proxy pricing and service penetration levels from comparable areas, then re-tested with experts.
Forecasting relied mainly on scenario analysis supported by trend lines for urbanization, industrial expansion, and policy enforcement. Pricing was moved forward using expected cost inflation and technology mix changes. Each scenario was reviewed with primary respondents, so the final forecast reflects an achievable base case rather than an extreme assumption set.
Data Validation & Update Cycle
Outputs were validated through several layers of checks, starting with internal consistency tests across volumes, treatment shares, and implied unit pricing, then followed by comparisons against independent signals such as facility expansions, policy milestones, and municipal spending direction. When a number looked out of pattern, the assumption was traced back to the input and either corrected or re-grounded with another primary touchpoint.
Before sign-off, the model and write-up went through multi-step analyst reviews so calculation logic, currency conversions, and growth drivers aligned. The report is refreshed annually, and interim updates are triggered when material events occur such as policy shifts, major facility commissioning, or sudden cost shocks. Right before delivery, a final review pass is completed so clients receive the most current view available.
Mordor Intelligence's Vietnam Waste Management Market Study Market Size Measured Against Other Published Estimates
Published market sizes for Vietnam waste management often vary because the counting boundaries and pricing logic are not always aligned, even when the topic name looks the same. Differences usually come from what gets counted as waste services versus recovered-material value, how informal activity is treated, and which year and exchange rate timing is used to convert local pricing into USD.
Refresh cadence and currency timing matter a lot here because service fees are commonly set in local currency and then adjusted with cost inflation, tipping fees, and contract renewals over time. This is why Mordor Intelligence ties the model to a consistent annual refresh and re-checks implied USD-per-ton levels against current local ranges before final totals are locked.
Benchmark comparison
| Source | Market Size | Gaps in Research Methodology |
|---|---|---|
| Mordor Intelligence | USD 2.21 B (2025) | |
| Global Consultancy A | USD 6.42 B (2024) | Likely includes a wider value boundary that can fold in broader environmental services and recovered-material value, and it may also apply different exchange-rate timing and inflation passthrough when converting local fees into USD. |
| Research Publisher B | USD 2.08 B (2024) | Uses a different base year and forecast window, and the estimate can shift if informal collection is partially counted or if treatment mix and unit prices are applied at a more aggregated national level without city-level validation. |
The spread in the table mainly comes from boundary choices and the timing of price and currency conversion rather than a single demand indicator. By keeping the sizing tied to managed waste volumes and service revenues, and then checking the implied pricing against what operators describe as workable, the final number stays traceable to clear inputs that can be reviewed and repeated.
Key Questions Answered in the Report
How large is the Vietnam waste management market in 2026?
It is valued at USD 2.36 billion in 2026 and is projected to reach USD 3.26 billion by 2031.
What is the expected CAGR for Vietnam’s waste sector through 2031?
The market is forecast to grow at a 6.71% CAGR between 2026 and 2031.
Which Vietnamese city generates the most waste today?
Ho Chi Minh City tops the list, handling roughly 14,000 tons of solid waste each day.
Which service category is expanding the fastest?
Recycling and resource recovery is projected to post the highest 8.02% CAGR to 2031.