
Market Overview
| Study Period | 2021 - 2031 |
|---|---|
| Market Size (2026) | USD 296.82 Billion |
| Market Size (2031) | USD 331.56 Billion |
| Growth Rate (2026 - 2031) | 2.24% CAGR |
| Fastest Growing Market | Asia Pacific |
| Largest Market | Asia Pacific |
| Market Concentration | Medium |
Major Players *Disclaimer: Major Players sorted in no particular order Image © Mordor Intelligence. Reuse requires attribution under CC BY 4.0. | |
Toys And Games Market Analysis by Mordor Intelligence
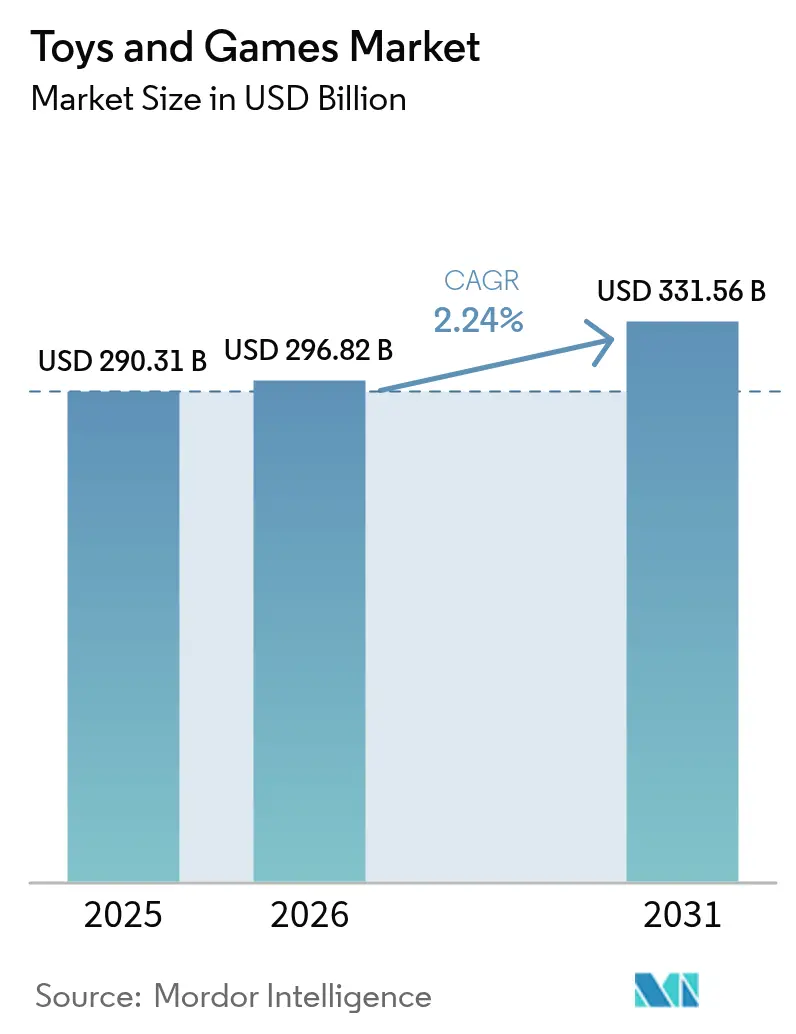
The Toys And Games Market size is projected to be USD 290.31 billion in 2025, USD 296.82 billion in 2026, and reach USD 331.56 billion by 2031, growing at a CAGR of 2.24% from 2026 to 2031.
Millennials and Generation Z, with their substantial purchasing power, are propelling the market's growth. The action figures and accessories segment thrives, buoyed by a consistent influx of captivating movie and cartoon releases. As children immerse themselves in social media and online gaming, the market witnesses further expansion. Adult collectors and premium product categories continue to enjoy steadfast demand. Today's parents prioritize toys that entertain and bolster cognitive skills, creativity, and learning. There's a pronounced global appetite for educational toys and games, emphasizing problem-solving and skill development. Given these diverse growth drivers, the toys and games market is set for sustained expansion, bridging both traditional and digital domains. Digital connectivity has redefined play, turning it into a communal experience. Online multiplayer games and interactive digital toys are cultivating global communities. Moreover, a rising trend sees adult consumers, often motivated by nostalgia and stress relief, further broadening the market. Manufacturers are keenly responding, crafting products tailored to this expanding demographic.
Key Report Takeaways
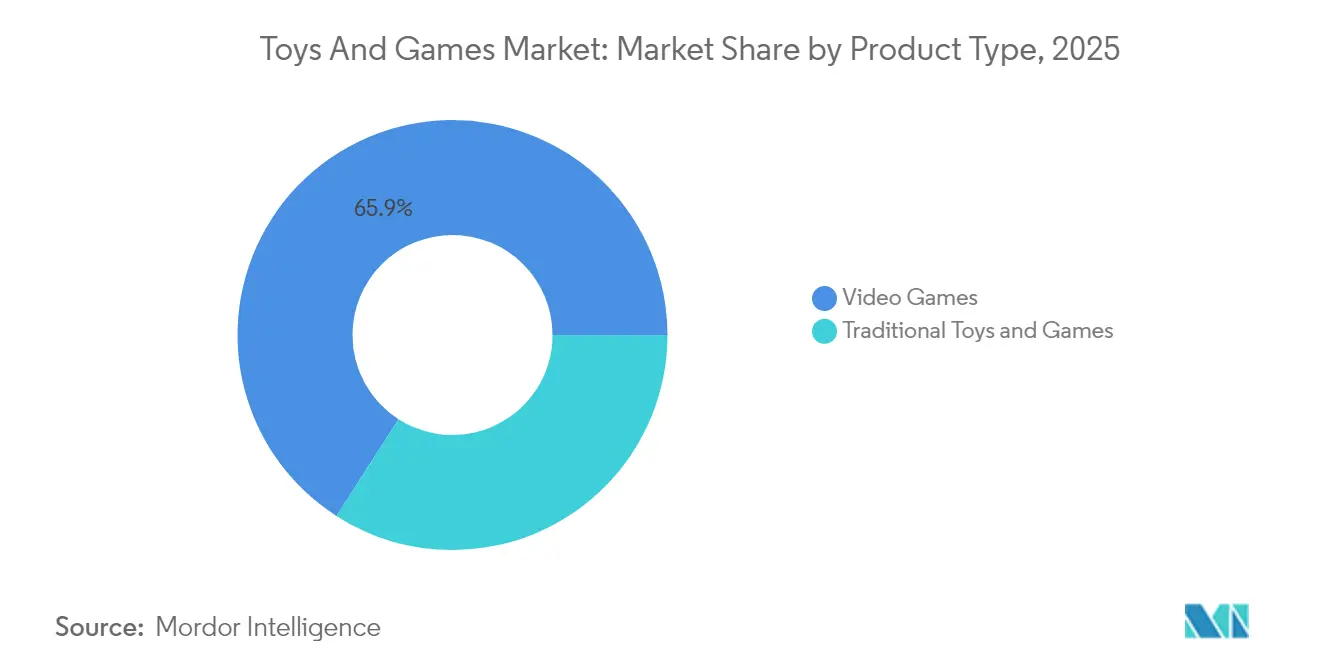
- By product type, video games led with 65.92% of toys and games market share in 2025, and are expected to grow at a CAGR of 2.65% through 2031.
- By mode of operation, electric and battery-operated items accounted for 75.92% of the toys and games market size in 2025 and are pacing at a 2.96% CAGR.
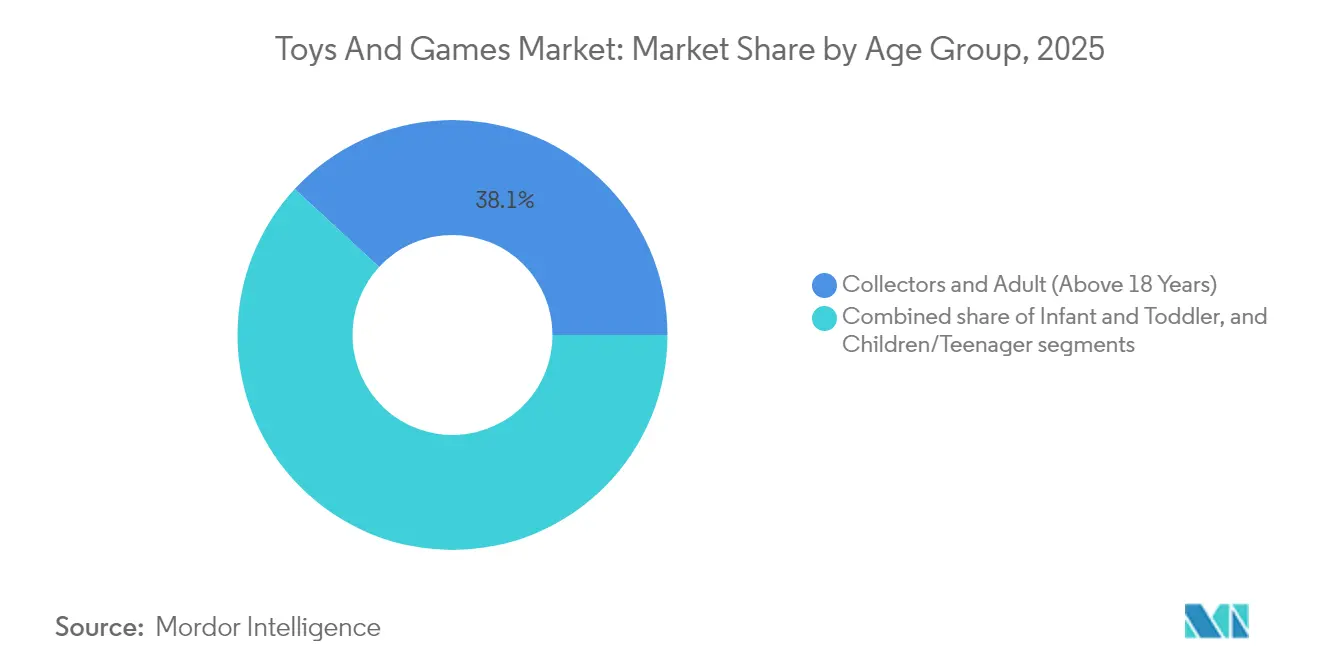
- By age group, collectors and adults aged above 18 years held 38.12% revenue share in 2025; the children/teenagers (2-18-year) cohort posts the fastest 3.31% CAGR to 2031.
- By category, mass-market ranges commanded 67.74% of the toys and games market size in 2025, whereas premium lines are forecast to climb at a 3.75% CAGR.
- By distribution channel, online stores captured 58.93% of the toys and games market share in 2025 and will grow at a 4.11% CAGR through 2031.
- By geography, Asia-Pacific contributed 34.48% revenue in 2025 and is the fastest region with a 4.52% CAGR forecast.
Note: Market size and forecast figures in this report are generated using Mordor Intelligence’s proprietary estimation framework, updated with the latest available data and insights as of 2026.
Global Toys And Games Market Trends and Insights
Drivers Impact Analysis*
| Driver | (~) % Impact on CAGR Forecast | Geographic Relevance | Impact Timeline |
|---|---|---|---|
| Hardware Innovation and Advanced Video Gaming Devices | +0.8% | Global, with concentration in North America and Asia-Pacific | Medium term (2-4 years) |
| Rising Popularity of Construction Toys | +0.6% | Global, led by Europe and North America | Long term (≥ 4 years) |
| Health and Outdoor Play Awareness | +0.4% | North America and Europe are primary, expanding to emerging markets | Medium term (2-4 years) |
| Technological Integration with Traditional Toys | +0.7% | Global, with early adoption in developed markets | Short term (≤ 2 years) |
| Sustainability and Eco-Friendly Materials | +0.3% | Europe and North America leading, global adoption following | Long term (≥ 4 years) |
| Growth of 3D Games and Graphics | +0.5% | Global, concentrated in gaming-mature markets | Medium term (2-4 years) |
| Source: Mordor Intelligence | |||
Hardware Innovation and Advanced Video Gaming Devices
The convergence of sophisticated hardware with immersive gaming experiences is transforming the smart toys and gaming market. The integration of Wi-Fi, Bluetooth, and AI technologies enables manufacturers to implement premium pricing strategies while generating recurring revenue through content updates and subscription services. The market benefits from cross-platform compatibility and cloud gaming integration, with hardware serving as an entry point to digital engagement and monetization. This trend is further strengthened by evolving family dynamics, as evidenced by the Entertainment Software Association's 2024 data showing 83% of parents engaging in video games with their children [1]Source: Entertainment Software Association, “2024 Essential Facts About the U.S. Video Game Industry,” theesa.com. The combination of advanced technology, digital connectivity, and family-oriented entertainment creates a robust foundation for market expansion.
Rising Popularity of Construction Toys
Construction toys are gaining popularity due to their appeal across age groups and integration of technology. Building blocks and Lego sets help develop cognitive abilities, improve fine motor skills, and enhance creativity while developing problem-solving and engineering capabilities. Social media platforms contribute to market growth by featuring complex construction projects, generating organic marketing reach. Advances in manufacturing processes enable complex product designs while meeting safety requirements. In May 2025, Mattel entered the market with its Brick Shop brand, increasing competition in the building set segment. These developments indicate sustained growth potential in the construction toys market, driven by educational value and technological advancement.
Health and Outdoor Play Awareness
Parents increasingly recognize that tactile, three-dimensional play experiences offer more developmental benefits compared to screen-based activities, which drives growth in the toys and games market. This trend benefits categories such as sports equipment, outdoor games, and physical building sets that enhance motor skills and social interaction. Pediatric guidelines that limit screen time for young children, along with research connecting physical play to cognitive development and emotional regulation, support this shift. The Toy Association reports that retail sales of outdoor and sports toys in the United States reached USD 4.3 billion in 2024 [2]Source: Circana, LLC, “U.S. Sales Data,” The Toy Association, toyassociation.org. The Children's Hospital of Philadelphia notes that outdoor play improves children's socialization, body awareness, imaginative play capabilities, and outdoor engagement [3]Source: Children’s Hospital of Philadelphia, “Benefits of Outdoor Play,” chop.edu. Market performance reflects this increasing preference for traditional play experiences.
Technological Integration with Traditional Toys
Digital technologies are merging with traditional toys, birthing a new category of hybrid products. These innovations, from voice recognition to AI and IoT connectivity, are enriching playtime, making it more interactive and tailored to individual preferences. Such enhancements not only boost engagement but also command premium pricing, offering unique experiences that resonate with today's tech-savvy kids and their parents. A notable instance of this evolution is Hasbro's March 2025 debut of 'Nano-mals' at the North American International Toy Fair. These pocket-sized electronic pets blend nurturing and sensory play with tech. Each Nano-mal boasts over 70 sounds, lights, and reactions, like squeaks and giggles, interacting with children and showcasing a digital "heart meter" to indicate its emotional state.
Restraints Impact Analysis*
| Restraint | (~) % Impact on CAGR Forecast | Geographic Relevance | Impact Timeline |
|---|---|---|---|
| Intense Competition from Digital and Screen-Based Entertainment | -0.9% | Global, most pronounced in developed markets | Short term (≤ 2 years) |
| Supply Chain Disruptions and Raw Material Shortages | -0.6% | Global, with acute impact on China-dependent manufacturers | Medium term (2-4 years) |
| Rising Competition from Educational Apps and E-Learning Tools | -0.4% | Developed markets primarily, expanding globally | Long term (≥ 4 years) |
| Stringent Regulatory and Safety Standards | -0.3% | Global, with varying compliance costs by region | Medium term (2-4 years) |
| Source: Mordor Intelligence | |||
Intense Competition from Digital and Screen-Based Entertainment
Digital entertainment platforms, including streaming content and social media, present a significant market restraint. The increasing time children spend on these platforms affects traditional toy engagement due to their instant gratification and social connectivity features. Digital platforms offer advantages through continuous content updates, personalized experiences, and social features that physical toys cannot easily replicate. This challenge intensifies as children develop digital literacy at younger ages, with game-based learning applications showing moderate to large effects on cognitive and social development. These factors position digital entertainment and educational apps as direct substitutes for traditional toys, limiting market growth potential.
Supply Chain Disruptions and Raw Material Shortages
Geopolitical tensions and trade policy uncertainties create persistent supply chain vulnerabilities, particularly due to China's dominance in toy manufacturing. The removal of de minimis trade provisions for low-value imports, coupled with raw material shortages in specialized plastics and electronic components, leads to increased production costs and bottlenecks during peak demand periods. Companies attempting to mitigate these risks through nearshoring face higher labor costs and infrastructure investments, while maintaining quality standards across diverse manufacturing locations requires extensive operational oversight. These combined factors significantly impact manufacturers' operational efficiency and ultimately affect product pricing and availability in the market.
*Our forecasts treat driver/restraint impacts as directional, not additive. The impact forecasts reflect baseline growth, mix effects, and variable interactions.
Segment Analysis
By Product Type: Video Games Dominate Traditional Categories
Video games dominatet he toys and games market with a 65.92% share in 2025, showcasing the industry's digital transformation. This supremacy is driven by video games' capacity to deliver continuous content updates, social connectivity, and personalized experiences, while generating recurring revenue through downloadable content and subscription services. The segment is expected to grow at a CAGR of 2.65% through 2031, supported by cloud gaming adoption, cross-platform compatibility, and integration with virtual and augmented reality technologies.
Traditional toys and games continue to thrive in the market. Limited-edition die-cast cars, for instance, highlight their intricate craftsmanship, drawing in adult collectors and hobbyists. Meanwhile, games and puzzles, bolstered by social media and family involvement, see rising popularity. This is evident in construction sets like LEGO and timeless classics such as Hasbro’s Jenga, both of which promote creativity and social bonding. The traditional segment's enduring strength is largely attributed to its premium positioning and the allure of the adult collector market, fueled by nostalgia and a growing trend towards collectibles.



By Mode of Operation: Electric Dominance Reflects Tech Integration
Electric and battery-operated toys dominate the market with a 75.92% share in 2025 and are expected to grow at a 2.96% CAGR through 2031, driven by consumer demand for interactive play experiences. These toys effectively integrate sensors, connectivity features, and artificial intelligence to adapt to user behavior and deliver personalized interactions. The integration of IoT connectivity and voice recognition enables premium pricing, while creating opportunities for continuous engagement through software updates and content expansion. This technological advancement has expanded beyond traditional electronic toys to include motorized construction sets, interactive dolls, and autonomous vehicles.
While manual toys hold a smaller market share, they maintain their significance through premium craftsmanship, educational value, and sustainability appeals. These products achieve higher margins through artisanal manufacturing, organic materials, and limited production runs, creating exclusivity and collectible value. The manual segment benefits from increasing concerns about screen time and parents' preference for tactile, imaginative play experiences that develop motor skills without digital dependency. Manufacturers focus on sustainable materials and traditional craftsmanship, positioning manual toys as premium alternatives to electronic products for consumers seeking authentic and environmentally responsible options.
By Age Group: Adult And Collectors Drive Premium Growth
Adult collectors and enthusiasts above 18 years dominate the market with a 38.12% share in 2025, demonstrating the industry's successful expansion beyond traditional child demographics. This segment particularly values limited edition releases, detailed craftsmanship, and products connected to nostalgic entertainment franchises, enabling premium pricing strategies. Meanwhile, children and teenagers aged 2-18 years exhibit the highest growth rate at 3.31% CAGR through 2031, driven by educational toy demand and technology integration.
The infant and toddler segment below 2 years emphasizes sensory development and safety compliance, requiring specialized materials and design considerations that create market entry barriers. The industry has evolved to create family-oriented products and multi-generational play experiences that appeal across age groups, allowing manufacturers to maximize value across demographic segments while meeting specific needs, from educational toys for children to collectibles for adults.
By Category: Premium Segment Outpaces Mass Market
Mass market toys dominate with a 67.74% market share by leveraging broad distribution networks, competitive pricing, and efficient manufacturing processes to serve price-sensitive consumers through volume-driven retail channels. The segment's success relies on strategic licensing partnerships with entertainment properties and sophisticated supply chain management to maintain quality standards while optimizing costs. However, increasing competition from private label products and direct-to-consumer brands has prompted mass market manufacturers to incorporate premium design elements and sustainable materials to defend their market position.
Premium toys, while holding a smaller market share, are projected to grow at a 3.75% CAGR through 2031, outperforming the mass market segment through superior craftsmanship, limited availability, and strong appeal to adult collectors. These manufacturers capitalize on direct-to-consumer sales channels to maintain higher margins and foster brand loyalty through personalized experiences and exclusive access to limited edition products. In advanced regions, rising spending power is driving consumers to seek out unique experiences, eco-friendly materials, and exclusive designs, all of which offer a sense of prestige and collectible allure.
By Distribution Channel: Online Transformation Accelerates
Online stores dominate the toy retail market with a 58.93% share in 2025 and projected 4.11% CAGR through 2031, driven by their ability to offer extensive product selections, competitive pricing, and convenient shopping experiences. The e-commerce platforms and direct-to-consumer strategies enable manufacturers to achieve higher margins through direct sales while collecting consumer data for product development and targeted marketing, particularly benefiting specialty and collectible products that face limited physical shelf space in traditional retail.
Offline stores maintain their market position by delivering unique tactile experiences, immediate product availability, and social shopping opportunities, complemented by experiential elements such as play areas, demonstration zones, and interactive displays. Physical retailers are adapting through omnichannel strategies that combine online convenience with in-store services, while specialty toy stores differentiate themselves through expert product curation, personalized customer service, and community events that build customer loyalty and support premium pricing strategies.
Geography Analysis
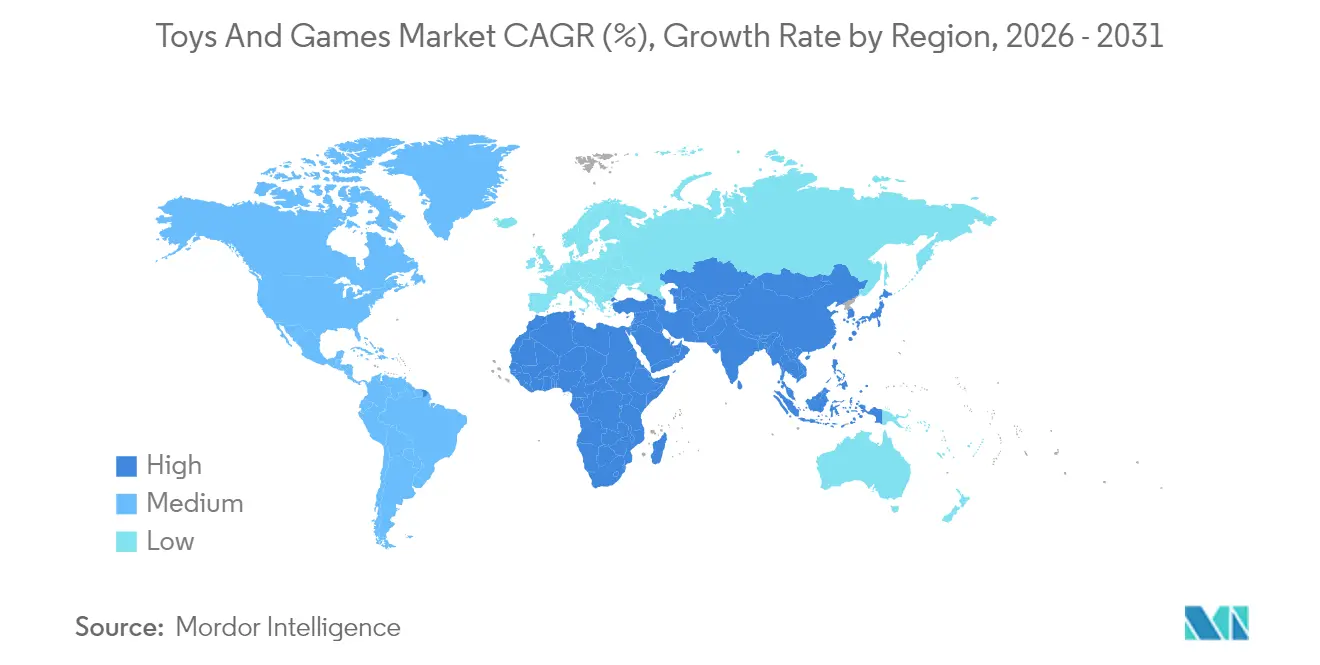
Asia-Pacific dominates the global toy market with a 34.48% share in 2025 and is expected to grow at the highest CAGR of 4.52% through 2031. This growth is primarily driven by rapid urbanization, technological innovation, and supportive government policies promoting domestic manufacturing capabilities. China's dual role as the world's largest toy manufacturer and a significant consumer market creates unique market dynamics, while Southeast Asia emerges as a vital growth engine for the industry.
North America maintains its position as the world's largest toy consumer market, with Los Angeles established as the global hub for toy design and corporate headquarters. The region's market strength is underpinned by robust intellectual property protection, advanced retail infrastructure, and high consumer spending power, enabling the growth of premium product categories and the rapid adoption of technological innovations.
The European toy market exhibits moderate growth characterized by premiumization trends and the integration of artificial intelligence in products. The region's stringent safety regulations and sustainability initiatives create competitive advantages for compliant manufacturers while establishing higher entry barriers. European consumers show a marked preference for educational and STEM toys, reflecting the region's focus on learning-oriented products.

Regulatory Landscape
Toy safety compliance continues to tighten across major consuming regions, which is lifting testing, documentation, and labeling requirements for both traditional and connected toys. In the European Union, Regulation (EU) 2025/2509 on the safety of toys was adopted on November 26, 2025, entered into force on January 1, 2026, and sets an application date of August 1, 2030. The shift from a Directive to a Regulation supports more uniform enforcement across Member States and adds new compliance obligations, including a digital product passport.
In the United States, toy safety remains governed by CPSIA, with ASTM F963-23 as a binding mandatory safety specification, and product-specific rules continuing to expand. The US Consumer Product Safety Commission (CPSC) published a final rule on December 12, 2025 establishing mandatory safety requirements for water bead toys, reflecting heightened attention to ingestion hazards and chemical exposure risks. This also increases the need for third-party testing and tighter compliance controls, particularly for small parts and novel materials.
Value Chain Analysis
The toys and games value chain runs from concept and industrial design, IP licensing and content development, and raw materials and components (plastics, textiles, paper/board, coatings, batteries and electronics), to tooling, manufacturing and assembly, and safety testing and certification. It then flows through global logistics into wholesale, retail, and direct-to-consumer channels. Licensing and entertainment tie-ins shape upstream planning for action figures, construction sets, and collectibles, while the video game segment adds software publishing, platform distribution, live operations, and payment ecosystems as additional value-capture layers.
Sourcing and manufacturing are also being rebalanced to reduce exposure to tariff volatility and single-country concentration, with large manufacturers shifting portions of capacity beyond China into countries such as Vietnam, India, Mexico, Indonesia, and Thailand. Cost pressure has pushed product engineering toward material and packaging simplification, supported by Hasbro actions disclosed in July 2025, including redesign and retooling changes intended to simplify materials and packaging. Distribution is increasingly influenced by online-first discovery and faster replenishment cycles, including social commerce momentum, which increases forecasting and domestic warehousing coordination responsibilities for brands and their logistics partners.
Competitive Landscape
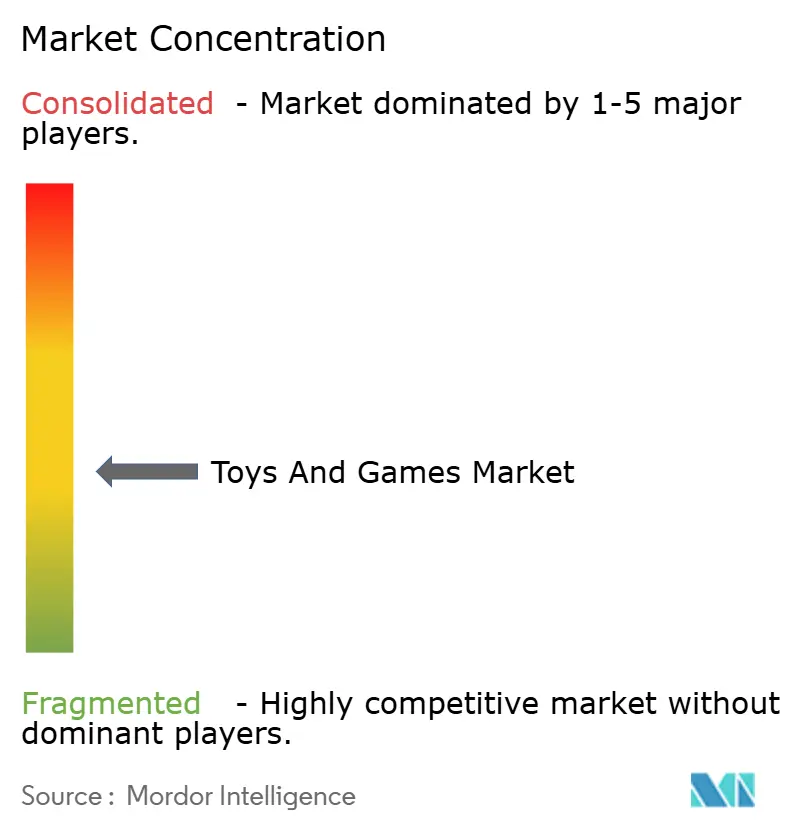
The toys and games market exhibits moderate fragmentation, with both established corporations and specialized companies gaining market share through distinct positioning. Companies like Mattel Inc., Hasbro Inc., and Spin Master Corp.among others, maintain market leadership through their global presence, intellectual property portfolios, and established retail networks. Smaller companies achieve success by emphasizing innovation, specializing in specific categories, and implementing direct-to-consumer strategies that bypass traditional distribution channels.
The market structure encompasses various consumer segments, ranging from mass-market children's toys to premium adult collectibles. Each segment requires specific expertise in design, manufacturing, distribution, and marketing. This fragmentation creates entry opportunities, particularly in emerging categories such as AI-enabled toys and sustainable products, where established companies face adaptation challenges to meet changing consumer preferences.
Companies differentiate themselves through intellectual property licensing, technology integration, and sustainability initiatives. Strategic partnerships play an essential role in market expansion, as evidenced by Cobi's partnership with Hobbycraft in September 2024, which initiated with a soft launch of Cobi's core products.
Toys And Games Industry Leaders
Mattel Inc.
Hasbro, Inc
Funskool India Ltd.
TOMY Company, Ltd.
Spin Master Corp.
- *Disclaimer: Major Players sorted in no particular order

Market Opportunities and Future Outlook
Regulatory and compliance modernization is creating demand for solutions that reduce the burden of safety documentation and traceability, particularly for connected and battery-operated toys that hold a large share of unit value in many markets. The EU adoption of Regulation (EU) 2025/2509, including its digital product passport requirement and enhanced focus on connected-toy compliance, is raising the value of test-ready designs, stronger materials transparency, and digital compliance workflows for global manufacturers selling into Europe.
Supply chain diversification and regional production investment are also opening opportunities for new manufacturing clusters and suppliers outside incumbent hubs. Capital deployment toward process innovation and scalability is visible in company actions such as The LEGO Group opening its Kornmarken Campus in Billund, Denmark in June 2026 as a dedicated manufacturing innovation facility, and expansion activity including LEGO’s September 2025 capacity expansion at its Nyiregyhaza, Hungary factory. At the same time, export-oriented moves by regional players are increasing vendor diversification, as illustrated by Veva Toys Global announcing a five-year investment plan in April 2026 to scale production and target exports to multiple geographies, supporting shorter lead-time programs for brands and retailers.
Recent Industry Developments
- May 2026: Mattel expanded its Mattel Brick Shop portfolio with seven new building sets tied to automotive brands including Lamborghini, Audi, Toyota, Aston Martin, and Chevrolet. The additions broaden Mattel's footprint in the construction segment and deepen licensed partnerships that help compete for both kid and adult builder spend.
- February 2026: Paramount and Mattel announced a multi-year global licensing partnership to develop and market Teenage Mutant Ninja Turtles products beginning in 2027. The agreement reinforces the industry shift toward franchise-led product pipelines that can extend across toys, collectibles, and games with synchronized content calendars.
- September 2024: Cobi partnered with Hobbycraft, beginning with a soft launch of Cobi core products through the retailer. This strengthened Cobi's access to offline specialty retail and supports broader reach for construction sets where in-store visibility and staff-led merchandising can influence purchase decisions.


Research Methodology Framework and Report Scope
Market Definition and Coverage
This market covers the value of toys and games sold to end users, counted in revenue terms across physical toys and game products, along with video game products, across online and offline channels.
Scope exclusions: We exclude gambling and betting activities, and we also exclude secondhand resale values to avoid double counting of the same units.
Segmentation Overview
- By Product Type
- Traditional Toys and Games
- Action Figures and Accessories
- Construction
- Dolls and Accessories
- Games and Puzzels
- Model Vehicles
- Other Product Types
- Video Games
- Traditional Toys and Games
- By Mode of Operation
- Manual
- Electric/Battery Operated
- By Age Group
- Infant and Toddler (Below 2 Years)
- Children/Teenager (2-18 Years)
- Collectors and Adult (Above 18 Years)
- By Category
- Mass
- Premium
- By Distribution Channel
- Offline Stores
- Online Stores
- By Geography
- North America
- United States
- Canada
- Mexico
- Rest of North America
- Europe
- Germany
- United Kingdom
- Italy
- France
- Spain
- Netherlands
- Poland
- Belgium
- Sweden
- Rest of Europe
- Asia-Pacific
- China
- India
- Japan
- Australia
- Indonesia
- South Korea
- Thailand
- Singapore
- Rest of Asia-Pacific
- South America
- Brazil
- Argentina
- Colombia
- Chile
- Peru
- Rest of South America
- Middle East and Africa
- South Africa
- Saudi Arabia
- United Arab Emirates
- Nigeria
- Egypt
- Morocco
- Turkey
- Rest of Middle East and Africa
- North America
Data Sources, Market Sizing, and Validation
Desk Research
For desk research, we start by building a clear demand and supply context for toys and games, before any modeling is done. Public sources such as UN Comtrade trade statistics, World Bank macro indicators, OECD household consumption series, and US Census Bureau retail and e-commerce releases help us form baseline signals for spend, channel shifts, and trade flows.
To make these inputs usable, they are paired with company annual reports, investor presentations, earnings call transcripts, and official trade association publications that discuss category performance and seasonality (holiday peaks, back-to-school, and major release cycles). We also refer to a paid subscription for company financials and intelligence, plus a patent database to understand innovation intensity in key product areas. These sources are not exhaustive, and many other public documents were also checked to collect data, validate assumptions, and clarify gaps.
Primary Interviews and Surveys
Primary work is used to pressure test what we saw in published data and to fill in missing details that are rarely stated clearly in public sources. We speak with manufacturers, distributors, large retailers, and category managers, and then triangulate their inputs across APAC, EMEA, and the Americas so that channel mix, pricing behavior, and product lifecycle effects are not overgeneralized.
Distribution of primary research fieldwork respondents
| Company type | Respondent position | Region |
|---|---|---|
| Top tier: 32% | CXOs: 14% | APAC: 49% |
| Mid tier: 50% | Functional/Unit leaders: 36% | EMEA: 29% |
| Smaller Players: 18% | Managers: 50% | Americas: 22% |
Market-Sizing & Forecasting
Market sizing is built using a top-down approach where household spend capacity, retail sales indicators, and trade movement signals are used to reconstruct the addressable demand pool for toys and games by major region, before it is normalized to a consistent USD basis. Once that view is set, it is corroborated with selective bottom-up approximations, such as sampling supplier revenues, checking channel splits from retailer discussions, and validating implied average selling prices against what buyers report.
Key model inputs include consumer discretionary spending trends, toy and game price inflation, online versus offline mix, major product launch timing (especially for video game hardware and software cycles), and seasonal shipment patterns around holidays. In markets where public data is thin, we handle gaps by using proxy indicators like import reliance, retail category growth commentary, and conservative share assumptions that are re-tested in interviews.
For forecasting, scenario analysis is used so that different paths for inflation, consumer sentiment, and channel mix can be applied and reviewed with experts, and then a base case is selected when the variables line up consistently across regions. The final forecast is kept practical so it can be traced back to the same drivers that were used to size the current market.
Data Validation & Update Cycle
Validation is done through repeated cross-checks, where outputs are compared against independent signals like retail sales direction, trade value trends, and the implied per-capita spend range by region. When a variance looks unusual, the assumptions are revisited, and the analyst re-contacts sources if the gap cannot be explained by seasonality, currency movement, or one-time launch effects.
Before sign-off, the model and narrative go through a multi-step internal review so calculation logic, units, and conversions are consistent throughout. Reports are refreshed annually, and interim updates are triggered when material events occur, such as large pricing shifts, major platform cycles, or policy changes affecting imports. Right before delivery, a final pass is completed so clients receive the most current view available.
Mordor Intelligence's Toys and Games Market Size Compared Against Other Published Estimates
It is normal to see different market sizes for toys and games because firms do not always count the same product boundaries, channels, and currency timing in the same way. The year used, whether figures are reported in nominal or real terms, and how video games are treated within the total can each move the final number.
By tracking channel mix, refreshing currency conversion timing, and separating video game cycles from steady toy demand, Mordor Intelligence keeps the estimate aligned to a repeatable demand pool rather than a blended total that shifts with one-off release years.
Benchmark comparison
| Source | Market Size | Gaps in Research Methodology |
|---|---|---|
| Mordor Intelligence | USD 290.31 B (2025) | |
| Global Consultancy A | USD 357.59 B (2025) | Often uses a broader revenue perimeter, which can lift totals when adjacent entertainment categories, wider country coverage, or higher assumed price progression are included in the same year. |
| Trade Journal B | USD 287.00 B (2025) | May rely on a narrower compilation approach with limited validation of channel splits and weaker adjustment for exchange-rate timing, which can slightly pull down global totals. |
The comparison shows that most of the spread comes from what is counted inside the boundary and how pricing and currency are handled for the same year. A clear scope, practical demand indicators, and re-checks with market participants help keep the final number explainable, and the steps can be repeated when new data points appear.


Key Questions Answered in the Report
What is the current size of the toys and games market?
The toys and games market stands at USD 296.82 billion in 2026 and is projected to reach USD 331.56 billion by 2031.
Which product category holds the largest revenue share?
Video games dominate with 65.92% of toys and games market share in 2025.
How fast is the online channel growing?
Online stores are forecast to grow at a 4.11% CAGR through 2031, outpacing offline formats.
Which region is projected to grow the fastest?
Asia-Pacific leads with a 4.52% CAGR to 2031, driven by rising disposable income and supportive manufacturing policies.
How are companies addressing sustainability concerns?
Leading brands shift to recycled or plant-based plastics, adopt carbon-neutral facilities and introduce minimal packaging designs to satisfy eco-conscious consumers.
Page last updated on:




