North America Footwear Market Size and Share
Market Overview
| Study Period | 2021 - 2031 |
|---|---|
| Forecast Data Period | 2026 - 2031 |
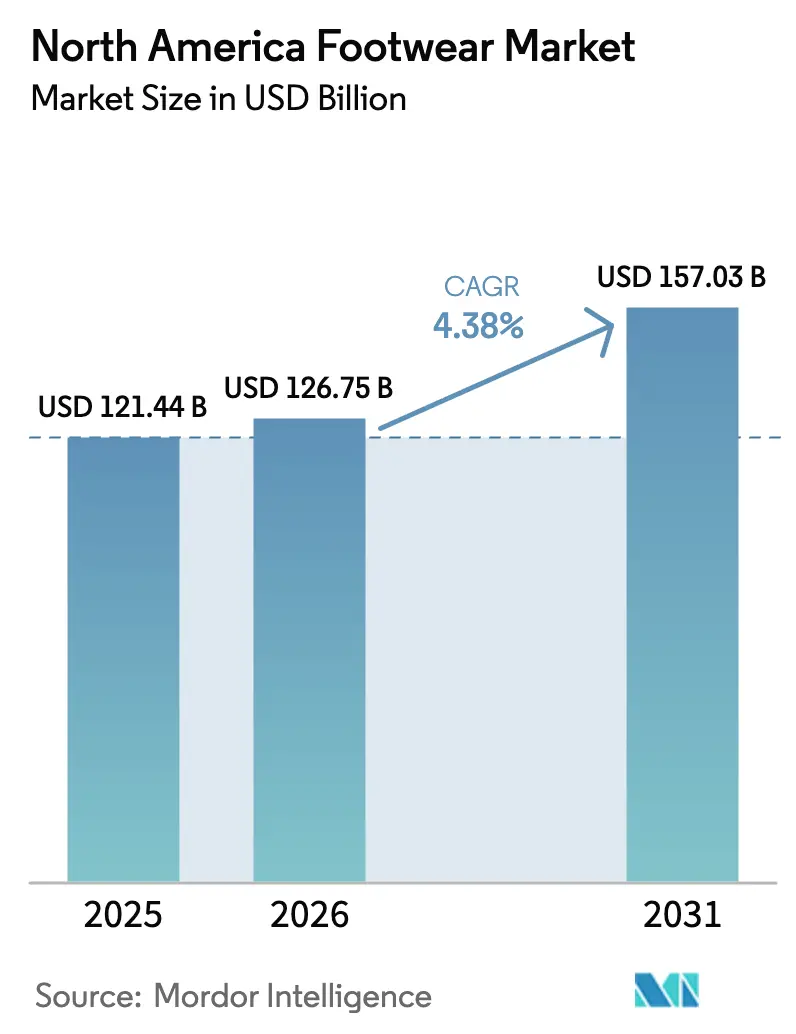
| Base Year Market Size (2025) | USD 121.44 Billion |
| Market Size (2026) | USD 126.75 Billion |
| Market Size (2031) | USD 157.03 Billion |
| Growth Rate (2026 - 2031) | 4.38% CAGR |
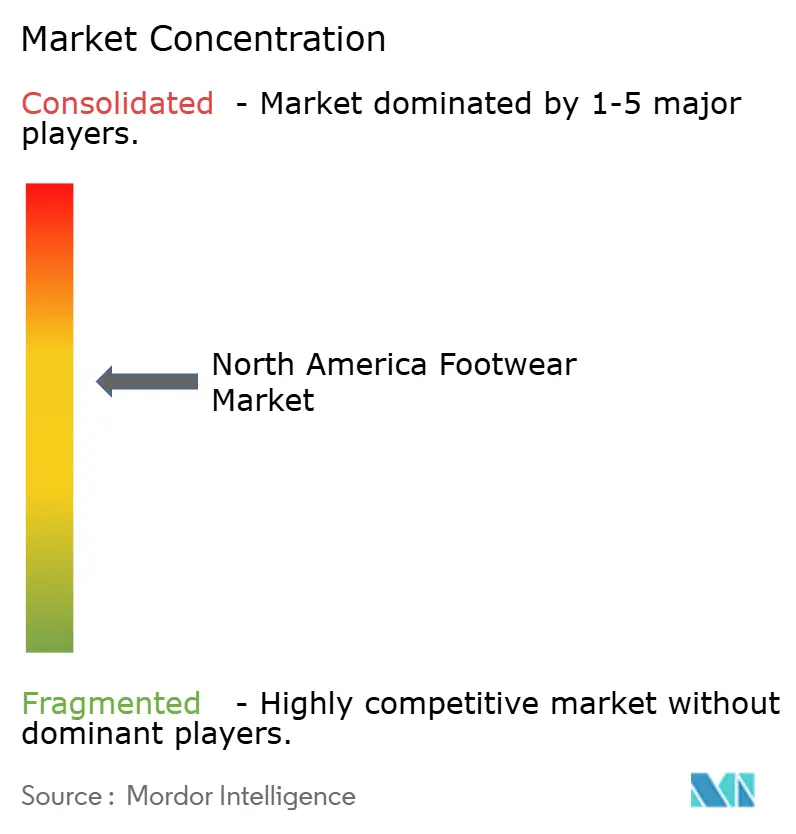
| Market Concentration | Medium |
Major Players
*Disclaimer: Major Players sorted in no particular order Image © Mordor Intelligence. Reuse requires attribution under CC BY 4.0. |
|
North America Footwear Market Analysis by Mordor Intelligence
The North America footwear market size is expected to grow from USD 121.44 billion in 2025 to USD 126.75 billion in 2026 and is forecast to reach USD 157.03 billion by 2031 at 4.38% CAGR over 2026-2031. Market momentum stems from premiumization, technological upgrades, and sustainability programs that lift average selling prices even though per-capita consumption is stable. Athletic lines retain high visibility, but their market share in 2024 and growth rates signal maturity and spur brands to add smart-fit features, eco-materials, and fashion-forward silhouettes. Digital channels expand quickly, supported by omnichannel investments that shorten delivery times and enable customization at scale. Regulatory pressure on materials, patent filings around automated manufacturing and fluid-adaptive midsoles, and rising female and youth participation in sport all contribute to a steady pipeline of differentiated products. Supply-chain resilience, anti-counterfeit enforcement, and near-shoring to Mexico provide additional levers for value creation in the North America footwear market.
Key Report Takeaways
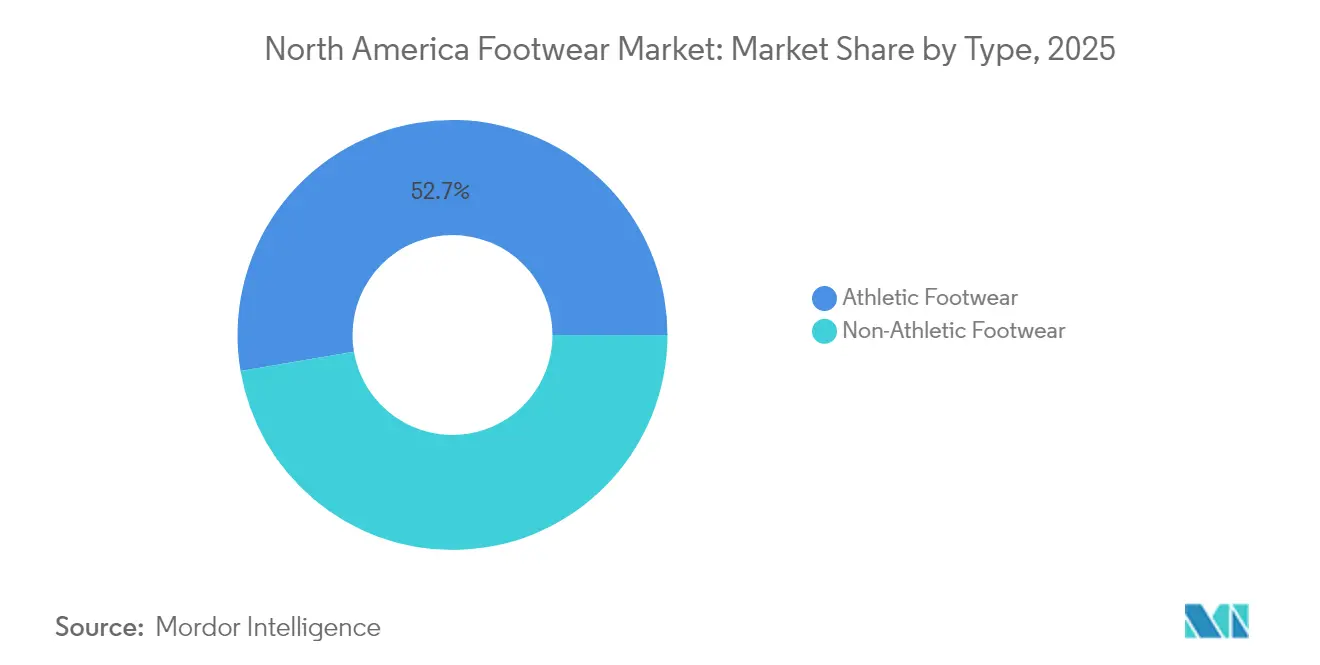
- By type, athletic footwear led with 52.68% of the North America footwear market share in 2025 and advances at a 4.57% CAGR to 2031.
- By product type, shoes and boots commanded 52.02% of the market share in 2025, while flats delivered the fastest 4.76% CAGR through 2031.
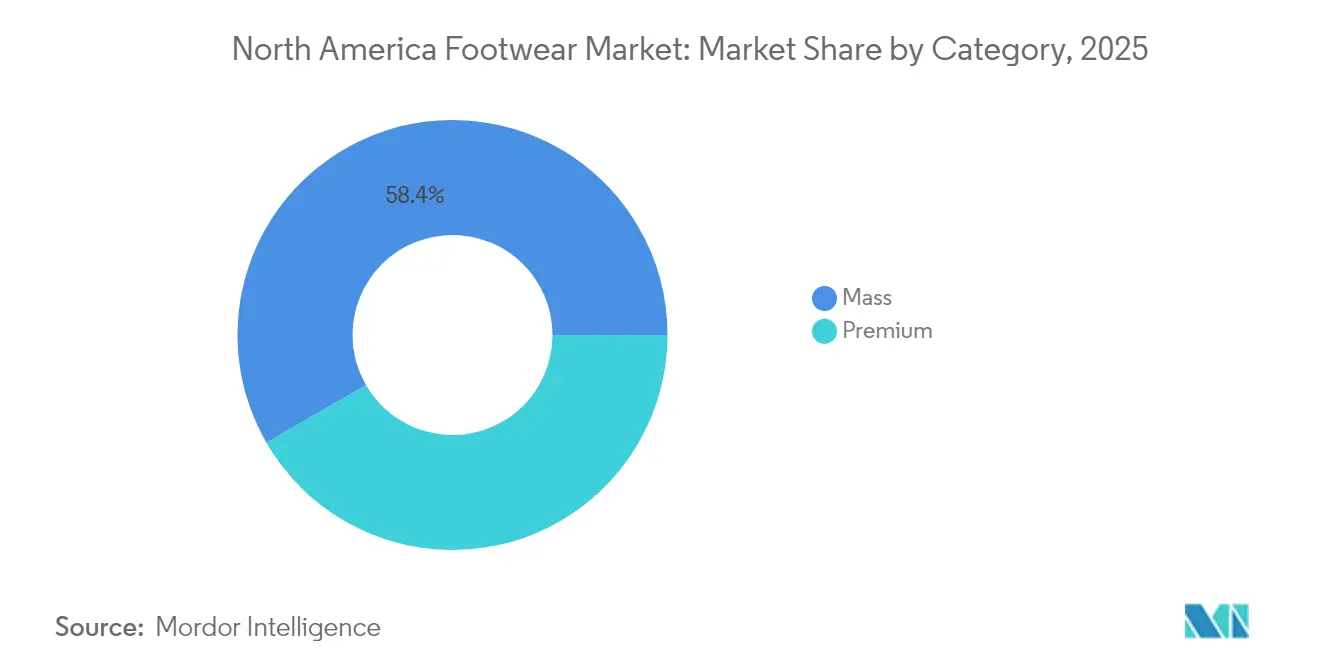
- By category, the mass segment held 58.35% of 2025 revenue; the premium tier grows at a 5.22% CAGR in 2026-2031.
- By end user, women accounted for 48.21% of 2025 sales, whereas the kids/children segment posts a 4.93% CAGR to 2031.
- By distribution channel, specialty stores captured 58.12% of the 2025 share, yet online retail stores climbed at a 5.53% CAGR over the forecast period.
- By geography, the United States represented 79.42% of the 2025 value, while Mexico records the highest 5.77% CAGR through 2031.
Note: Market size and forecast figures in this report are generated using Mordor Intelligence’s proprietary estimation framework, updated with the latest available data and insights as of 2026.
Worldwide, activity is shaped by contributions from multiple regions, with North america representing one of the more structurally developed among them. The global report on footwear market by Mordor Intelligence reflects how these regional layers combine into a single system.
North America Footwear Market Trends and Insights
Drivers Impact Analysis*
| Drivers | (~) % Impact on CAGR Forecasts | Geographic Relevance | Impact Timeline |
|---|---|---|---|
| Strong Demand For Customized and Personalized Footwear | +0.8% | North America, with early adoption in US urban markets | Medium term (2-4 years) |
| Influence of Social Media Platforms and Celebrity Endorsements | +0.6% | North America, strongest in US and Canada | Short term (≤ 2 years) |
| Favorable Government Initiatives to Increase Sports Participation Rate | +0.4% | US and Canada, federal and state level programs | Long term (≥ 4 years) |
| Sustainability and Ethical Production | +0.7% | North America & EU, regulatory compliance driven | Medium term (2-4 years) |
| Rising Health and Wellness Trends | +0.9% | North America, accelerated post-pandemic adoption | Medium term (2-4 years) |
| Technological Advancements in Product Innovation | +1.1% | North America, R&D hub concentration | Long term (≥ 4 years) |
| Source: Mordor Intelligence | |||


Strong Demand For Customized and Personalized Footwear
The growing demand for customization is transforming manufacturing processes through computational design and 3D printing technologies. Nike demonstrated this shift with its February 2025 patent filing for electronic fluid support control systems, which feature adjustable foot pressure mechanisms responding to individual biomechanics. Adidas has developed automated manufacturing patents for shoe sole production that replace traditional adhesives with steam-bonding techniques, allowing customization of density and cushioning properties. The combination of 3D scanning, augmented reality, and parametric design enables the creation of user-specific products, particularly for professional and medical footwear applications. This technological integration allows manufacturers to increase profit margins while minimizing inventory risks through on-demand production. Consumer behavior supports this strategy, as customers, especially younger generations focused on individual expression and performance, are willing to pay more for customized products.
Influence of Social Media Platforms and Celebrity Endorsements
Social media platforms have turned product launches into major events, boosting demand and enhancing brand engagement. Nike leverages emotional branding and public relations in its partnerships, aiming for digital sales to constitute 30% of its total revenue by 2025. Algorithms on social media favor genuine content and user reviews, enabling new brands to capture market share via influencer partnerships and community involvement. Digital marketing's accessibility empowers smaller firms to rival industry giants, all while upholding product quality and brand integrity. This dynamic not only intensifies competition but also broadens market reach, particularly among Gen Z consumers. These younger buyers prioritize social media visibility and peer endorsements in their purchasing choices.
Favorable Government Initiatives to Increase Sports Participation Rate
Government health initiatives generate consistent demand for athletic footwear through programs promoting physical activity across demographics. The President's Council on Sports, Fitness & Nutrition's partnerships with major sports leagues in 2024 demonstrate the federal government's commitment to increasing participation rates, which directly influences footwear consumption. Youth sports participation stands at 61.1% among adolescents aged 12-17, though screen time affects activity levels, decreasing from 70.4% participation for those with ≤2 hours to 54.4% for those with ≥4 hours of daily screen time, according to the Centers for Disease Control and Prevention [1]Source: Centers for Disease Control and Prevention, “Youth Sport Participation, National Youth Fitness Survey,” cdc.gov. These figures highlight the impact of government programs in promoting active lifestyles and maintaining demand for performance footwear. Federal and state-level funding for sports facilities, equipment, and programs continues to support market growth.
Sustainability and Ethical Production
Environmental regulations and consumer awareness drive changes in materials sourcing, manufacturing processes, and product lifecycle management. OEKO-TEX certifications set standards for sustainable textile and leather production, with 2025 regulations reducing Bisphenol A limits from 100 mg/kg to 10 mg/kg and implementing PFAS restrictions at 250 µg/kg for consumer protection. The European Deforestation Regulation requires verifiable proof of origin for leather supply chains, compelling companies to implement transparent traceability systems. While this increases operational complexity, it enhances brand credibility. Companies that invest in sustainable technologies and ethical sourcing practices gain competitive advantages, as consumers demonstrate a willingness to pay higher prices for environmentally responsible products. These regulatory requirements are expected to become more stringent during the forecast period.
Restraints Impact Analysis*
| Restraints | (~) % Impact on CAGR Forecasts | Geographic Relevance | Impact Timeline |
|---|---|---|---|
| Counterfeit Products Affecting Brand Reputation | -0.7% | North America, cross-border enforcement challenges | Short term (≤ 2 years) |
| High Market Saturation and Intense Competition | -0.9% | US market, established player dominance | Medium term (2-4 years) |
| Fluctuating Raw Material Prices | -0.5% | Global supply chain, manufacturing cost volatility | Short term (≤ 2 years) |
| Supply Chain Disruptions | -0.6% | North America, Asia-Pacific manufacturing dependencies | Medium term (2-4 years) |
| Source: Mordor Intelligence | |||
Counterfeit Products Affecting Brand Reputation
Intellectual property violations undermine brand equity and consumer trust while creating safety risks that damage category credibility. U.S. Customs and Border Protection seized 19,522 shipments containing nearly 23 million counterfeit items worth over USD 2.75 billion in fiscal 2023, with wearing apparel, footwear, and accessories accounting for 28.2% of all seizures [2]Source: U.S. Customs and Border Protection, " Intellectual Property Rights Seizure Statistics", cbp.gov/. China remains the primary source of counterfeit goods, representing 65.9% of total seizure value at USD 1.81 billion, highlighting the geographic concentration of counterfeiting operations, according to the U.S. Customs and Border Protection. Recent enforcement actions include USD 1.3 billion in counterfeit goods seized in Los Angeles ports, demonstrating the scale of illegal trade that diverts revenue from legitimate manufacturers, according to U.S. Immigration and Customs Enforcement. Enhanced enforcement capabilities through technology and legislative changes address growing challenges posed by digital marketplaces and de minimis shipments.
High Market Saturation and Intense Competition
The mature North American market has shifted to a zero-sum competitive environment, where companies must capture market share from competitors to achieve growth. Nike reported an 11% decline in North American revenues to USD 4.8 billion in Q1 2025, with footwear revenues decreasing 14% to USD 3.2 billion due to cautious consumer spending and competitive pressures. Adidas saw a 19% reduction in North American sales to EUR 5,219 million in 2023, implementing conservative sell-in strategies to reduce inventory levels, though the company achieved double-digit growth in Q4 2024. These performance indicators demonstrate that established brands in saturated markets must focus on innovation and differentiation to attract consumers and maintain market position.
*Our forecasts treat driver/restraint impacts as directional, not additive. The impact forecasts reflect baseline growth, mix effects, and variable interactions.
Segment Analysis
By Type: Athletic Dominance Faces Innovation Pressure
Athletic footwear holds 52.68% of the market share in 2025 and is projected to grow at a 4.57% CAGR through 2031. This segment's dominance reflects a mature market where innovation drives value creation. Consumers increasingly incorporate athletic shoes into their daily wardrobes, extending their use beyond sports activities. Non-athletic footwear represents the remaining market share but experiences competitive pressure as athletic brands expand into casual and dress categories through hybrid designs combining performance features with traditional styles.
The July 2024 partnership between Skechers and John Deere demonstrates athletic brands' strategic expansion into specialized segments. The collaboration integrates Skechers' comfort technologies (Hands Free Slip-ins®, Arch Fit®, and Relaxed Fit®) with durable, waterproof materials designed for agricultural and construction workers. This approach allows athletic footwear manufacturers to gain market share in traditional non-athletic segments while utilizing their existing technological expertise and brand recognition.


By Product Type: Shoes and Boots Lead Innovation
Shoes and Boots hold a dominant 52.02% market share in 2025, as these products offer versatility for multiple seasons and occasions. Flats represent the market's fastest-growing segment with a projected 4.76% CAGR through 2031, supported by workplace flexibility trends and increased consumer focus on comfort. Sandals continue to show consistent demand in warm-weather regions, with Crocs' material and design innovations expanding the category beyond traditional casual use.
The Heels and Pumps segment experiences declining demand due to evolving workplace dress codes favoring comfort-focused footwear, though luxury brands maintain their market position through superior craftsmanship and established heritage. The Other Product Types segment serves specialized markets, including medical, safety, and performance footwear, each requiring specific technical features. This segment's growth indicates consumers' increasing sophistication and readiness to purchase specialized footwear for distinct activities and requirements.
By End User: Women Lead, Children Accelerate
Women account for 48.21% of the footwear market share in 2025, driven by their purchasing power and diverse footwear requirements across professional, casual, and athletic categories. The Kids/Children segment is growing at a 4.93% CAGR through 2031, supported by population growth and increased youth sports participation. Men maintain a significant market presence with consistent demand patterns centered on performance and durability features. The gender-based market distribution shows distinct purchasing patterns and preferences, necessitating specific product development and marketing approaches.
According to the Centers for Disease Control and Prevention data from 2024, youth sports participation stands at 61.1% among adolescents aged 12-17, generating consistent demand for children's athletic footwear. However, increasing screen time negatively affects activity levels, presenting a growth challenge. The children's segment experiences regular replacement cycles due to growth patterns and high activity levels that cause faster wear. Manufacturers are developing age-specific technologies and designs that promote healthy foot development while meeting young consumers' style preferences and social influences.
By Category: Premium Growth Outpaces Mass Scale
In 2025, the mass category commands a 58.35% market share, leveraging accessibility and value positioning. Meanwhile, the premium segment is on track to grow at a 5.22% CAGR through 2031. This trend underscores a shift in consumer behavior, with many now willing to invest in higher-quality products that promise enhanced performance, durability, and brand prestige. The growth of the premium segment is largely driven by rising disposable incomes and a more discerning consumer base that values footwear attributes beyond mere functionality. In response, mass market brands are feeling the heat, pushing them to integrate premium features without straining their pricing models. This challenge opens doors for innovations in value engineering and supply chain efficiencies.
Brands adopting a premium stance are reaping the rewards, not just in terms of higher margins, but also in their ability to funnel these profits into areas like innovation, sustainability, and elevating customer experiences – all of which help validate their price points. This trend of 'premiumization' isn't confined to just luxury labels anymore. It's now permeating into performance-driven products that tout tangible benefits, be it in comfort, durability, or specialized functions. Today's consumers, armed with digital tools for research and price comparisons, are making informed choices, often gravitating towards premium-priced products that promise and deliver superior value.
By Distribution Channel: Digital Transformation Accelerates
In 2025, Specialty Stores, leveraging expert service and curated products, capture a dominant 58.12% market share. These stores continue to attract consumers by offering tailored shopping experiences and high-quality products, which differentiate them from other distribution channels. Meanwhile, Online Retail Stores, riding the wave of consumer demand for convenience and variety, post the sector's swiftest growth at a 5.53% CAGR, projected through 2031. The increasing penetration of smartphones, improved internet connectivity, and advancements in e-commerce platforms are driving this growth. Supermarkets and Hypermarkets, with their competitive pricing and strategic impulse purchasing opportunities, solidify their foothold in the mass market. These outlets remain a preferred choice for bulk purchases and everyday essentials due to their accessibility and cost-effectiveness.
Other Distribution Channels, such as direct-to-consumer showrooms and innovative pop-up retail concepts, are redefining shopping by offering immersive brand experiences. These channels allow brands to engage directly with consumers, fostering loyalty and enhancing brand visibility. Thanks to digital transformation, retailers are now harnessing personalization and customization. This evolution not only streamlines data collection for informed product development and marketing but also diminishes reliance on traditional retail partnerships. The integration of advanced technologies, such as artificial intelligence and machine learning, further enhances the ability to predict consumer preferences and optimize inventory management, ensuring a seamless shopping experience.
Geography Analysis
The United States holds a 79.42% share of the North American footwear market in 2025, supported by mature consumer markets, established distribution networks, and comprehensive brand presence. The country's market dominance stems from its robust retail infrastructure, diverse consumer preferences, and strong purchasing power. World Integrated Trade Solution data from 2023 shows United States footwear imports valued at USD 764.54 million, contributing to increased regional demand. The market benefits from a well-developed e-commerce ecosystem and multichannel distribution strategies that enhance consumer access to footwear products.
Canada maintains a stable market position with established trade relationships and consumer preferences aligned with U.S. trends, despite challenges from currency fluctuations and trade uncertainties. Statistics Canada reports a 6.5% increase in merchandise imports of clothing, footwear, and accessories in February 2024 . Government initiatives promoting sports and active lifestyles continue to drive demand for athletic and performance footwear. The Canadian footwear market demonstrates adaptability through innovative retail strategies, enhanced digital presence, and growing emphasis on sustainable and locally sourced products.
Mexico demonstrates the highest growth potential with a projected 5.77% CAGR through 2031, supported by middle-class expansion, rising disposable income, and increased health awareness among younger consumers. The country's footwear market benefits from improving retail infrastructure, growing urbanization, and increasing adoption of international fashion trends. The Rest of North America comprises smaller markets offering opportunities in tourism, luxury, and specialized segments, requiring focused distribution strategies and regional expertise. These markets show potential for growth through targeted marketing approaches, customized product offerings, and strategic partnerships with local retailers.
Competitive Landscape
The North American footwear market demonstrates moderate consolidation, with varying competitive dynamics across segments. The athletic footwear segment shows higher concentration, while the fashion footwear segment remains diversified. Major companies employ different strategies, with some prioritizing vertical integration and direct-to-consumer channels, while others focus on wholesale distribution and specific product categories..
VF Corporation demonstrates a diversified approach through multiple divisions, including Outdoor & Action Sports, Jeanswear, Imagewear, Sportswear, and Contemporary Brands, featuring footwear brands such as The North Face, Vans, and Timberland. Market opportunities exist in underserved segments, including specialized performance categories, sustainable materials development, and direct-to-consumer brands for specific demographic groups.
Digital-first companies with a sustainability focus are challenging established brands, particularly in premium segments where brand heritage has diminishing influence among younger consumers. Companies are differentiating themselves through technology investments in digital design, manufacturing processes, and customer experience enhancement across online and physical retail channels. This approach differs from the predominant offshore manufacturing model used by competitors, illustrating the various strategies for value creation in the North American footwear market.
North America Footwear Industry Leaders
-
Nike Inc
-
Adidas Group
-
Skechers USA Inc
-
Deckers Outdoor Corporation
-
VF Corporation
- *Disclaimer: Major Players sorted in no particular order

Recent Industry Developments
- February 2025: Adidas Sportswear launched its new running-inspired footwear line, Lightblaze, featuring brand ambassadors Tate McRae and Bradley Barcola. The collection is available for purchase through the adidas official website, where customers can explore the complete range of Lightblaze footwear and make direct purchases.
- April 2024: Adidas announced the launch of a new product line, which includes seven footwear styles, six pairs of sneakers, and one set of slides. Two Gazelles in all-white and all-black lead the charge, with the rest of the sneaker lineup consisting of one-offs of the Handball Pro, Moston Super, Wensley Low, and Whitworth.
- April 2024: For spring 2024, Hoka launched a variety of road, trail, and hiking shoes. The footwear range includes CLIFTON 9, hiking shoes, fashion shoes, and competition shoes like ROCKET X2, exposing HOKA to new demographics.
- April 2024: Nike launched a new collection of athletic footwear and apparel. The company introduced the Air Zoom unit in the Pegasus Premium running shoe to provide better energy return for runners. Nike also released products featuring its Air cushioning system for different sports, incorporating advanced technology and digital capabilities.


North America Footwear Market Report Scope
Footwear refers to garments or accessories worn on the feet, typically for protection, comfort, and fashion.
The North America Footwear Market is segmented by type, product type, category, end user, distribution channel, and geography. By type, the market is segmented into athletic and non-athletic footwear. By product type, the market is segmented into shoes and boots, heels and pumps, sandals, and others. By category, the market is segmented into mass and premium/luxury. By end user, the market is segmented into men, women, and kids. By distribution channel, the market is segmented into specialty stores, supermarkets/hypermarkets, online retail stores, and other distribution channels. By geography, the market is segmented into the United States, Canada, Mexico, and the Rest Of North America.
The market sizing has been done in USD value terms for all the abovementioned segments.
| Athletic Footwear |
| Non-Athletic Footwear |
| Shoes and Boots |
| Heels and Pumps |
| Sandals |
| Flats |
| Other Product Types |
| Mass |
| Premium |
| Men |
| Women |
| Kids/Childrens |
| Specialty Stores |
| Supermarkets/Hypermarkets |
| Online Retaile Stores |
| Other Distribution Channels |
| United States |
| Canada |
| Mexico |
| Rest of North America |
| By Type | Athletic Footwear |
| Non-Athletic Footwear | |
| By Product Type | Shoes and Boots |
| Heels and Pumps | |
| Sandals | |
| Flats | |
| Other Product Types | |
| By Category | Mass |
| Premium | |
| By End User | Men |
| Women | |
| Kids/Childrens | |
| By Distribution Channel | Specialty Stores |
| Supermarkets/Hypermarkets | |
| Online Retaile Stores | |
| Other Distribution Channels | |
| By Geography | United States |
| Canada | |
| Mexico | |
| Rest of North America |


Key Questions Answered in the Report
What is the current value of the North America footwear market?
The market is worth USD 126.75 billion in 2026.
How fast will the market grow between 2026 and 2031?
It is forecast to expand at a 4.38% CAGR, reaching USD 157.03 billion by 2031.
Which footwear type holds the largest share?
Athletic footwear leads with 52.68% of 2025 revenue and grows at 4.57% CAGR to 2031.
Which distribution channel is expanding the quickest?
Online retail stores record the fastest 5.53% CAGR during 2026-2031.
Why is Mexico the fastest-growing geography?
Rising middle-class incomes, health awareness and near-shoring manufacturing give Mexico a 5.77% CAGR.
Page last updated on:


