
Market Overview
| Study Period | 2020 - 2031 |
|---|---|
| Forecast Data Period | 2026 - 2031 |
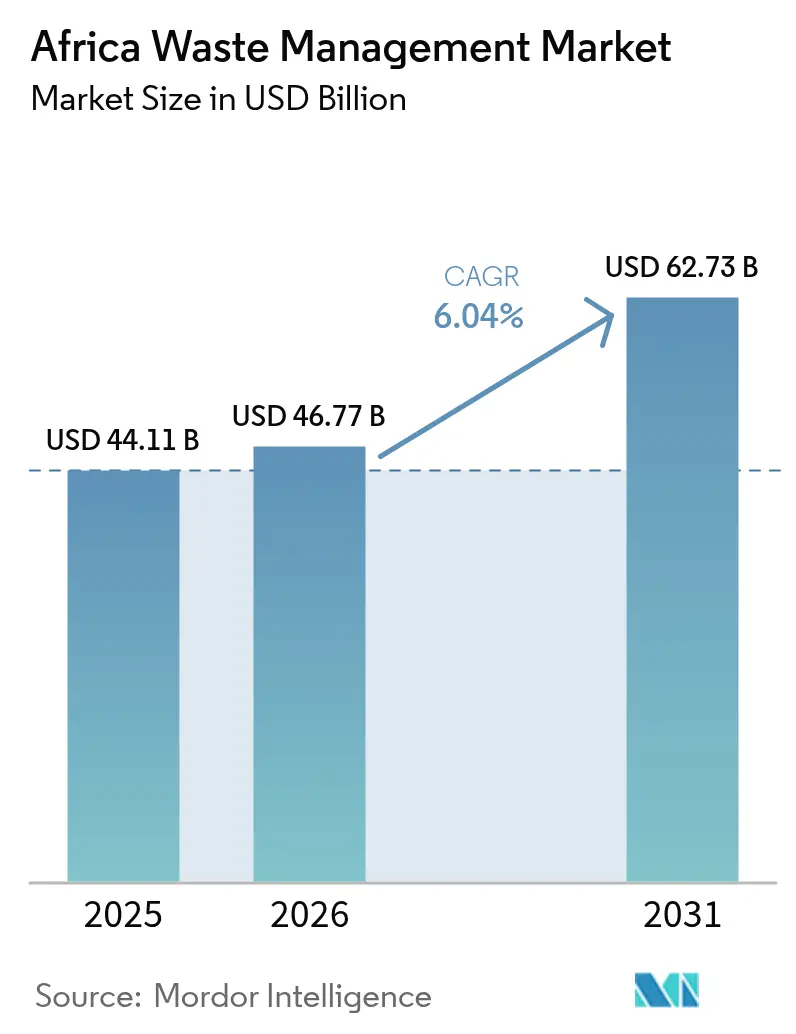
| Base Year Market Size (2025) | USD 44.11 Billion |
| Market Size (2026) | USD 46.77 Billion |
| Market Size (2031) | USD 62.73 Billion |
| Growth Rate (2026 - 2031) | 6.04 % |
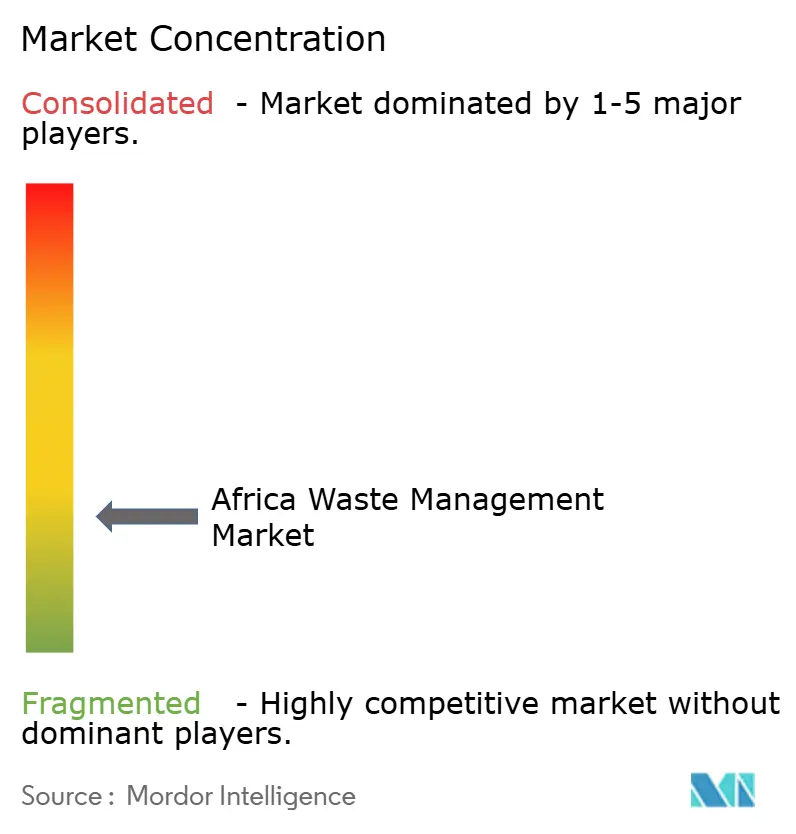
| Market Concentration | Low |
Major Players *Disclaimer: Major Players sorted in no particular order Image © Mordor Intelligence. Reuse requires attribution under CC BY 4.0. | |
Africa Waste Management Market Analysis by Mordor Intelligence
The Africa Waste Management Market size in 2026 is estimated at USD 46.77 billion, growing from 2025 value of USD 44.11 billion with 2031 projections showing USD 62.73 billion, growing at 6.04% CAGR over 2026-2031. Rapid urbanization funnels unprecedented waste volumes into already-strained municipal systems, creating space for private‐sector collection, treatment, and recycling solutions. Investor appetite grows as governments adopt extended producer responsibility (EPR) rules, while technology firms deploy AI-enabled route optimization to raise collection efficiencies. Waste-to-energy (WtE) developers are securing climate-finance backing, yet capital gaps persist for other large-scale treatment assets. Competition remains fragmented, but rising compliance costs favor operators able to integrate informal collectors into formal value chains.
Key Report Takeaways
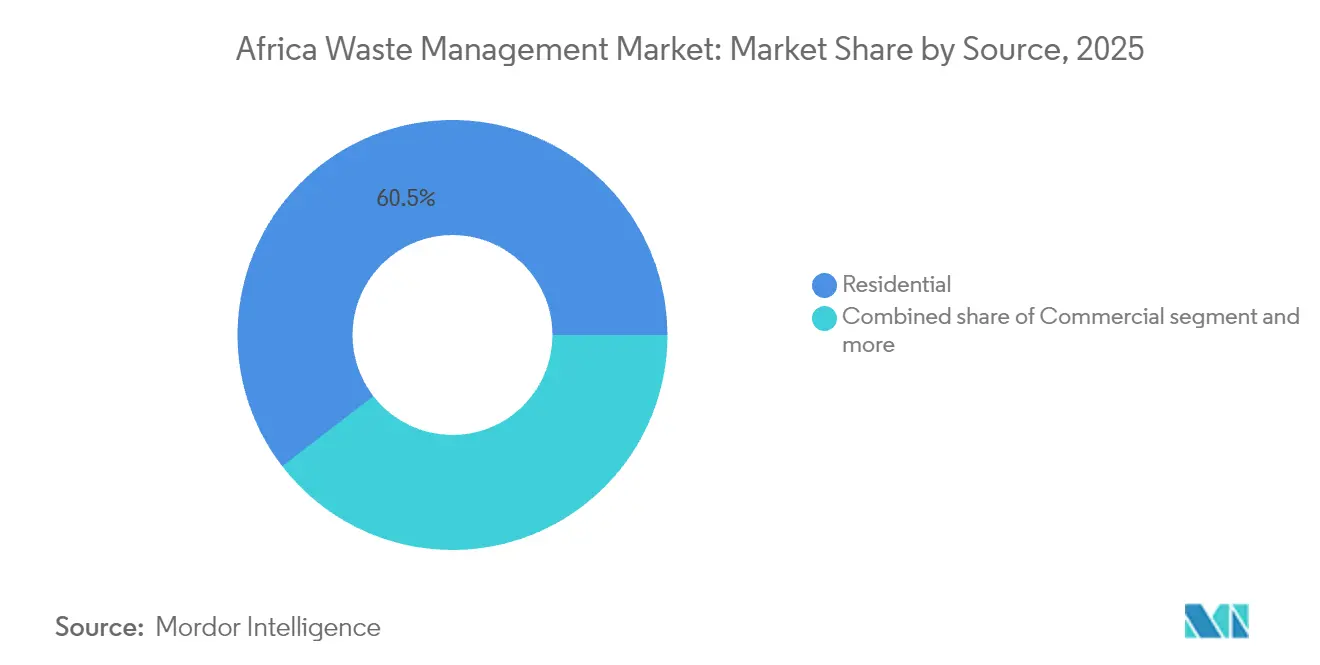
- By source, residential streams captured 60.45% of the Africa waste management market share in 2025, whereas commercial waste is advancing at an 8.52% CAGR through 2031.
- By service, disposal and treatment accounted for 69.83% of the Africa waste management market size in 2025, while recycling and resource recovery services are expanding at an 8.66% CAGR to 2031.
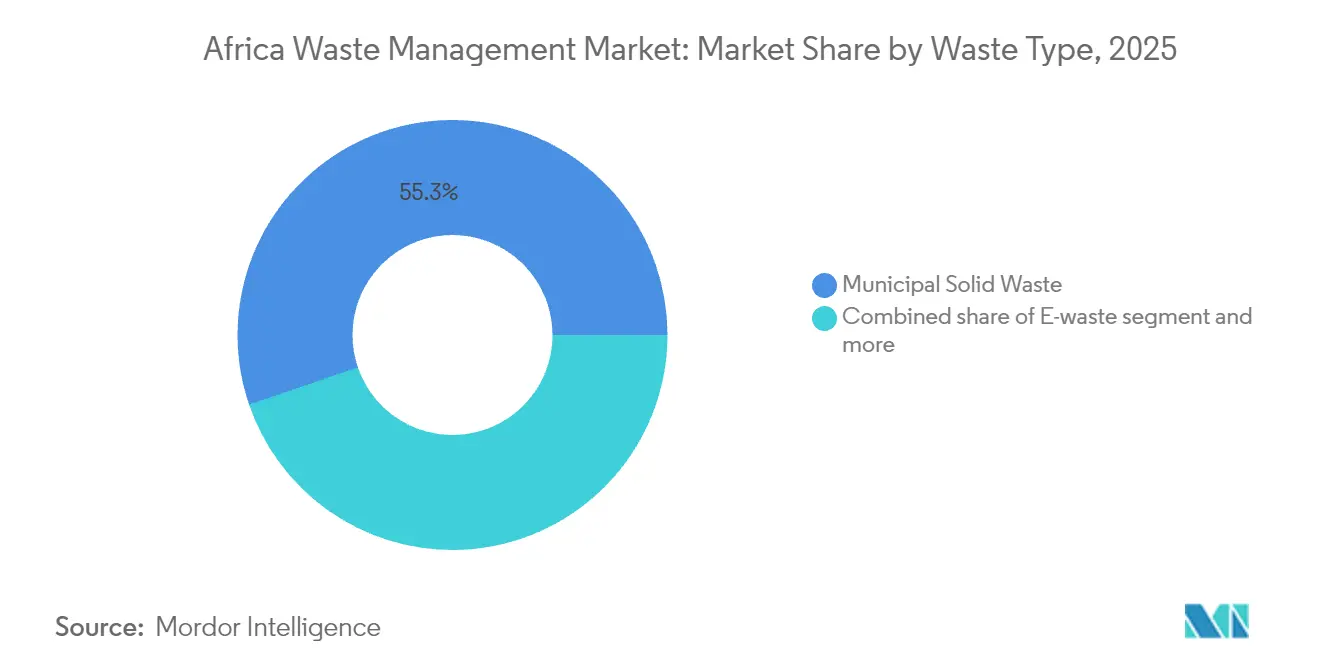
- By waste type, municipal solid waste held 55.25% of the Africa waste management market size in 2025; e-waste registers the fastest projected CAGR at 7.45% through 2031.
- By geography, South Africa led with 40.08% of the Africa waste management market share in 2025, but the Rest of Africa region is set to post a 7.17% CAGR between 2026 and 2031.
Note: Market size and forecast figures in this report are generated using Mordor Intelligence’s proprietary estimation framework, updated with the latest available data and insights as of 2026.
Market Trends and Insights
Drivers Impact Analysis of Africa Waste Management Market*
| Driver | ( ~ ) % Impact on CAGR Forecast | Geographic Relevance | Impact Timeline |
|---|---|---|---|
| Rising urban population driving municipal solid waste volumes | +2.1% | Nigeria, Kenya, Egypt | Long term (≥ 4 years) |
| Government push for higher recycling targets & EPR frameworks | +1.8% | South Africa, Kenya, Egypt, Rest of Africa | Medium term (2-4 years) |
| Growing investor interest in waste-to-energy projects | +1.3% | South Africa, Egypt, Nigeria | Medium term (2-4 years) |
| Digitized collection & route-optimization platforms | +0.7% | Major urban centers | Short term (≤ 2 years) |
| Off-grid micro-pyrolysis for plastics-to-fuel in remote mines | +0.3% | Mining regions | Long term (≥ 4 years) |
| Source: Mordor Intelligence | |||
Rising Urban Population Driving Municipal Solid Waste Volumes
Africa’s cities gain roughly 22 million new residents every year, elevating household consumption and daily waste flows. Lagos alone generates 13,000-14,000 tons of refuse each day, yet formal recycling diverts just 0.37%, underscoring severe infrastructure gaps. Collection fleets struggle to keep pace, prompting municipalities to outsource operations and invite private investment in transfer stations and material-recovery facilities. Concentrated urban waste streams lower per-ton processing costs, improving project economics for WtE and sorting plants. Demographic trends will therefore keep municipal solid waste (MSW) the anchor of the Africa waste management market well beyond 2030[1].
Government Push for Higher Recycling Targets & EPR Frameworks
Kenya’s 2024 EPR regulations oblige producers to finance end-of-life collection and recycling, mirroring South Africa’s mandatory schemes under the National Environmental Management Waste Act. Egypt has rolled out a sustainable recycling initiative that links informal pickers to licensed processors, raising material quality while preserving livelihoods. Compliance costs are shifting recycling from voluntary programs to legally enforced obligations, pushing brand owners to sign long-term service contracts with certified operators. These mandates steadily enlarge feedstock volumes for plastic, metal, and e-waste recycling facilities, bolstering revenues across the Africa waste management market[2].
Growing Investor Interest in Waste-to-Energy Projects
Phoenix Edison’s USD 116 million plant in Nigeria will treat 270,000 tons of waste annually and displace 60,000 tons of CO₂ emissions. Egypt has identified the capacity to generate 5.6 TWh of electricity each year if existing dumps are converted to incineration units. International climate funds favor WtE because it simultaneously curbs methane emissions and supplies dispatchable renewable power. Yet robust gate fees and feed-in tariffs remain prerequisites for bankability, creating a policy-driven opportunity set for operators able to navigate governmental approval cycles[3].
Digitized Collection & Route-Optimization Platforms
AI-based mapping now spots illegal dumping from satellite imagery and flags new sites for enforcement agencies, as pioneered by Intelligent Network Solutions with UNICEF backing. Start-ups overlay this geospatial data onto fleet-tracking dashboards, cutting fuel costs and raising pickup densities in sprawling informal settlements. Lagos State Waste Management Authority plans to embed such software into transfer-loading stations to reach a 90% recycling target. Digitalization, therefore, unlocks immediate operating-cost savings and underpins new pay-as-you-throw billing models that strengthen cash flows.
Restraints Impact Analysis of Africa Waste Management Market*
| Restraint | ( ~ ) % Impact on CAGR Forecast | Geographic Relevance | Impact Timeline |
|---|---|---|---|
| Weak landfill regulation & enforcement | –1.4% | Nigeria, Kenya, Rest of Africa | Long term (≥ 4 years) |
| Capital scarcity for large-scale treatment assets | –1.1% | Continent-wide, acute in Rest of Africa | Medium term (2-4 years) |
| Informal sector lock-in that deters formal private investment | –0.8% | Nigeria, Kenya, Rest of Africa | Medium term (2-4 years) |
| Climate-linked insurance gaps for WtE plants | –0.4% | South Africa, Egypt, Nigeria | Long term (≥ 4 years) |
| Source: Mordor Intelligence | |||
Weak Landfill Regulation & Enforcement
More than 90% of East Africa’s waste still winds up in open dumps, releasing methane and leachate that threaten groundwater. Addis Ababa’s Repi site alone receives wastes unchecked, yet only 65% of the city’s refuse is formally collected. Non-enforcement allows unlicensed haulers to undercut compliant operators by dodging gate fees, eroding the economics of engineered landfills. Without uniform inspection regimes, municipalities cannot recover operating costs or enforce polluter-pays principles, delaying modernization of disposal infrastructure across the Africa waste management market.
Capital Scarcity for Large-Scale Treatment Assets
Dakar’s AMA Senegal concession required USD 15.7 million in political-risk guarantees from MIGA, highlighting the difficulty of attracting long-tenor debt. Local lenders seldom extend maturities beyond seven years, mismatching the 15-20-year payback profiles of WtE or advanced MRF facilities. Currency volatility further inflates hedge costs, while tariff regimes rarely adjust fast enough to cover imported spare-part inflation. Blended-finance structures are emerging but remain cumbersome, tempering the speed at which new infrastructure can close service gaps.
*Our forecasts treat driver/restraint impacts as directional, not additive. The impact forecasts reflect baseline growth, mix effects, and variable interactions.
Africa Waste Management Market Segment Analysis
By Source:
Residential Dominance Drives Commercial GrowthResidential streams secured 60.45% of the Africa waste management market share in 2025 as household consumption grew alongside urban migration. Commercial volumes, however, are projected to post an 8.52% CAGR, fueled by mall and office expansion that heightens demand for scheduled pickups and secure document destruction. Retail chains sign multi-year contracts to meet EPR take-back obligations, adding predictable tonnage for integrated service providers. Industrial generators confront tighter hazardous-waste regulations, particularly in South Africa, pushing them toward licensed disposal partners. Medical waste also rises with increased healthcare investment, creating a high-margin niche for certified incineration firms.
The Africa waste management market benefits from diverse feedstocks: construction and demolition debris escalates as infrastructure budgets climb, while agricultural residues present biogas opportunities in peri-urban zones. Veolia’s multi-source service model across several African countries showcases the value of bundling residential and commercial contracts to balance volume with higher-yield specialty waste. Informal networks remain pivotal for plastics retrieval, yet formalized aggregators are beginning to absorb them via franchise schemes that deliver standardized safety training and mobile-payment transparency.

By Service Type:
Treatment Evolution Accelerates RecoveryDisposal and treatment commanded 69.83% of the Africa waste management market size in 2025, reflecting the continent’s reliance on landfills and rudimentary dumps. Policy pressure now channels capital toward recycling and resource-recovery operations, which carry an 8.66% forecast CAGR. Route-optimization software trims collection costs, freeing budget for material-recovery facilities equipped with optical sorters and balers. Incineration plants enter power-purchase agreements, while composting ventures tap demand for organic fertilizers among peri-urban farmers. Consulting, audit, and training revenues rise as corporates seek EPR compliance audits before submission to regulators.
Gate-fee reforms are crucial: municipalities experimenting with inflation-linked tipping charges secure more stable cash flows to issue green bonds for landfill cell expansion. SUEZ’s USD 133 million (EUR 120 million) investment in Morocco’s Kenitra complex underscores the capex required for fully integrated treatment hubs. Digital proof-of-collection apps linked to blockchain smart contracts now automate incentive payouts for segregated recyclables, further driving the shift from disposal to circularity inside the Africa waste management market.
By Waste Type:
Municipal Leadership Yields to E-Waste GrowthMunicipal solid waste controlled 55.25% of the Africa waste management market size in 2025. Nevertheless, e-waste clocks the fastest CAGR at 7.45% as smartphone penetration and appliance turnover rates accelerate. New regulations compel electronics brands to finance collection centers and certified dismantling lines, turning what was once an informal scrap activity into a licensable business vertical. Plastic waste remains politically salient; off-grid pyrolysis systems now achieve 60-80% conversion efficiency, yielding fuel that can trade for USD 600-900 per ton.
Hazardous industrial residues require double-lined landfill cells and leachate treatment, creating entry barriers that favor incumbents with ISO-14001 certification. Biomedical waste incineration gains volume as vaccination campaigns expand, while construction debris recycling gains traction through aggregate-substitution mandates in public works contracts. Agricultural organics hold largely untapped biogas potential, but pilot projects near Nairobi demonstrate positive payback when digestate sales accompany electricity generation. Consequently, waste-type diversity offers multiple revenue ladders across the Africa waste management market.
Geography Analysis
South Africa Waste Management Market
South Africa remained the linchpin of the Africa waste management market in 2025, holding a 40.08% share underpinned by long-standing EPR legislation and mature landfill engineering standards. National plastic-bag levies and producer-responsibility schemes now push the sector toward higher recycling targets, creating opportunities for robotic sortation and chemical recycling ventures. The market’s maturity prompts incumbents to pursue operational upgrades rather than new builds, such as Seche Environnement’s leachate purification unit at Klinkerstene Waste Park that processes 43 million liters annually.
Nigeria Waste Management Market
Nigeria’s population surge positions Lagos as the continent’s fastest-growing waste hotspot. Daily generation of 13,000-14,000 tons strains existing dumps, but a 90% recycling ambition has galvanized public-private partnerships and tech start-ups. Phoenix Edison’s WtE facility will anchor an industrial symbiosis cluster by supplying steam to nearby manufacturers. The challenge lies in integrating an informal workforce of roughly 45,000 pickers into regulated supply chains without eroding their earnings.
North and East Africa Waste Management Market
North and East Africa offer stable policy signals that lure foreign strategic investors. Kenya’s 2024 EPR regulations introduce four-year compliance plans, giving financiers visibility over feedstock volumes. Egypt quantifies WtE potential at 5.6 TWh annually but needs bankable tariffs and sovereign guarantees to trigger construction. Morocco, already a regional recycling leader, benefits from SUEZ’s Kenitra complex that raises the country’s engineered-landfill capacity by 30%. Collectively, these dynamics re-weight future growth toward the Rest of Africa region, which posts a 7.17% CAGR through 2031, outpacing the established South African market.
Regulatory Landscape
Regulation is tightening around producer responsibility, recycling targets, and reporting, with national frameworks increasingly supported by continental guidance. In Kenya, the National Environment Management Authority (NEMA) enforces the Sustainable Waste Management (Extended Producer Responsibility) Regulations 2024, requiring producer registration, records, and structured take-back schemes. This shifts recycling from voluntary programs to mandated compliance, strengthening demand for certified collection and processing partners.
South Africa continues to anchor formal compliance under the National Environmental Management: Waste Act, with mandatory EPR schemes and a reporting architecture that includes submissions via the EPR Portal, plus requirements for annual external performance audits and financial reports. Policy coordination is also being reinforced through the African Union's Continental Circular Economy Action Plan (2024-2034), while the African Union Electronic Waste Management Plan (revised August 2025) adds direction on e-waste governance, supporting cross-border program design and harmonization efforts in priority waste streams.
Value Chain Analysis
The value chain spans waste generation (households, commercial establishments, healthcare, industry, and construction), primary collection (municipal fleets, private haulers, and extensive informal networks), aggregation and sorting (buy-back centers, transfer stations, and material recovery facilities), treatment and disposal (engineered landfills, composting, recycling, incineration and waste-to-energy), and end markets for recovered outputs (recycled polymers, metals, paper, compost, refuse-derived fuel, and electricity). EPR rules are increasingly shaping reverse logistics by pushing brand owners to work through registered producer responsibility organizations and licensed operators, raising the importance of traceability, documented chain-of-custody, and compliant downstream outlets.
Key bottlenecks sit at collection coverage, contamination, and finance for long-tenor infrastructure, which elevates the role of aggregators that can integrate informal waste workers into standardized intake and quality protocols. Digital tools (fleet tracking, route optimization, and emerging traceability systems) are becoming operational enablers, particularly where billing and proof-of-collection need to align with regulator reporting. On the supply side, growth in waste-to-value capacity depends on stable feedstock contracts and enforceable tipping fee regimes. End-market depth for recovered materials then drives processor margins and the viability of new recovery investments.
Competitive Landscape
Competition in the Africa waste management market remains dispersed among multinational utilities, regional conglomerates, and an extensive informal picker base. Veolia, SUEZ, and Seche Environnement secure long-term concessions by pairing global engineering depth with local joint-venture structures. Their advantage lies in compliance credentials essential under tightening EPR rules. Local firms retain community ties that ensure high recovery rates, yet many lack the capital to scale beyond single-city footprints. As governments introduce landfill taxes and recycling targets, acquisition pipelines widen for cash-rich strategic buyers seeking share gains.
Digitalisation is an emerging competitive lever. Veolia’s 2025 partnership with Mistral AI aims to enhance predictive maintenance and material-flow analytics, thereby cutting unplanned downtime. Start-ups focus on last-mile plastics retrieval using smartphone-based incentive schemes, filling collection gaps that large haulers struggle to service profitably. WtE developers differentiate on project-finance expertise: securing Multilateral Investment Guarantee Agency (MIGA) cover or green bonds reduces weighted-average cost of capital, allowing more aggressive gate-fee bids. Yet climate-linked insurance gaps still deter some entrants, particularly in flood-prone coastal zones.
Strategic consolidation is underway. SUEZ’s acquisition of South Africa’s EnviroServ, followed by its reintegration of UK waste assets, signals its intent to create an end-to-end African platform. Law firms specializing in environmental regulation report a threefold increase in due diligence mandates tied to cross-border waste acquisitions. Looking ahead, e-waste processing and agricultural biogas projects represent white spaces where nimble players can secure early mover status before incumbents extend into niches. Overall, regulatory harmonization and technology adoption will likely raise market concentration over the next decade.
Africa Waste Management Industry Leaders
-
Averda
-
Enviroserv
-
Interwaste
-
WasteMart
-
Universal Recycling Company
- *Disclaimer: Major Players sorted in no particular order
Africa Waste Management Market Companies Covered in this Report
- Averda
- EnviroServ
- Interwaste
- WasteMart
- Universal Recycling Company
- Desco
- PETCO
- The Glass Recycling Company
- Oricol Environmental Services
- WeCyclers
- The Waste Group
- SA Waste
- Veolia Africa
- SUEZ Recycling & Recovery Africa
- Biffa South Africa
- Mr Green Africa
- TakaTaka Solutions
- EcoPost
- Stericycle (MedWaste Africa)
- Dangote Recycling
Market Opportunities and Future Outlook
Waste-to-energy and waste-to-fuels are creating higher-capacity investment pathways where municipalities and developers link disposal solutions to power or transport-fuel offtake. In Ghana, Sekondi-Takoradi Metropolitan Assembly partnered with SUS Environment (June 2026) to redevelop the Sofokrom landfill into a 450 MW waste-to-energy complex, signaling a shift toward large integrated conversion assets tied to city waste flows. Ghana also shows a fuels-focused route to monetization, with F&B Bio Recyclage Ltd reporting completion of the FEL-1 phase (June 2026) for a 2,000 tonnes per day MSW-to-SAF facility in Tema, positioning MSW processing as an industrial feedstock platform rather than a pure disposal service.
Smart-city collection and compliance-driven service contracts are creating whitespace for operators that can combine logistics, data, and downstream recovery. Konza Technopolis commissioned an automated pneumatic solid waste management system (October 2025) with a 14.8 km pipeline and 40 tonnes per day capacity, which points to demand for mechanized, trackable collection in planned developments. At the policy layer, the African Union's Continental Circular Economy Action Plan (2024-2034) provides a continental framework that supports program replication in packaging and electronics. Kenya's EPR regime administered by NEMA further formalizes producer-funded take-back, strengthening long-term service demand for audited collection, sorting, and recycling providers able to meet reporting and material-quality requirements.
Recent Industry Developments in Africa Waste Management Market
- June 2026: Jospong Group confirmed the expansion of its waste management operations into 29 African countries. The wider footprint strengthens its ability to bundle collection, recovery, and disposal services across multiple cities and helps the company leverage scale when developing regional resource-recovery and waste-to-energy platforms.
- May 2026: Jospong Group signed a memorandum of understanding with Belgian technology firm VYNCKE to develop scalable waste-to-energy projects in Africa. The partnership links an established regional operator with a specialist technology provider, supporting faster progression from collection-focused services toward energy-generating treatment assets.
- September 2024: EnviroServ and other South African operators increased focus on converting landfill operations into lower-emission "green landfill" models, including landfill-gas-to-energy pathways highlighted in industry reporting. The emphasis on gas capture and energy recovery raises the bar for engineered landfill capabilities and increases demand for compliant treatment partners among industrial and municipal customers.
Africa Waste Management Market Report Scope and Research Methodology
Market Definition and Coverage
This market covers the paid and publicly funded services used to collect, move, sort, treat, recycle, recover energy from, and dispose of waste generated across African countries, and it is measured in value terms in USD.
Scope exclusions: Informal, unpaid self-disposal that does not pass through organized collection or treatment systems is excluded where it cannot be reliably valued.
Segments Covered in This Report
- By Source
- Residential
- Commercial (retail, office, etc.)
- Industrial
- Medical (Health and Pharmaceutical)
- Construction & Demolition
- Others (institutional, agricultural, etc)
- By Service Type
- Collection, Transportation, Sorting & Segregation
- Disposal / Treatment
- Landfill
- Recycling & Resource Recovery
- Incineration & Waste-to-Energy
- Others (Chemical Treatment, Composting, etc.)
- Others (Consulting, Audit & Training, etc.)
- By Waste Type
- Municipal Solid Waste
- Industrial Hazardous Waste
- E-waste
- Plastic Waste
- Biomedical Waste
- Construction & Demolition Waste
- Agricultural Waste
- Other Specialized Waste (radio active, etc)
- By Geography
- Nigeria
- South Africa
- Egypt
- Kenya
- Rest of Africa
Data Sources, Market Sizing, and Validation
Desk Research
Desk work was used to set the demand and policy context before any modeling was finalized, since waste systems in Africa can change fast when rules or funding shifts. We referred to public datasets and official publications such as World Bank solid waste indicators, UN-Habitat city services references, UNEP circular economy and plastics releases, WHO healthcare waste guidance, and country level statistics portals and municipal by-laws where they are openly available.
To keep the inputs realistic, we also reviewed company annual reports, investor presentations, and audited financial statements of operators that disclose Africa revenues or capacity additions, along with credible press and tender portals that indicate contract values and service scope. In a few places, paid subscriptions were used only to speed up company financials screening, patent lookups for treatment technologies, and shipment level trade checks for equipment and recyclables when public series were thin. These desk sources are illustrative, and many additional public documents were also reviewed for data collection, validation, and clarification.
Primary Interviews and Surveys
Primary inputs were gathered through expert interviews and structured surveys with municipal stakeholders, private operators, recyclers, treatment providers, and large waste generators, so assumptions could be corrected where public data lagged. For a regional title like this, we made sure feedback reflected different maturity levels across Africa, and we used these discussions to validate service mix splits, typical pricing movements, and the pace of formalization (including how informal collection links into formal streams).
Distribution of primary research fieldwork respondents
| Company type | Respondent position |
|---|---|
| Top tier: 34% | CXOs: 13% |
| Mid tier: 51% | Functional/Unit leaders: 29% |
| Smaller Players: 15% | Managers: 58% |
Market-Sizing & Forecasting
Sizing started with a top-down build where urban population coverage, waste generation per capita, collection penetration, and treatment pathway shares were used to reconstruct the value pool for organized waste services across Africa. To keep the structure practical, the model then converts the service activity into value using price markers like collection and hauling charges, landfill gate fees, and typical sorting and recovery economics, with currency handled consistently in USD.
Those totals were then checked with selective bottom-up approximations, such as rolling up a sample of operator revenues, reviewing public contract values, and using sampled price times volume logic for specific waste streams where visibility is better (for example, municipal solid waste handling or plastics recovery). When data gaps appeared for smaller countries, we filled them with proxy ratios tied to urbanization, GDP per capita, and the presence of formal facilities, and then adjusted the outputs based on interview feedback.
For forecasting, scenario analysis was preferred because infrastructure additions and policy enforcement can move in steps rather than smooth lines. Growth paths were anchored on variables that respondents could comment on with confidence, including city collection coverage targets, new landfill and waste-to-energy commissioning timelines, recycling policy enforcement (such as EPR readiness), and expected changes in tipping fees and fuel costs that affect hauling economics.
Data Validation & Update Cycle
Outputs were cross-checked against independent signals, including waste generation benchmarks, facility capacity additions, and observed tendering activity, so outliers could be challenged early. When a country total looked unusually high or low, the drivers were re-tested, and follow-up calls were triggered to confirm whether the issue was pricing, penetration, or service scope.
Before sign-off, the work is reviewed in steps by another analyst so assumptions, units, and conversions are consistent across the sheet and narrative. The report is refreshed annually, and interim updates are made when material events occur, such as major policy changes, large contract awards, or facility disruptions. Right before delivery, we do a final pass to make sure the latest public releases and expert feedback are reflected.
Mordor Intelligence's Africa Waste Management Market Sizing Compared With Other Published Estimates
Published market sizes for Africa waste management can vary a lot, even when the titles look similar, because the service boundary and the way value is counted are not always aligned. Differences usually show up around what is treated as formal spend, what parts of the value chain are included, and how fast pricing and coverage are assumed to change.
By tracking formal collection coverage, landfill and treatment pathway shares, and price markers in USD, Mordor Intelligence keeps the 2025 value tied to organized services, which avoids mixing in informal, unpaid handling that is hard to value consistently. Gaps can also come from whether a study reports only a narrower activity like collection, whether it uses a smaller country set, or whether its forecast uses an aggressive formalization curve without checking it against facility capacity and municipal contracting cadence.
Benchmark comparison
| Source | Market Size | Gaps in Research Methodology |
|---|---|---|
| Mordor Intelligence | USD 44.11 B (2025) | |
| Regional Consultancy A | USD 8.73 B (2023) | Uses an earlier base year and appears to apply a tighter value perimeter that is closer to selected waste services and countries, which can undercount broader treatment, recycling, and recovery activities across Africa. |
| Industry Association B | USD 44.00 B (2025) | Presents a rounded, headline value with limited visibility on how service mix, pricing, and formal versus informal handling were separated, which makes the estimate harder to reconcile to repeatable inputs. |
The spread across publishers is mainly explained by what gets counted as monetized waste services, plus the year used and the transparency of input checks. Our approach stays traceable because each step links back to observable coverage, waste volumes, treatment shares, and pricing assumptions that can be re-tested when new policies or projects change the outlook.
Key Questions Answered in the Report
How large is the Africa waste management market in 2026?
The sector is valued at USD 46.77 billion in 2026 and is projected to grow at a 6.04% CAGR to USD 62.73 billion by 2031.
Which waste stream generates the most revenue?
Municipal solid waste remains the largest stream, contributing 55.25% of 2025 revenue, though e-waste is expanding fastest at a 7.45% CAGR.
What drives investor interest in African waste-to-energy plants?
Dual benefits of disposal capacity and renewable power, combined with climate-finance incentives, underpin growing capital flows into projects like Nigeria’s USD 116 million Phoenix Edison facility.
How do EPR regulations affect private waste operators?
Mandatory take-back targets create reliable fee income for certified haulers but also raise compliance costs, favoring players with robust reporting and logistics capabilities.