Market Overview
| Study Period | 2020 - 2030 |
|---|---|
| Base Year For Estimation | 2024 |
| Forecast Data Period | 2025 - 2030 |
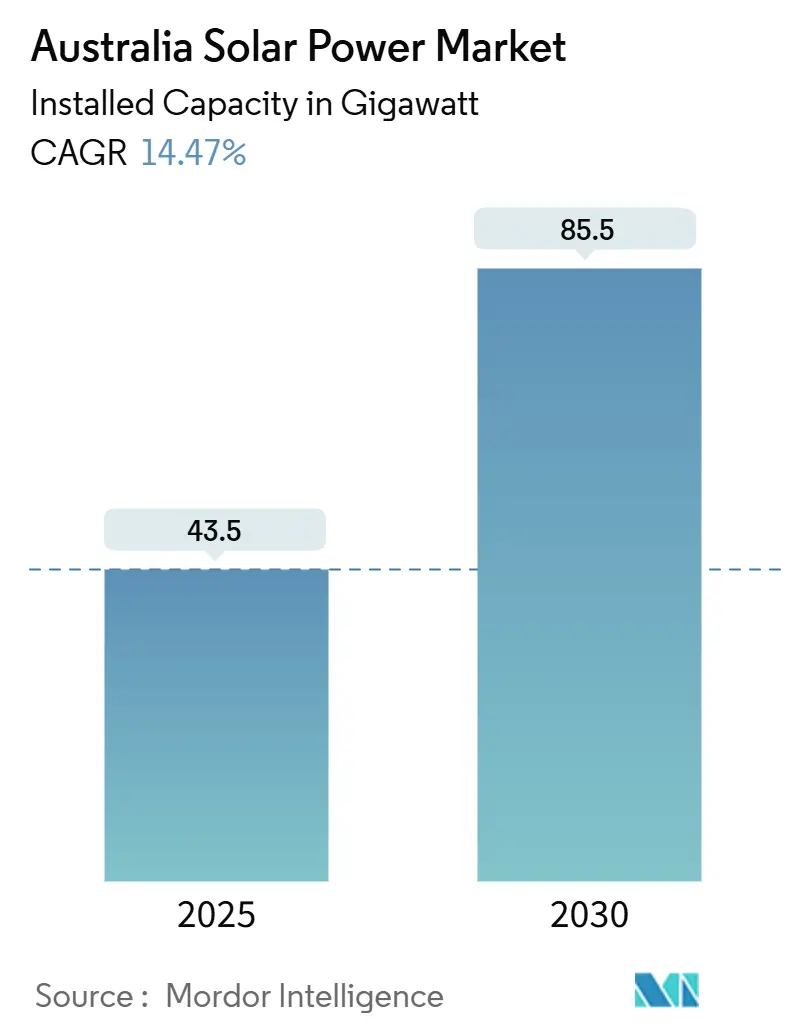
| Market Volume (2025) | 43.5 gigawatt |
| Market Volume (2030) | 85.5 gigawatt |
| Growth Rate (2025 - 2030) | 14.47% CAGR |
| Market Concentration | Medium |
Major Players
*Disclaimer: Major Players sorted in no particular order Image © Mordor Intelligence. Reuse requires attribution under CC BY 4.0. |
|
Australia Solar Power Market Analysis by Mordor Intelligence
The Australia Solar Power Market size in terms of installed capacity is expected to grow from 43.5 gigawatt in 2025 to 85.5 gigawatt by 2030, at a CAGR of 14.47% during the forecast period (2025-2030).
This trajectory confirms that policy certainty, falling photovoltaic (PV) prices, and corporate-led procurement are combining to propel solar energy toward a dominant role in the national energy mix. Grid-scale storage pairing, transmission-linked renewable-energy zones, and widespread household grid parity are accelerating capacity additions while shifting value creation from pure energy sales to integrated services. International component suppliers continue to capture hardware revenues, but Australian developers, EPC contractors, and financiers are winning projects by optimizing battery integration and navigating compliance rules. Transmission upgrades lag solar cost declines, concentrating construction in well-connected zones and favoring developers that secure early grid access. Corporate power-purchase agreements (PPAs) have converted sustainability pledges into 10 to 15-year contracts that underpin utility-scale financing at prices below AUD 40/MWh.
Key Report Takeaways
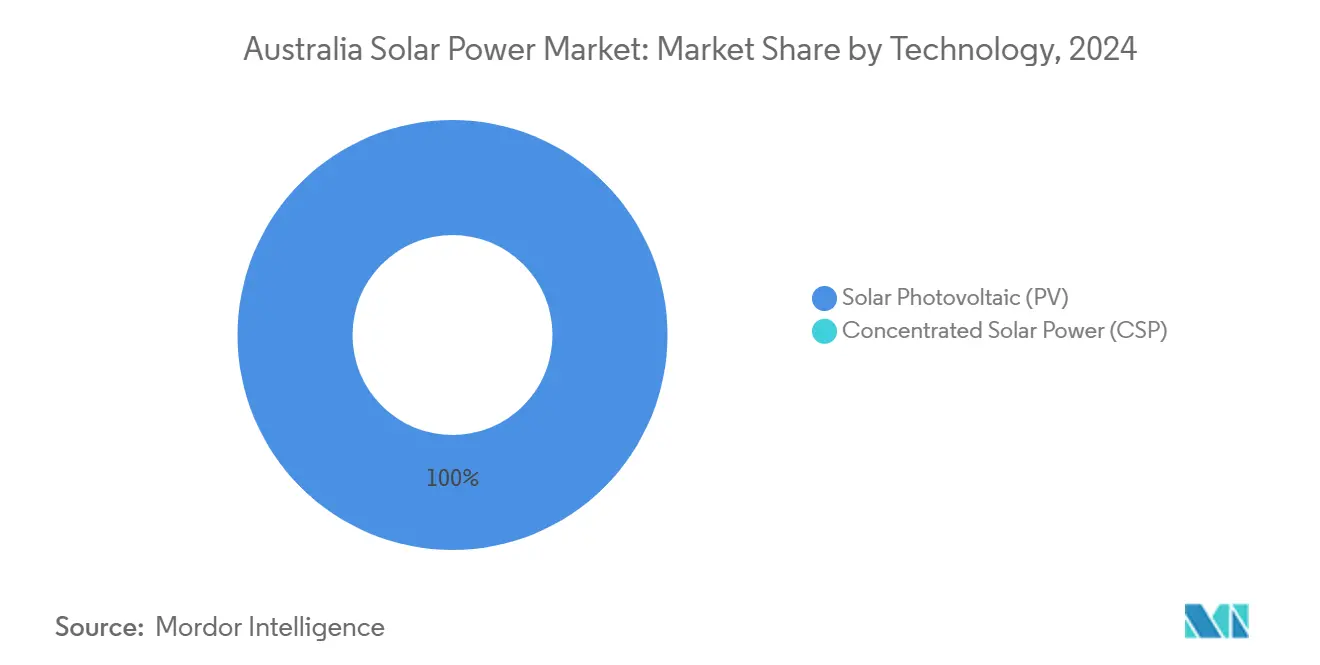
- By technology, solar PV captured 100% of the Australian Solar Power market share in 2024 and is advancing at a 14.5% CAGR through 2030.
- By grid type, off-grid systems accounted for 1.3% of the Australian Solar Power market size in 2024, yet are expected to expand at a 19.9% CAGR to 2030.
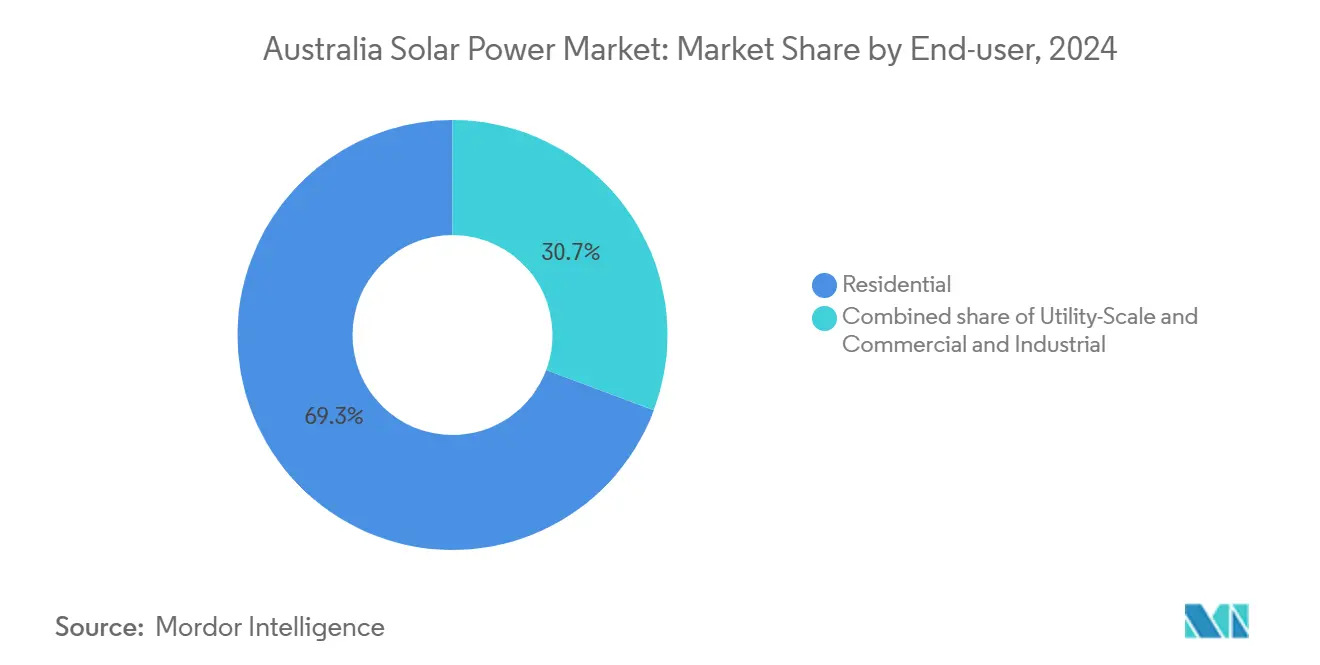
- By end-user, residential installations accounted for 69.3% of the Australian Solar Power market size in 2024, while utility-scale projects recorded the fastest growth rate of 23.4% through 2030.
- Neoen, AGL Energy, and Origin Energy collectively controlled about 28% of newly connected utility-scale capacity in 2024.
Australia Solar Power Market Trends and Insights
Drivers Impact Analysis
| Drivers Impact Analysis | (~) % Impact on CAGR Forecast | Geographic Relevance | Impact Timeline |
|---|---|---|---|
| Federal & state-level renewable-energy targets | +3.20% | National, strongest in NSW, Victoria, Queensland | Medium term (2-4 years) |
| Declining PV module prices | +2.80% | Nationwide utility sites | Short term (≤2 years) |
| Corporate-PPA demand from C&I sector | +2.10% | Industrial corridors in NSW, Victoria, Queensland | Medium term (2-4 years) |
| Rooftop grid parity for households | +1.90% | Highest in South Australia, Queensland | Short term (≤2 years) |
| Grid-scale storage pairing | +2.40% | NSW, Victoria, South Australia | Long term (≥4 years) |
| Green-hydrogen utility projects | +1.80% | Western Australia, Northern Territory, Queensland | Long term (≥4 years) |
| Source: Mordor Intelligence | |||
Understand The Key Trends Shaping This Market
Download PDF
Federal & State-Level Renewable Energy Targets Drive Utility Procurement
Australia’s 82% renewable-electricity goal for 2030 anchors investor expectations and underpins coordinated state-level auctions. New South Wales alone has earmarked AUD 32 billion for renewable-energy zones that bundle generation, storage, and transmission.(1)NSW Department of Planning and Environment, “Electricity Infrastructure Roadmap,” planning.nsw.gov.au Competitive tenders now award 15-year contracts below AUD 40/MWh, de-risking merchant exposure and compressing payback cycles. Transmission build-outs specified in the Integrated System Plan align grid expansions with solar clusters, lowering curtailment risk. States are increasingly linking solar-zone rollouts to local manufacturing and job-creation mandates, thereby embedding energy policy within broader economic development agendas. The resulting policy synergy minimizes the boom-bust investment swings that previously hampered the Australian Solar Power market.
Declining PV Module Prices Sustain Cost Leadership
Average module prices fell another 12% in 2024, sending utility-scale EPC costs to AUD 800-1,000/kW and extending solar’s cost lead over new gas peakers.(2)Clean Energy Council, “Clean Energy Australia Report 2024,” cleanenergycouncil.org.au Residential systems dropped to AUD 1,200-1,500/kW, shortening payback periods to 3-4 years across all mainland states. The rapid diffusion of high-efficiency monocrystalline modules (with an 85% share) reduces balance-of-system spending, while pilot perovskite-silicon tandem lines aim to achieve efficiencies of 30% or more by 2027. Cheaper modules unlock smaller-scale projects on brownfield land and commercial rooftops, broadening the Australian Solar Power market beyond large trackers on open land. Continuous price declines also cushion the scheduled step-down of federal incentives, sustaining uptake after 2030.
Corporate-PPA Demand Transforms Commercial Solar Economics
C&I buyers now treat renewable PPAs as cost-hedging tools, not just ESG optics. Mining, data-center, and food-processing firms have locked in 10 to 15-year deals covering up to 30% of operating-cost exposure to grid power. Aggregated PPAs allow mid-tier firms to split a single project’s output, granting them utility-scale economics. Contract sizes of 50-650 MW are common, underpinning bankability and enabling developers to secure low-interest green loans. Developers differentiate by offering shaped deliveries backed by co-located batteries, helping corporate buyers match load profiles and meet 24/7 renewable targets.
Rooftop Grid Parity Accelerates Residential Adoption
Household solar pays for itself from day one because retail tariffs exceed AUD 300/MWh in several regions. System prices have fallen fast enough that the impending Small-Scale Technology Certificate (STC) phase-down is already baked into consumer economics. Virtual power-plant (VPP) programs further sweeten returns by compensating households for providing aggregated frequency response and participating in wholesale markets. High daytime loads from EV charging, heat pumps, and pool pumps sharpen self-consumption rates, improving net savings and growing the addressable base. The result is steady monthly demand that keeps a nationwide installer network fully utilized, despite tapering incentives.
Restraints Impact Analysis
| Restraints Impact Analysis | (~) % Impact on CAGR Forecast | Geographic Relevance | Impact Timeline |
|---|---|---|---|
| Grid transmission constraints | -2.10% | Regional NSW, Northern Queensland, remote WA | Medium term (2-4 years) |
| Phase-down of federal STC incentives | -1.80% | National, strongest in residential | Long term (≥4 years) |
| Land-use conflicts in agrarian zones | -1.20% | Rural NSW, Victoria, Queensland | Medium term (2-4 years) |
| HV transformer & inverter shortages | -1.60% | Nationwide utility projects | Short term (≤2 years) |
| Source: Mordor Intelligence | |||
Grid Transmission Constraints Limit Regional Development
The legacy grid was built around coastal coal plants, leaving sun-rich inland regions undersupplied with high-capacity lines. AEMO estimates AUD 12.9 billion is needed for new transmission, but permitting and community consultation stretch build times to 5-7 years.(3)Australian Energy Market Operator, “Integrated System Plan 2024,” aemo.com.au Projects in northern Queensland and western NSW often cap installations below optimal sizes or face curtailment. The mismatch funnels investment into already-connected zones, inflating land prices and creating development clusters where competition for grid access outstrips site availability. Delays dampen the overall growth of the Australian Solar Power market by restricting geographically diversified expansion.
Phase-Down of Federal STC Incentives Creates Investment Uncertainty
STC value reductions after 2030 will cut residential system value by AUD 3,000-5,000, elongating payback periods for price-sensitive households. Although falling hardware prices partly offset the change, retailers face a demand pull-forward ahead of the deadline, followed by a potential dip, which complicates workforce and inventory planning. The policy cloud forces small installers to secure bridging finance or diversify into battery and EV-charger services, adding operational complexity.
Segment Analysis
By Technology: Solar PV Sustains Total Dominance
Solar PV accounted for the entire Australian Solar Power market share in 2024, and the segment is expected to grow at a 14.5% CAGR to 2030 as module costs continue to fall. Concentrated solar power pipelines have been rendered obsolete because PV-plus-battery plants can replicate dispatchable output at a lower capital intensity. Monocrystalline silicon modules captured 85% of the 2024 installations, and pilot perovskite-silicon tandems could lift nameplate efficiencies to around 30% by 2027. This trajectory enables developers to reduce land footprints and unlock marginal sites near substations, thereby enhancing overall project bankability within the Australian Solar Power market.
Pilot floating-solar projects totaling 50 MW illustrate a niche that addresses evaporation control for water utilities while bypassing land-use debates. Utility IPPs view floating arrays as diversification plays that complement ground-mount portfolios. Meanwhile, CSP technology providers have shifted resources to the Middle East, confirming the local market’s commitment to PV cost leadership.
Note: Segment shares of all individual segments available upon report purchase
Get Detailed Market Forecasts at the Most Granular Levels
Download PDF
By Grid Type: Off-Grid Growth Outpaces On-Grid Base
Grid-connected systems still dominate the Australian solar power market, accounting for 98.7% of the market size in 2024, underpinned by robust feed-in policies and existing transmission infrastructure. Yet, off-grid capacity is expected to rise at a 19.9% CAGR through 2030 as mining and remote community customers replace diesel with solar-battery hybrids. Mining majors now deploy 5-50 MW arrays that cut diesel consumption by up to 80% and advance decarbonization goals. Telecom towers and emergency facilities also migrate to renewables as lithium-ion pack prices fall.
Government grants that target Indigenous communities further underpin off-grid economics, aligning social policy with clean-energy deployment. Developers are increasingly bundling solar, storage, and microgrid control systems to deliver turnkey solutions, thereby widening revenue streams beyond mere panel sales.
By End-User: Utility-Scale Surge Redefines Segment Mix
Households held 69.3% of 2024 capacity, but utility-scale plants will outpace them with a 23.4% CAGR, reshaping the Australian Solar Power market by 2030.(4)Clean Energy Regulator, “Small-scale Renewable Energy Scheme,” cleanenergyregulator.gov.au Large projects enjoy economies of scale that slice capex to AUD 800-1,000/kW and access wholesale pricing. Corporate PPAs de-risk revenue and attract pension-fund capital, thereby accelerating pipelines in renewable energy zones.
The commercial-and-industrial (C&I) sector grows steadily as companies install rooftop and car-park canopies to hedge their bills and meet ESG targets. Building-integrated PV options such as façade slabs enter pilot phases in logistics hubs, signaling design-led growth paths. Residential momentum remains robust through VPP aggregation, letting owners capture frequency-response payments and enhance returns even after STC tapering.
Note: Segment shares of all individual segments available upon report purchase
Get Detailed Market Forecasts at the Most Granular Levels
Download PDF
Geography Analysis
New South Wales drives capacity gains with a plan to add 12 GW of generation and AUD 15 billion in supporting lines by 2030, drawing bids at record-low prices of AUD 35/MWh.(5)NSW Department of Planning and Environment, “Electricity Infrastructure Roadmap,” planning.nsw.gov.au Solar adoption exceeds 35% of eligible roofs, creating a leadership position in both utility and distributed segments. Queensland ranks second, thanks to its superior irradiation and demand from the mining sector. State support for 50% renewables by 2030 expedites project approvals, though northern grid congestion tempers the rollout pace.
Victoria emphasizes distributed energy resources, subsidizing more than 200,000 residential systems via the Solar Homes Program. The policy couples rooftop penetration with VPP participation, stabilizing local networks during peak export periods. South Australia continues its technical leadership, regularly exceeding 100% renewable generation at midday and advancing hydrogen precincts that tie new solar farms to electrolysis demand.
Western Australia’s largely separate grid and mineral-focused economy favors off-grid arrays serving mines and processing plants. The South West Interconnected System tests high-renewable penetration without interstate balancing, providing a laboratory for grid-forming inverter controls. Tasmania’s hydro base offers natural storage that complements limited solar build-out, while the Northern Territory harnesses strong irradiation for diesel-replacement micro-grids that power remote communities.
Competitive Landscape
The Australian Solar Power market is moderately fragmented. Eight to ten developers, Neoen, AGL Energy, Origin Energy, Lightsource bp, and Genex Power, among them, capture around 60% of utility-scale capacity announcements. International module suppliers, such as JinkoSolar and Risen Energy, dominate the hardware market, while local EPC firms lead project execution through their regulatory fluency and grid-integration expertise. Residential installation remains highly dispersed, with hundreds of small firms competing on customer service and package deals that bundle storage and EV chargers.
Strategically, electricity retailers are vertically integrating by purchasing or developing solar farms to hedge their retail market exposure. Pure-play developers seek differentiation by pairing batteries or offering 24/7 renewable packages to data-center customers. Agrivoltaic pilots and floating-solar projects represent white-space plays where specialized engineering provides first-mover advantages.
Supply-chain resilience influences competitive standing. Tesla Energy’s local Powerwall line and SMA’s Melbourne service hub shorten lead times for storage and inverter equipment, appealing to installers fearing shipping bottlenecks. Meanwhile, the Australian Competition and Consumer Commission monitors installer pricing practices to safeguard consumers amid booming rooftop demand.
Australia Solar Power Industry Leaders
-
AGL Energy Limited
-
Infigen Energy Ltd.
-
Neoen SA
-
FirstSolar Inc.
-
SunPower Corporation
- *Disclaimer: Major Players sorted in no particular order
Need More Details on Market Players and Competitors?
Download PDF
Recent Industry Developments
- October 2024: Neoen announced the completion of its 460 MW Goyder South Solar Farm in South Australia, featuring 150 MW of co-located battery storage that provides grid stability services to the National Electricity Market.
- October 2024: Origin Energy secured a 15-year power purchase agreement with Alcoa for 210 MW of solar generation from the proposed Darling Downs Solar Farm in Queensland, marking the largest corporate renewable energy contract in Australian mining sector history.
- August 2024: Canadian Solar announced a AUD 400 million (USD 268 million) investment to establish a 2 GW solar module manufacturing facility in New South Wales, representing the first large-scale PV manufacturing plant in Australia since 2019.
- July 2024: AGL Energy completed the acquisition of Tilt Renewables' Australian portfolio for AUD 2.4 billion (USD 1.6 billion), adding 1.2 GW of operational renewable capacity, including 800 MW of solar projects across Queensland and New South Wales.
- June 2024: Tesla Energy commissioned a 50 MW/100 MWh battery system at the Darlington Point Solar Farm in New South Wales, creating Australia's largest solar-plus-storage installation and demonstrating grid-scale energy storage capabilities for renewable energy integration.
Australia Solar Power Market Report Scope
Solar power can be referred to as using the energy from the sun to produce electricity, either directly as thermal energy (heat) or indirectly through photovoltaic cells in solar panels and clear photovoltaic glass.
The Australian solar power market is segmented by Type and PV Deployment. By type, the market is segmented into solar photovoltaic (PV) and concentrated solar power (CSP). By PV deployment, the market is segmented into utility and non-utility. For each segment, market sizing and forecasts have been done based on installed capacity (GW).
By Technology
| Solar Photovoltaic (PV) |
| Concentrated Solar Power (CSP) |
By Grid Type
| On-Grid |
| Off-Grid |
By End-User
| Utility-Scale |
| Commercial and Industrial (C&I) |
| Residential |
By Component (Qualitative Analysis)
| Solar Modules/Panels |
| Inverters (String, Central, Micro) |
| Mounting and Tracking Systems |
| Balance-of-System and Electricals |
| Energy Storage and Hybrid Integration |
| By Technology | Solar Photovoltaic (PV) |
| Concentrated Solar Power (CSP) | |
| By Grid Type | On-Grid |
| Off-Grid | |
| By End-User | Utility-Scale |
| Commercial and Industrial (C&I) | |
| Residential | |
| By Component (Qualitative Analysis) | Solar Modules/Panels |
| Inverters (String, Central, Micro) | |
| Mounting and Tracking Systems | |
| Balance-of-System and Electricals | |
| Energy Storage and Hybrid Integration |
Need A Different Region or Segment?
Customize Now
Key Questions Answered in the Report
How fast is capacity expected to grow in the Australia Solar Power market through 2030?
Grid-connected and off-grid installations together are on track to climb from 38.47 GW in 2024 to 85.50 GW by 2030, a 14.47% CAGR.
Which technology type dominates new projects?
Solar PV remains the only commercially deployed option, holding 100% share and outpacing concentrated solar power on cost and versatility.
Why are corporate PPAs important to the sector?
Long-term PPAs with miners, data centers, and manufacturers de-risk revenue streams and enable low-cost project finance at sub-AUD 40/MWh prices.
What role does storage play in future growth?
Battery pairing now earns ancillary-service income and meets new grid-stability rules, making solar-plus-storage the preferred configuration for large plants.
Will the phase-down of STC incentives hurt residential demand?
Hardware price declines and VPP revenue opportunities are expected to offset lower STC values, keeping household payback periods near 3-4 years.
Which states lead deployment?
New South Wales tops utility-scale growth, Queensland follows with resource-rich sites, while Victoria drives rooftop penetration through subsidies.
Page last updated on:


