Market Overview
| Study Period | 2021 - 2031 |
|---|---|
| Forecast Data Period | 2026 - 2031 |
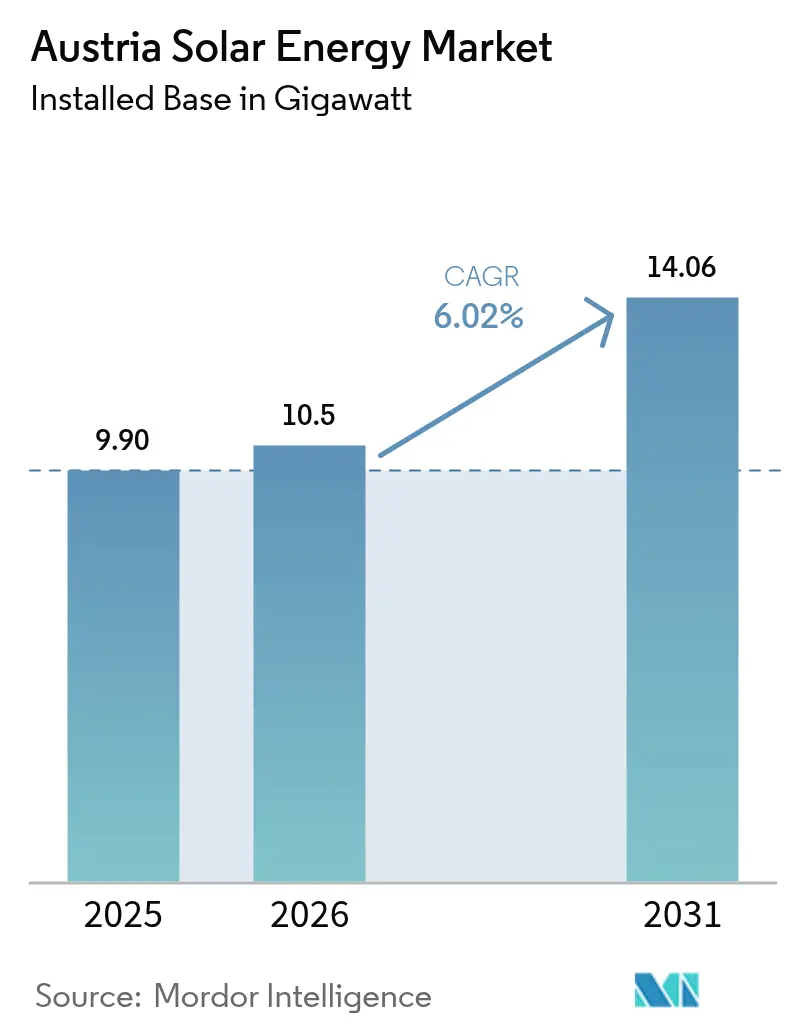
| Base Year Market Size (2025) | 9.90 gigawatt |
| Market Volume (2026) | 10.5 gigawatt |
| Market Volume (2031) | 14.06 gigawatt |
| Growth Rate (2026 - 2031) | 6.02% CAGR |
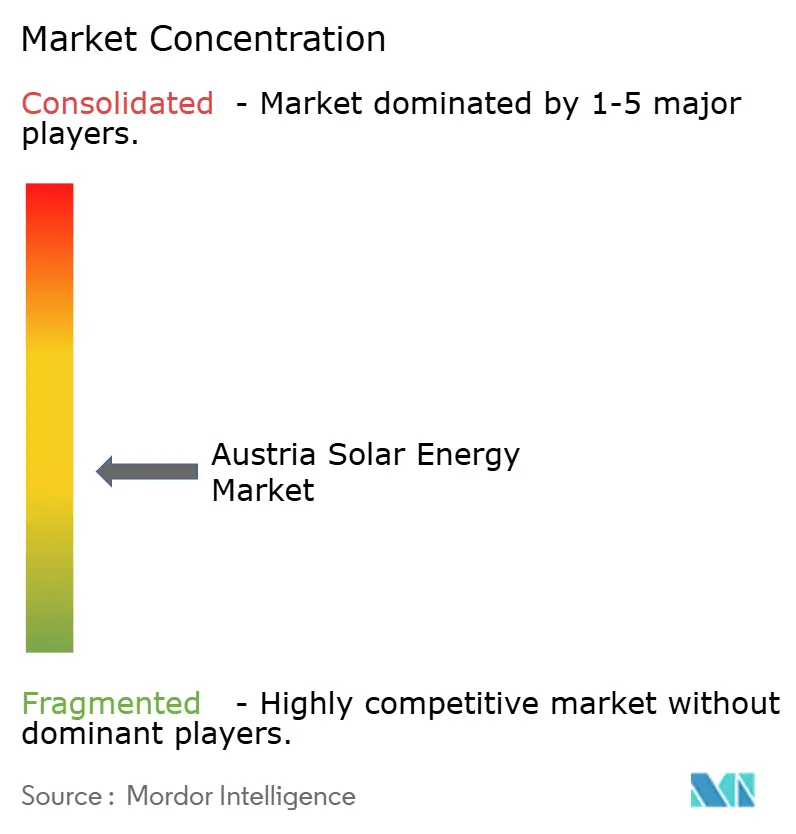
| Market Concentration | Medium |
Major Players *Disclaimer: Major Players sorted in no particular order Image © Mordor Intelligence. Reuse requires attribution under CC BY 4.0. | |
Austria Solar Energy Market Analysis by Mordor Intelligence
The Austria Solar Energy Market size is expected to grow from 9.90 gigawatt in 2025 to 10.5 gigawatt in 2026 and is forecast to reach 14.06 gigawatt by 2031 at 6.02% CAGR over 2026-2031.
Momentum stems from the Erneuerbare-Ausbau-Gesetz mandate for 11 TWh of annual photovoltaic generation by the end of the decade and the country's alignment with the European Union's 2030 renewable electricity target. Rapid declines in module costs, a reinstated VAT exemption for systems below 35 kW, and a EUR 60 million rooftop subsidy have shortened residential payback periods to fewer than nine years. At the same time, agrivoltaic projects such as Burgenland Energie's 164 MW Tadten plant illustrate how dual land-use models circumvent traditional permitting frictions while adding new revenue streams. Distribution-grid bottlenecks, skilled-labor shortages, and rooftop fire-safety codes temper this outlook, yet have not reversed overall growth.
Key Report Takeaways
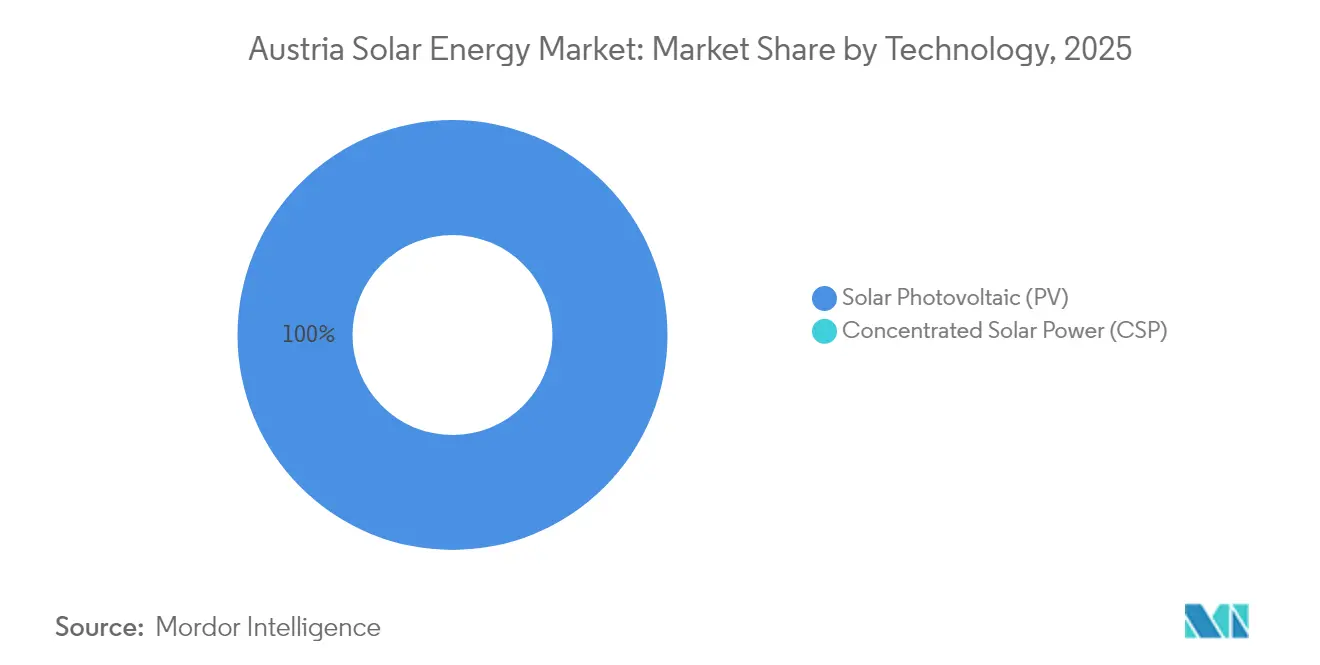
- By technology, solar photovoltaic retained 100.00% share of the Austria solar energy market in 2025 and is set to advance at a 6.02% CAGR through 2031.
- By grid type, on-grid systems held 99.28% of the Austria solar energy market share in 2025 and are forecast to grow at a 6.55% CAGR to 2031.
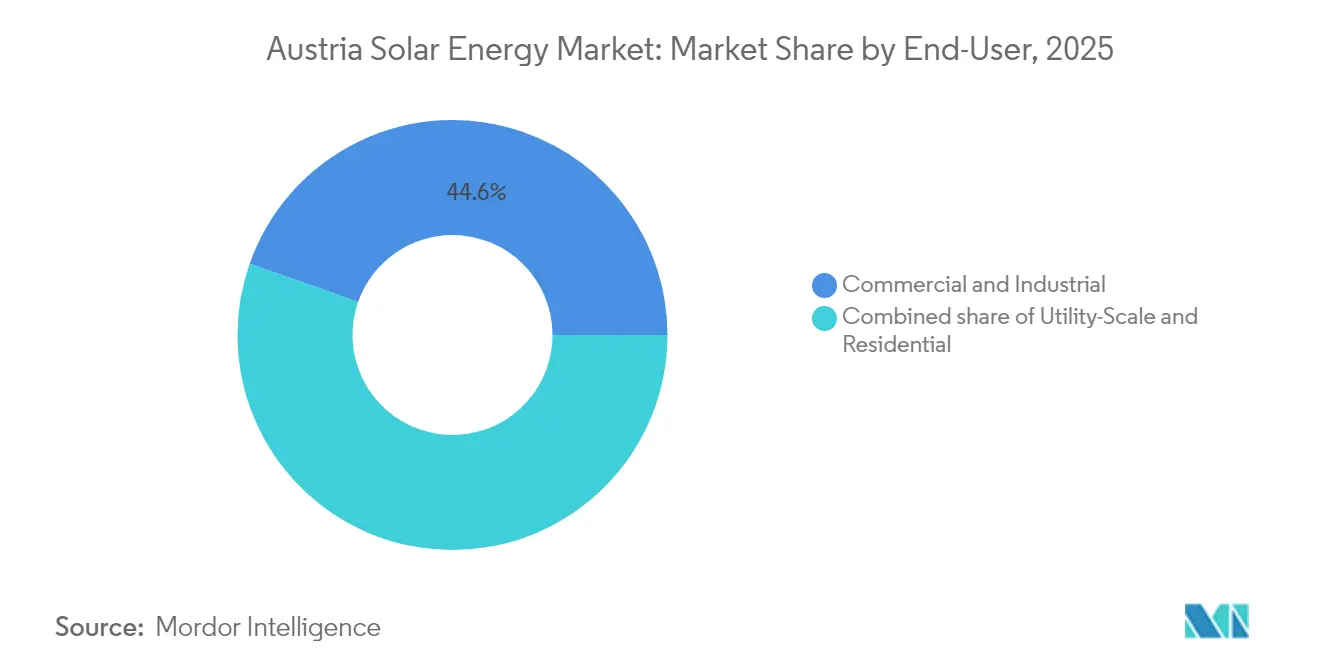
- By end-user, commercial and industrial installations controlled 44.62% of the Austria solar energy market size in 2025, whereas the residential segment is expanding at a 9.78% CAGR to 2031.
Note: Market size and forecast figures in this report are generated using Mordor Intelligence’s proprietary estimation framework, updated with the latest available data and insights as of 2026.
Austria Solar Energy Market Trends and Insights
Drivers Impact Analysis*
| Driver | (~) % Impact on CAGR Forecast | Geographic Relevance | Impact Timeline |
|---|---|---|---|
| Generous investment subsidy & feed-in tariff scheme | 1.80% | National, notably Vienna, Lower Austria, Burgenland | Short term (≤ 2 years) |
| EU 2030 100% renewable-electricity target | 1.20% | National, EU-wide alignment | Long term (≥ 4 years) |
| Rapid decline in PV module LCOE | 1.50% | National | Medium term (2-4 years) |
| Surge in corporate PPAs from energy-intensive industry | 0.90% | Burgenland, Lower Austria, Vienna | Medium term (2-4 years) |
| Agri-PV pilots unlocking dual land-use potential | 0.60% | Burgenland, Styria | Long term (≥ 4 years) |
| Citizen-owned energy cooperatives scaling community solar | 0.40% | Rural Lower Austria, Styria, Carinthia | Medium term (2-4 years) |
| Source: Mordor Intelligence | |||
Generous Investment Subsidy & Feed-in Tariff Scheme
Austria is allocating EUR 60 million in rooftop incentives for 2025, which reimburse EUR 1,000–1,500 per kWp for systems with a capacity below 10 kWp. The VAT exemption reinstated in 2025 for installations under 35 kW further reduces household payback periods to seven to nine years, accelerating the residential uptake that underpins the Austrian solar energy market. A “Made in Europe” 20% bonus diverts procurement toward suppliers such as Fronius and Greenonetec, counterbalancing lower-priced Asian imports. Demand spikes at each funding window exhaust the budget within four months, creating cyclical installation rushes that complicate labor scheduling and strain installer margins. Although subsidies improve economics, they do not ease grid congestion or skilled-labor gaps, meaning some approved projects still miss the construction season.
EU 2030 100% Renewable-Electricity Target
The binding EU directive requires Austria to increase its solar capacity to at least 12–13 GW by 2030, resulting in an 11 TWh production mandate under domestic law. Non-compliance would jeopardize access to EU climate funds, shielding policy continuity from domestic politics. The directive exposes supply-chain vulnerabilities, since Austria imports most modules and inverters; tariff shocks or shipping disruptions could derail timelines. The 10% year-on-year decline in 2024 additions to 2.2 GW highlighted how grid and permitting frictions, not demand, impede progress. Unless approvals and interconnections accelerate, the target risks slipping by 1–2 TWh, triggering the costly purchase of foreign renewable certificates.
Rapid Decline in PV Module LCOE
Polysilicon prices fell from USD 35/kg in 2022 to USD 7–8/kg in 2024, resulting in a 50–60% decrease in module costs.[1]International Energy Agency, “PV Module Cost Trends 2024,” iea.org Utility-scale LCOE now ranges between EUR 0.04 and 0.06 per kWh, making new PV arrays about 30–40% cheaper than gas-fired peakers. Residential systems cost EUR 1,200–1,800 per kWp, making them viable even without subsidies in high-irradiance regions such as Carinthia and Styria. Borealis’s 70 GWh-per-year PPA at EUR 0.05–0.06 per kWh confirms corporate appetite for long-term price certainty below wholesale levels. However, Austria’s lack of domestic module production leaves the Austria solar energy market exposed to any rebound in global pricing or trade disputes.
Surge in Corporate PPAs from Energy-Intensive Industry
Industrial electricity accounted for roughly 25 TWh in 2024, equal to 8–12% of operating expenses for heavy manufacturers. The Borealis-Burgenland Energie contract guarantees 70 GWh per year from 2026 at a fixed price under retail rates, showcasing a template that could anchor 6–8 GW of future capacity if replicated across Austria’s 50–60 large sites. Vienna Airport’s on-site arrays now cover 30% of demand, reducing transmission losses and enhancing security of supply. Yet typical PPAs run 15–20 years, longer than many corporate planning cycles, and a shortage of standardized contracts slows deal flow. Credit-enhancement solutions remain limited, further constraining uptake.
Restraints Impact Analysis*
| Restraint | (~) % Impact on CAGR Forecast | Geographic Relevance | Impact Timeline |
|---|---|---|---|
| Land-use permitting bottlenecks for ground-mount plants | -0.80% | Burgenland, Lower Austria | Short term (≤ 2 years) |
| Distribution-grid congestion & interconnection delays | -0.70% | Lower Austria, Burgenland | Medium term (2-4 years) |
| Skilled-labor shortage for PV installation & O&M | -0.50% | National, acute in Vienna | Short term (≤ 2 years) |
| Stricter rooftop fire-safety codes raising CAPEX | -0.30% | National, especially urban areas | Short term (≤ 2 years) |
| Source: Mordor Intelligence | |||
Land-Use Permitting Bottlenecks for Ground-Mount Plants
Agricultural land claims extend approval cycles for ground-mount systems to 12–24 months, inflating financing costs by up to 10% as interest accrues during delays. The federal structure means each province sets unique criteria; Lower Austria enforces wider setbacks than Styria, which approves degraded-land sites within ten months. Developers familiar with Spain’s streamlined rules perceive Austrian processes as risky, limiting international participation and concentrating projects among domestic utilities. Without harmonization, Austria could fall 1–2 GW short of its 2030 target.
Distribution-Grid Congestion & Interconnection Delays
High penetration in Lower Austria and Burgenland results in a 2–3% curtailment of potential output during summer peaks. Interconnection queues for projects exceeding 10 MW can stretch up to 18 months, while residential rooftops receive priority approvals under simplified rules. EVN’s plan to add 70 MW of batteries by 2027 will help absorb surplus generation; however, until the upgrades are in place, curtailment persists. Commercial developers face disputes over grid extension cost allocation, which delays financing decisions. Export capacity to neighboring grids is capped at 2–3 GW, resulting in some summer generation being stranded.
*Our forecasts treat driver/restraint impacts as directional, not additive. The impact forecasts reflect baseline growth, mix effects, and variable interactions.
Segment Analysis
By Technology: PV Monopoly Reflects Climate Realities
Solar photovoltaic captured 100.00% of installations in 2025 as Austria’s diffuse irradiance renders concentrated solar power uneconomic. The Austria solar energy market size for PV reached 9.90 GW and is on course for a 6.02% CAGR, underpinned by bifacial modules that already power 25–30% of new utility plants. Single-axis trackers are used in 40–50% of ground-mount projects, increasing yields by up to 25% while adding EUR 100–150 per kWp to the capital cost, a premium that is only acceptable above a 10 MW scale. High-altitude arrays like Wien Energie’s 15 MW Ratten plant generate 15–20% more winter output thanks to snow reflectance. The absence of CSP eliminates thermal-storage cogeneration, so lithium-ion batteries or pumped hydro must bridge the intermittency.
Continued PV dominance simplifies installer training and supply logistics, yet exposes the Austria solar energy market to PV-specific disruptions, including polysilicon shortages or inverter component scarcity. Module imports from Asia exceeded 75% of the volume in 2024; any trade restrictions could slow down builds. Conversely, EU manufacturers benefit from the 20% “Made in Europe” bonus, nudging procurement toward regional suppliers and cushioning geopolitical shocks.


By Grid Type: On-Grid Dominance Masks Off-Grid Niches
On-grid installations represented 99.28% of the Austria solar energy market share in 2025 and are forecast to grow at a 6.55% CAGR to 2031, outperforming the total market as residential rooftops and utility farms connect to strong networks covering 99.9% of households. Off-grid capacity of 0.72% serves alpine huts and remote farm buildings where line extension costs exceed EUR 50,000 per km. On-grid hybrid plants, such as EVN's 20 MW PV plus 5 MW battery site at Theiss, earn EUR 0.02–0.03 per kWh from balancing services in addition to energy sales.
The Austrian solar energy market size for on-grid systems is expected to continue expanding, driven by distribution firms' investments of EUR 3 billion to upgrade digital substations and add 70 MW of storage by 2027. Off-grid demand grows at a 4.06% CAGR, constrained by limited site availability. IEC 62109 compliance adds EUR 200–400 per kW in safety equipment for grid-connected arrays, thereby reducing the price differential with off-grid systems. Thus, remote cabins remain the primary off-grid adopters, a niche that is unlikely to exceed 20 MW nationally by 2030.
By End-User: Residential Surge Challenges C&I Leadership
Commercial and industrial rooftops commanded 44.62% of the Austria solar energy market in 2025, driven by warehouse mandates and cost-hedging PPAs. Yet, residential arrays will grow at a 9.78% CAGR, positioning households for a 40.00–42.00% share by 2031. Subsidies and VAT relief reduce payback periods to below nine years, while 675 renewable energy communities monetize their surplus at peer-to-peer prices higher than feed-in tariffs.
C&I growth moderates to single-digit rates as prime rooftops saturate and grid fees rise for large offtakers. Vienna Airport’s installation of 8–10 MW illustrates the scale benefits, covering approximately 30% of its consumption. Utility-scale farms, the smallest end-user tranche at 20–25%, deliver the lowest LCOE of EUR 0.04–0.06 per kWh but face 12–24 month permitting cycles and land conflicts, slowing expansion. Grid operators must invest in smart meters and responsive tariffs to manage two-way flows as prosumer numbers swell, a task baked into EVN’s upgrade roadmap.
Geography Analysis
Lower Austria and Burgenland contributed 58.73% of the 2025 capacity additions, owing to irradiance levels of 1,100–1,300 kWh/m² and ample flat land. Lower Austria installed roughly 1.36 GW in 2025, supported by EVN’s target of more than 300 MWp of new arrays by 2030. Burgenland hosts flagship projects, such as the 164 MW Tadten agrivoltaic plant and PÜSPÖK’s 257 MWp pipeline, attracting EUR 150–200 million of cross-border investment and leveraging access to Hungarian and Slovak grids.
Vienna, constrained by its roof area, still added 165–215 MW in 2025 through municipal mandates; Wien Energie aims to exceed 100 MWp by early 2025 for district heating electrification. Styria’s alpine sites, including the 15 MW Ratten plant at an elevation of 1,200 m, capture high winter yields that mitigate seasonal gaps. Upper Austria and Carinthia are accelerating through cooperative models, with Carinthia hosting the highest per-capita energy community count nationwide, underscoring the social acceptance benefits. The cross-border export capacity of 2–3 GW eases summer surpluses, yet leaves 10–15% of potential generation curtailed during periods of congestion. EUR 80–100 million in EU co-financing will upgrade lines by 2028, adding 1–1.5 GW export headroom and reducing curtailment risk. Differential permitting speeds—eight months in Styria versus 18 months in Lower Austria—lead developers to favor fast-track provinces, leaving slower regions behind. Battery deployment of 70 MW by 2027 will buffer local imbalances, but until then, curtailment persists.
Competitive Landscape
The top five players, Wien Energie, Verbund AG, EVN, Burgenland Energie, and KPV Solar, captured 35–40% of capacity additions in 2024, leaving the Austria solar energy market moderately fragmented. Wien Energie operates across generation, retail, and district heating, leveraging alpine bifacial arrays and trackers to boost winter output. Verbund AG, traditionally hydro-centric, entered ground-mount PV with its 2.7 MWp Güssing park, signaling a EUR 1–1.5 billion renewable pivot by 2030.
International inverter makers vie for grid-code compliance. Fronius’s 98.3% efficient Verto series now serves 30% of residential demand and benefits from the “Made in Europe” 20% subsidy uplift. Huawei and SolarEdge compete on cost and digital monitoring, yet they must also accommodate Austrian fire-safety regulations that mandate additional disconnect switches. Agrivoltaic specialists, such as PÜSPÖK Group, target dual-use niches, while energy cooperatives reduce acquisition expenses through peer-to-peer platforms like eFriends, thereby reshaping customer engagement.
Certification under IEC 62109 and 60364-7-712 creates entry barriers that favor established suppliers. Small installers partner with certified vendors to avoid the cost of independent conformity testing, preserving local competition.[4]Austrian Standards Institute, “Fire-Safety Upgrades for Rooftop PV 2024,” austrian-standards.at Technology strategies diverge: Wien Energie premiumizes through high-altitude, tracker-equipped arrays, whereas KPV Solar emphasizes low-cost fixed-tilt rooftops qualifying for “Made in Europe” subsidies. Such differentiation keeps the Austria solar energy market dynamic despite consolidation tendencies.
Austria Solar Energy Industry Leaders
Wien Energie GmbH
Verbund AG
KPV Solar GmbH
Fronius International GmbH
Energetica Industries GmbH
- *Disclaimer: Major Players sorted in no particular order

Recent Industry Developments
- December 2024: Burgenland Energie finalized the 164 MW Tadten agrivoltaic project, supplying 70 GWh annually under a Borealis PPA.
- November 2024: The European Investment Bank approved EUR 80 million for PÜSPÖK Group’s 257 MWp agri-PV portfolio with 8.6 MWh storage.
- August 2025: Austria allocated EUR 12 million for a second funding round of solar-plus-storage rebates in 2025, though the initial budget was quickly expanded to EUR 48.8 million due to high demand.


Austria Solar Energy Market Report Scope
Solar energy is a type of renewable energy that harnesses the sun's energy to generate electricity. Solar panels deployed on rooftops or mounted on the grounds are utilized effectively by energy consumers. In Poland, solar energy is the fastest-growing source of all renewable energy, and it is expected to outperform all rival sectors in the Polish energy industry.
The Austrian solar energy market is segmented by technology, grid type, and end-user. By technology, the market is segmented into Solar Photovoltaic (PV) and Concentrated Solar Power (CSP). By grid type, the market is segmented into on-grid and off-grid. By end user, the market is segmented into residential, commercial and industrial, and utility. The market sizing and forecasts for each segment have been considered based on the installed capacity (MW).
By Technology
| Solar Photovoltaic (PV) |
| Concentrated Solar Power (CSP) |
By Grid Type
| On-Grid |
| Off-Grid |
By End-User
| Utility-Scale |
| Commercial and Industrial (C&I) |
| Residential |
By Component (Qualitative Analysis)
| Solar Modules/Panels |
| Inverters (String, Central, Micro) |
| Mounting and Tracking Systems |
| Balance-of-System and Electricals |
| Energy Storage and Hybrid Integration |
| By Technology | Solar Photovoltaic (PV) |
| Concentrated Solar Power (CSP) | |
| By Grid Type | On-Grid |
| Off-Grid | |
| By End-User | Utility-Scale |
| Commercial and Industrial (C&I) | |
| Residential | |
| By Component (Qualitative Analysis) | Solar Modules/Panels |
| Inverters (String, Central, Micro) | |
| Mounting and Tracking Systems | |
| Balance-of-System and Electricals | |
| Energy Storage and Hybrid Integration |


Key Questions Answered in the Report
What capacity will Austrian solar reach by 2031?
Installed capacity is forecast to hit 14.06 GW by 2031, reflecting a 6.02% CAGR from 2026.
How large is the residential share of solar in Austria?
Residential systems will rise from 2025’s sub-40% level to about 40.00–42.00% of total capacity by 2031 on 9.78% CAGR growth.
Which provinces add the most solar each year?
Lower Austria and Burgenland together accounted for roughly 58.73% of 2025 additions thanks to favorable irradiance and land availability.
Why are agrivoltaic projects gaining traction?
Elevated panels protect crop yields while securing faster permits, and they could deliver 15–20% of new capacity by 2031.
Which companies lead Austrian solar development?
Wien Energie, Verbund AG, EVN, Burgenland Energie, and KPV Solar collectively control about 35–40% of recent capacity growth.
What limits large utility-scale solar in Austria?
Lengthy land-use permits, grid-connection delays, and local opposition extend timelines to 12–24 months, slowing expansion relative to rooftops.
Page last updated on:


