Market Overview
| Study Period | 2021 - 2031 |
|---|---|
| Forecast Data Period | 2026 - 2031 |
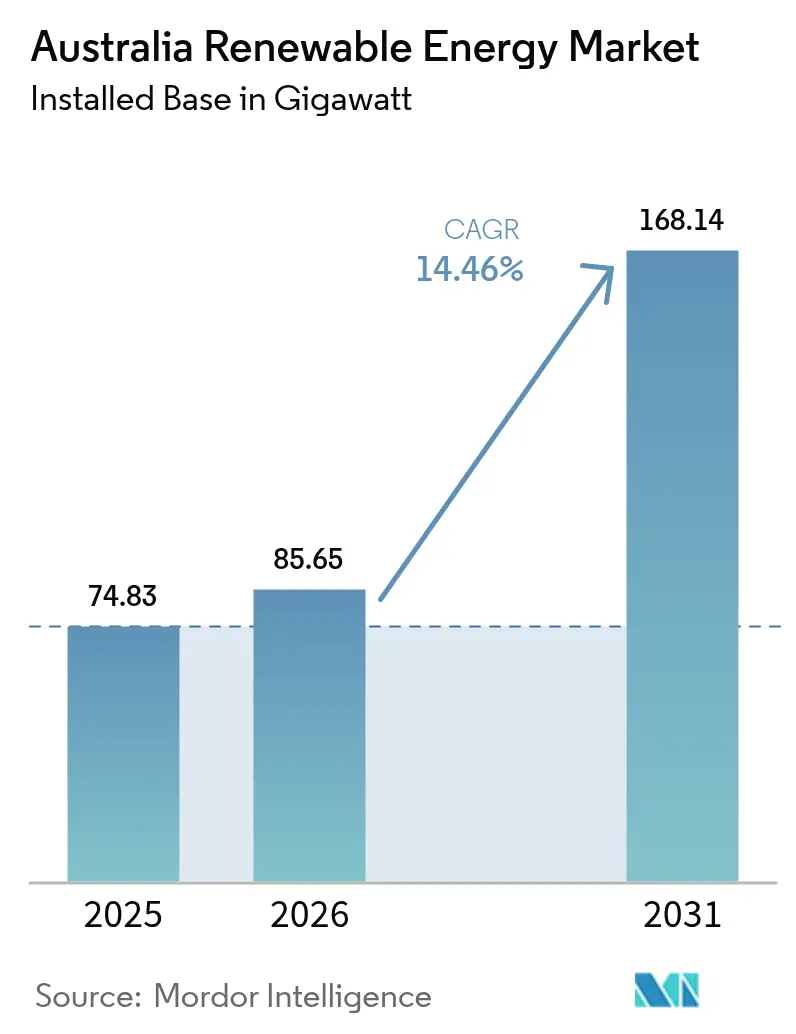
| Base Year Market Size (2025) | 74.83 gigawatt |
| Market Volume (2026) | 85.65 gigawatt |
| Market Volume (2031) | 168.14 gigawatt |
| Growth Rate (2026 - 2031) | 14.46% CAGR |
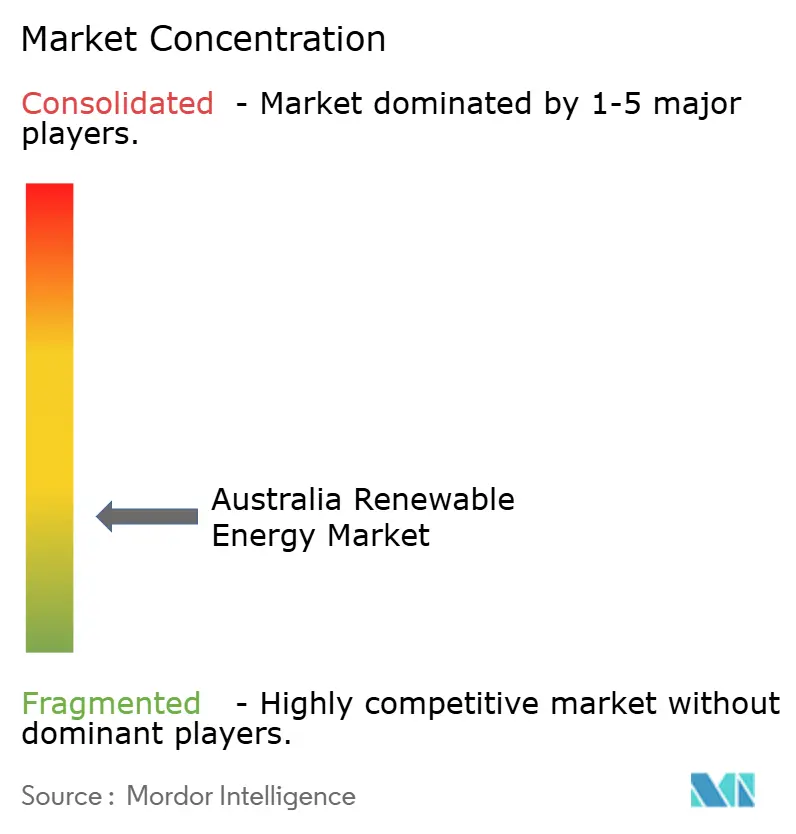
| Market Concentration | Low |
Major Players *Disclaimer: Major Players sorted in no particular order Image © Mordor Intelligence. Reuse requires attribution under CC BY 4.0. | |
Australia Renewable Energy Market Analysis by Mordor Intelligence
The Australia Renewable Energy Market size was valued at 74.83 gigawatt in 2025 and estimated to grow from 85.65 gigawatt in 2026 to reach 168.14 gigawatt by 2031, at a CAGR of 14.46% during the forecast period (2026-2031).
A supportive policy mix, rising corporate decarbonization goals, and rapid cost declines in utility-scale storage underpin this expansion. Grid-scale solar continues to lead capacity additions, yet wind power records the steepest growth trajectory as developers accelerate onshore and early-stage offshore pipelines. Investment flows favor projects sited inside designated renewable-energy zones, where streamlined approvals and pre-built transmission capacity shorten development cycles. Long-duration batteries now clear financial close alongside generation assets, allowing higher instantaneous penetration of variable renewables. Simultaneously, miners and data-center operators lock in long-term power purchase agreements that de-risk giga-scale builds and diversify revenue streams for generators.
Key Report Takeaways
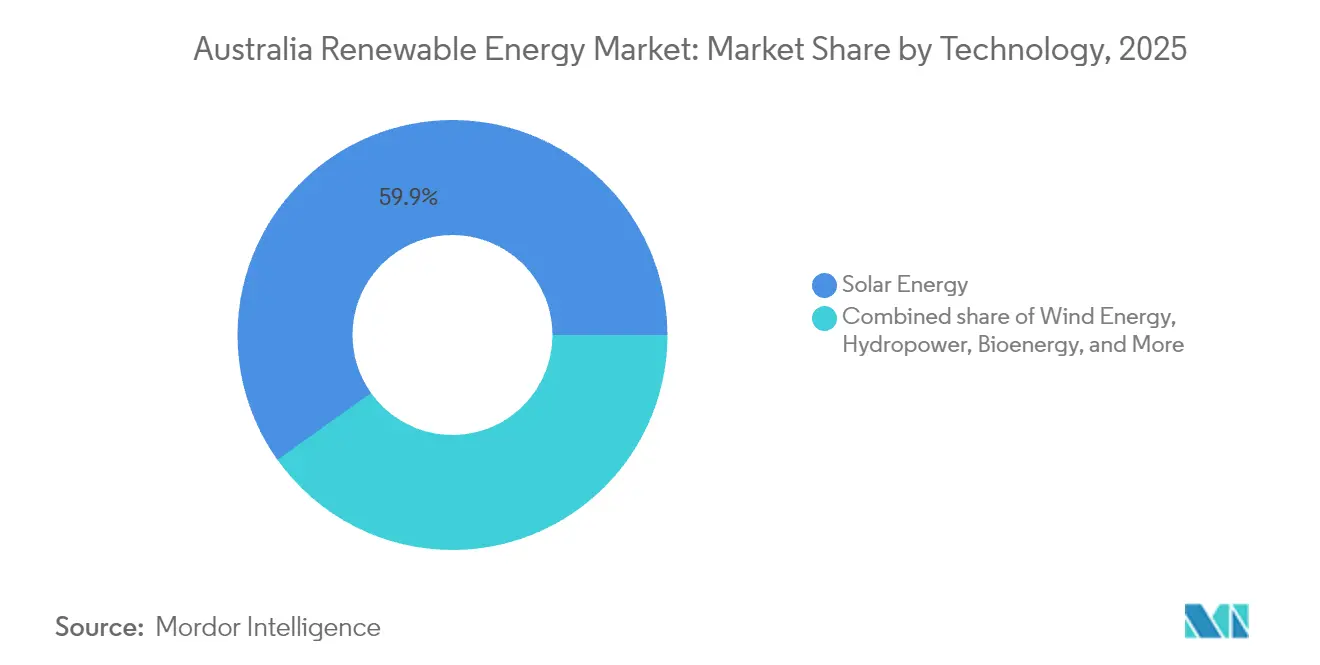
- By technology, solar held 59.85% of the Australian renewable energy market share in 2025, while wind is forecast to surge at a 18.53% CAGR through 2031.
- By end-user, the utilities segment accounted for 61.55% of the Australian renewable energy market size in 2025, whereas the residential segment is projected to advance at a 15.88% CAGR to 2031.
- By geography, New South Wales and Victoria collectively accounted for 44.60% of the installed capacity in 2025; Queensland is expected to post the fastest CAGR among states to 2031.
Note: Market size and forecast figures in this report are generated using Mordor Intelligence’s proprietary estimation framework, updated with the latest available data and insights as of 2026.
Australia Renewable Energy Market Trends and Insights
Drivers Impact Analysis*
| Driver | (~) % Impact on CAGR Forecast | Geographic Relevance | Impact Timeline |
|---|---|---|---|
| Rising utility-scale solar PV capex inflows | +3.20% | National; NSW, Victoria, Queensland | Medium term (2-4 years) |
| Federal & state-level renewable-energy-target extension | +2.80% | National; renewable-energy zones | Long term (≥ 4 years) |
| Corporates’ RE-powered mining & data-center commitments | +2.10% | Western Australia, Queensland | Medium term (2-4 years) |
| Surge in long-duration battery projects unlocking additional RE capacity | +1.90% | South Australia, Victoria | Short term (≤ 2 years) |
| Green-hydrogen export hubs driving forward contracted new builds | +1.50% | Western Australia, Northern Territory | Long term (≥ 4 years) |
| Source: Mordor Intelligence | |||
Rising Utility-Scale Solar PV Capex Inflows
Committed investment in grid-scale solar reached AUD 12 billion (USD 7.9 billion) across 47 projects during 2024, confirming solar’s cost leadership and bankability in the Australian renewable energy market.(1)Neoen, “Neoen Secures Major PPA for Western Downs Green Power Hub,” neoen.comLiquidity from pension funds and infrastructure investors now pairs equity with concessional Australian Renewable Energy Agency grants, stretching tenor and trimming weighted-average cost of capital. Developers bundle batteries or synchronous condensers into the same balance sheet to meet new grid strength standards, a structure that accelerates interconnection approval. Competition has intensified for prime sites within the New England, Central Queensland, and Murray River zones where transmission headroom and high irradiance co-exist.
Federal & State-Level Renewable Energy Targets Extension
The federal commitment to 82% renewable electricity by 2030 removes revenue-signal ambiguity and cements confidence in the Australian renewable energy market.(2)Department of Climate Change, Energy, the Environment and Water, “Renewable Energy Targets,” energy.gov.au State ambitions go further: Victoria targets 95% by 2035, Queensland 70% by 2032, ensuring a multi-decade build queue. Updated Large-Scale Generation Certificates underpin forward-offtake structures, while AEMO’s Integrated System Plan prioritizes corridors such as HumeLink and VNI West, embedding a renewable-first grid expansion.
Corporates’ RE-Powered Mining & Data-Center Commitments
BHP’s Nickel West division achieved 100% renewable electricity via 181 MW of wind and solar offtake, setting a procurement template for hard-to-abate sectors.(3)BHP, “Nickel West Secures 100% Renewable Power,” bhp.com NextDC followed with a 132 MW dedicated solar farm, evidencing hyperscaler pressure on data-center operators. These long-dated PPAs stabilize revenue, compress merchant risk premia, and stimulate an industrial load shift toward renewable-rich regions such as the Pilbara, Bowen Basin, and Gippsland.
Surge in Long-Duration Battery Projects Unlocking Additional RE Capacity
New battery commitments totaled 4.1 GW in 2024, spanning lithium-ion, vanadium flow, and compressed-air prototypes.(4)AEMO, “Data Dashboard NEM,” aemo.com.au South Australia’s Hornsdale and Torrens Island systems demonstrated frequency-control earnings that now inform investment cases nationwide. Eight- to twelve-hour storage windows offered by flow batteries align with evening peak prices, further raising the ceiling on variable renewable energy penetration.
Restraints Impact Analysis*
| Restraint | (~) % Impact on CAGR Forecast | Geographic Relevance | Impact Timeline |
|---|---|---|---|
| Transmission congestion & weak grid hosting capacity | -2.10% | Rural NSW, Queensland zones | Medium term (2-4 years) |
| Policy uncertainty around capacity-investment-scheme timing | -1.30% | National | Short term (≤ 2 years) |
| Transformer & HV component import lead-time spikes | -1.10% | National | Short term (≤ 2 years) |
| Community resistance to new inter-state transmission corridors | -0.80% | Rural NSW, Victoria | Long term (≥ 4 years) |
| Source: Mordor Intelligence | |||
Transmission Congestion & Weak Grid Hosting Capacity
AEMO flagged 23 constraint points where renewable output is curtailed by up to 15% during midday peaks, eroding the project's internal rate of return and diluting the short-run marginal cost advantage over thermal plants. Developers increasingly layer AUD 50-100 million (USD 33-66 million) of bespoke transmission upgrades into feasibility budgets, narrowing site selection to zones with pre-built backbone lines.
Transformer & HV Component Import Lead-Time Spikes
Clean Energy Council surveys indicate 18-24 month transformer queues, compared to the historic 8-12 months, which shifts critical-path scheduling and inflates engineering, procurement, and construction budgets by up to AUD 50 million (USD 33 million) for a typical 200 MW build.(5)Clean Energy Council, “Supply Chain Challenges in the Renewable Sector,” cleanenergycouncil.org.au Developers hedge by dual-sourcing from European and Korean vendors, yet local content remains marginal.
*Our forecasts treat driver/restraint impacts as directional, not additive. The impact forecasts reflect baseline growth, mix effects, and variable interactions.
Segment Analysis
By Technology: Solar Dominance Faces Wind Energy Acceleration
Solar accounted for 59.85% of the Australian renewable energy market share in 2025, driven by sub-AUD 40/MWh (USD 26/MWh) levelized costs in the eastern seaboard’s high-irradiance belts. The Australian renewable energy market size for solar assets is forecast to expand at a 13.22% CAGR through 2031 as utility, commercial, and residential buyers continue to prize cost transparency and modular buildability. Utility investors favor giant single-axis tracking arrays within REZs, pairing them with four-hour batteries that capitalize on evening arbitrage spreads. Rooftop adoption remains potent; every second detached home built in 2025 is expected to ship with embedded solar-storage packages pre-rolled into mortgages.
Wind rides a faster 18.53% CAGR on the back of taller turbines, hub-heights above 200 meters, and a maturing offshore policy framework. Three offshore projects, totaling 5.4 GW, filed environmental-impact statements in 2024, led by the 2.2 GW Star of the South project off Gippsland, Victoria. These multi-gigawatt foundations underwrite new transmission spines and stabilize long-term network tariffs. Hydropower is expected to preserve its baseload niche with the completion of Snowy 2.0, which is scheduled to inject 2 GW of dispatchable capacity and 350 hours of storage in 2028. Bioenergy, geothermal, and ocean energy remain peripheral but gather localized momentum among agribusiness and remote communities seeking waste valorization and energy independence.


By End-User: Residential Surge Challenges Utility Dominance
Utilities held 61.55% of the Australian renewable energy market size in 2025, leveraging economies of scale to secure finance and grid access. Vertically integrated retailers sharpen focus on storage co-location and system-strength services to defend share against distributed generation. However, residential systems post a vigorous 15.88% CAGR as battery prices fall and virtual power plant aggregators guarantee homeowners annual bill credits. Roughly 4.3 GW of behind-the-meter capacity was installed in 2024, with feed-in tariffs slowly replaced by dynamic export limits and wholesale market participation rights administered through retailer apps.
Commercial and industrial buyers round out demand, pulled forward by science-based target timelines and brand risk management. National supermarket chain Woolworths secured a 100% renewable electricity supply via dedicated wind and solar PPAs, signaling that mid-market corporate buyers can now transact at scale without commodity-trading expertise. Utilities respond by bundling energy-management and demand-response services to replace foregone volumetric margins.

Geography Analysis
New South Wales and Victoria together represented 44.60% of the installed renewable capacity in 2025, buoyed by dense load centers, pre-existing transmission corridors, and well-defined renewable energy zone pipelines. Each state leverages competitive tender programs that harmonize grid strength standards with contract-for-difference support, thereby attracting lower-cost capital.
Queensland emerges as the fastest-growing state, posting multiyear renewable build tallies above 2 GW as its 70% renewable-by-2032 target converges with abundant solar resources in Central and North Queensland. Dedicated REZ transmission lines and concessional debt from the state-owned CleanCo spark gigawatt-scale pipeline announcements, such as the 1 GW Callide Renewable Hub. South Australia remains an international case study for high-penetration systems, reaching 73% renewable electricity in 2024 through a blend of wind, solar, and 750 MW of battery storage. Tasmania exports surplus hydroelectric power via Basslink and courts additional interconnectors to monetize excess wet-season output. Western Australia, operating the separate SWIS and NWIS grids, advances renewable-hydrogen super-projects in the Pilbara intended to serve Asian customers. The Northern Territory accelerates solar-plus-hydrogen proposals near Darwin Port, leveraging its equatorial irradiance and proximity to LNG export infrastructure.
Regulatory Landscape
Australia's renewable power market operates under the National Electricity Market governance stack led by the Australian Energy Market Commission (rule making), the Australian Energy Regulator (network and retail compliance, authorisations), and the Australian Energy Market Operator (system operations and planning), alongside the Clean Energy Regulator, which administers the Renewable Energy Target (RET). The RET framework under the Renewable Energy (Electricity) Act 2000 continues to underpin Large-Scale Generation Certificates used in offtake and financing structures, while national planning signals are reinforced through AEMO's Integrated System Plan and state renewable energy zone programs.
Policy is also expanding from generation to traceability and renewable-derived products. The Future Made in Australia (Guarantee of Origin) Act 2024 established a scheme to certify renewable electricity and products such as hydrogen and ammonia (effective from December 2024), aligning export-oriented hydrogen hubs with a formal tracking mechanism. In 2026, amendments to the Renewable Energy (Electricity) Regulations 2001 introduced measures covering battery-connected small generation units and linkages to the Cheaper Home Batteries Program, reflecting a stronger focus on integrating storage and consumer-side assets into the electricity system.
Competitive Landscape
The Australian small- and medium-sized renewable energy market remains moderately fragmented, with the five largest developers controlling approximately 42% of the installed capacity. Incumbent retailers AGL Energy and Origin Energy are pivoting toward renewables, yet they face intensifying competition from pure-play developers such as Neoen, Acciona Energia, and Iberdrola Australia. Grid-integration proficiency, rather than simply a gigawatt scale, now defines the competitive edge, as evidenced by Neoen’s 150 MW battery embedded in the 460 MW Western Downs Solar Hub, which secures ancillary-service revenue alongside a 15-year PPA.
Turbine original-equipment-manufacturers Vestas and Goldwind dominate onshore wind orders, while Siemens Gamesa and GE position for the emerging offshore tranche by establishing local training and component-assembly centers. Battery integrators Tesla and Fluence compete for state-sponsored tenders, offering multiyear performance-guarantee wraps that reassure conservative financiers. Corporate PPA aggregators enter the fray, enabling small- and medium-sized buyers to form buying groups that contract for utility-scale volumes. Market participants deploy digital twins and predictive maintenance to raise asset availability, while M&A activity targets late-stage pipelines rather than greenfield leases to mitigate permitting risk.
Australia Renewable Energy Industry Leaders
Tilt Renewables Ltd.
Acciona SA
Iberdrola SA
Vestas Wind Systems A/S
Xinjiang Goldwind Science & Technology Co., Ltd.,
- *Disclaimer: Major Players sorted in no particular order

Market Opportunities and Future Outlook
Firmed renewables and grid-integrated hybrids are creating whitespace as large industrial loads and retailers look for dispatchable clean supply rather than energy-only volumes. Project structures already reflect this: Edify Energy reached financial close in May 2026 on the Smoky Creek and Guthrie's Gap developments in Queensland (720 MWp solar paired with 600 MW / 2,400 MWh storage), showing how generation and multi-hour batteries are being bundled to improve bankability.
Network access and siting continue to shape near-term opportunity, with investment clustering around priority corridors and renewable energy zones where transmission build-out can improve connection certainty. The Australian Government's July 2026 National Renewable Energy Priority List (12 new projects) also functions as a screening anchor for developers and suppliers focused on grid-enabling infrastructure and large-scale generation. On the distributed side, the National Consumer Energy Resources (CER) Roadmap agreed in July 2024 creates room for aggregators, retailers, and DNSPs to expand orchestration of rooftop solar, household batteries, and flexible loads through export management and wholesale participation, complementing utility-scale build-outs rather than substituting for them.
Recent Industry Developments
- July 2026: Tilt Renewables commenced construction of the 288 MW Palmer wind farm in South Australia. The start of works advances a utility-scale onshore wind build that supports state-level decarbonization and adds contractor and OEM demand for turbines, civil works, and grid-connection packages.
- March 2026: The New South Wales Independent Planning Commission granted approval for Iberdrola Australia's 270 MW/1,080 MWh Kingswood battery energy storage system near Tamworth. The decision advances a large standalone storage asset through a key permitting gate, reinforcing the shift toward batteries as core infrastructure for firming variable renewable generation.
- December 2025: Acciona and joint venture partner Genus were awarded the contract to construct Victoria's 190-kilometre Western Renewables Link transmission line. The award strengthens the grid-enabling pipeline needed to connect renewable energy zones and influences project bankability by improving long-term hosting capacity in a constrained state network.


Research Methodology Framework and Report Scope
Market Definition and Coverage
For this study, the Australia renewable energy market is sized as the total installed power generation capacity that comes from renewable sources in Australia, measured in gigawatts and tracked by yearly additions and retirements.
Scope exclusions: We exclude fossil fuel and nuclear generation capacity and we do not count electricity sales revenue as market size.
Segmentation Overview
- By Technology
- Solar Energy (PV and CSP)
- Wind Energy (Onshore and Offshore)
- Hydropower (Small, Large, PSH)
- Bioenergy
- Geothermal
- Ocean Energy (Tidal and Wave)
- By End-User
- Utilities
- Commercial and Industrial
- Residential
Data Sources, Market Sizing, and Validation
Desk Research
Desk research was used to map the national renewable energy buildout and keep the model tied to observable power system signals. We referred to public sources such as Clean Energy Regulator updates, Australian Energy Market Operator (AEMO) planning and generation mix publications, Australian Bureau of Statistics energy statistics, and Department of Climate Change, Energy, the Environment and Water policy and program releases.
Alongside those, we reviewed project pipelines and commissioning notes from grid and market operator disclosures, company annual reports and investor presentations, and reputable energy press for timelines and capacity changes. A paid subscription focused on company financials and deal intelligence was used selectively to cross-check ownership changes and major project announcements. A patent database was also referenced to sense technology direction. These sources are illustrative only, and many other public materials were also consulted for data collection, validation, and clarification.
Primary Interviews and Surveys
Primary work focused on validating what is reaching grid connection, what is being delayed, and how developers and large buyers think about build rates for the next few years. We spoke with a mix of project developers, EPC and O&M providers, utilities, and large C&I power buyers, along with industry bodies, so desk assumptions could be corrected where needed and tightened through follow-up checks.
Distribution of primary research fieldwork respondents
| Company type | Respondent position | Region |
|---|---|---|
| Top tier: 31% | CXOs: 16% | |
| Mid tier: 51% | Functional/Unit leaders: 29% | |
| Smaller Players: 18% | Managers: 55% |
Market-Sizing & Forecasting
Sizing starts from a top-down reconstruction of installed renewable capacity in Australia, where national generation and capacity reporting is translated into a consistent GW base for each year and then carried forward using expected additions and retirements. The totals are checked with selective bottom-up approximations, including a roll-up of announced utility-scale projects that have reached financial close, plus sampled capacity-by-technology checks to confirm the aggregate does not drift away from what is being built.
Key inputs that shape the model include annual renewable capacity additions by technology, grid connection and commissioning timelines, pipeline maturity (announced versus under-construction), curtailment and system strength constraints in key regions, and policy-driven demand signals like renewable targets and corporate PPAs. When project-level information is incomplete, gaps are handled by applying conservative slip-rate assumptions by technology and project stage, which are then refined after primary discussions.
For forecasting, scenario analysis is used so the baseline path reflects the most likely pace of approvals, connection queues, and construction timing, while still showing how results move under faster or slower delivery conditions. Assumptions for build rates are kept transparent and cross-checked against expert expectations and recent year run-rates before finalizing the trajectory.
Data Validation & Update Cycle
Outputs are validated through triangulation across independent signals, including national capacity totals, technology shares, and the implied annual build rates versus recent commissioning history. If an outlier shows up, the drivers are revisited, and we re-check underlying inputs, followed by a second-pass analyst review before sign-off.
The report is refreshed annually, and interim updates are made when material events occur, including major policy shifts, large project cancellations, or step-changes in grid connection timing. Before delivery, a final review pass is completed so the numbers reflect the latest available public releases and confirmed interview learnings.
Mordor Intelligence's Australia Renewable Energy Market Estimate Compared With Other Published Estimates
Published numbers for this market often look far apart because the same terms, renewable energy market, are used for different things, such as installed capacity, electricity produced, or revenue. Differences also come from how firms treat behind-the-meter solar, whether storage is mixed into renewables, and how quickly pipeline delays are updated in forecasts.
The main gap comes from mixing value-based revenue sizing with capacity-based sizing. Mordor Intelligence counts renewable supply as installed GW commissioned in Australia, rather than counting electricity sales dollars that also move with wholesale prices and contract structures.
Benchmark comparison
| Source | Market Size | Gaps in Research Methodology |
|---|---|---|
| Mordor Intelligence | USD 74.83 B (2025) | |
| Global Consultancy A | USD 45.90 B (2025) | Uses revenue in USD as the core measure, so swings in power prices and contract pricing can change the market size even if installed GW grows steadily. |
| Industry Publisher B | USD 19.60 B (2024) | Uses a lower base year and a revenue lens that can exclude parts of the generation asset base while also applying different assumptions for what counts as renewable across technologies and applications. |
The spread across the three figures is mainly explained by unit choice and what is being counted, capacity versus revenue, plus year selection and refresh timing. By keeping the model tied to commissioning activity and capacity changes, the estimate stays traceable to a clear demand-and-supply buildout story that can be rechecked each year with the same steps.


Key Questions Answered in the Report
How large is the Australia renewable energy market in 2026?
Installed capacity stands at 85.65 GW, and it is forecast to reach 168.14 GW by 2031.
Which technology is growing fastest?
Wind capacity is forecast to expand at a 18.53% CAGR between 2026 and 2031.
Why are long-duration batteries critical for renewable expansion?
Batteries enable higher penetration of variable solar and wind by shifting excess generation to peak periods and providing grid-stability services.
What is driving residential adoption of renewables?
Falling rooftop solar-plus-storage costs and virtual-power-plant programs that pay households for exported energy fuel a 15.88% CAGR.
Which state is expected to lead future capacity additions?
Queensland posts the highest projected state-level CAGR, supported by a 70% renewable-by-2032 target and strong solar resources.
How fragmented is the developer landscape?
The top five players control roughly 42% of installed capacity, signifying moderate fragmentation and competitive project pipelines.
Page last updated on:


