インドエナジードリンク市場規模とシェア
市場概要
| 調査期間 | 2021 - 2031 |
|---|---|
| 予測データ期間 | 2026 - 2031 |
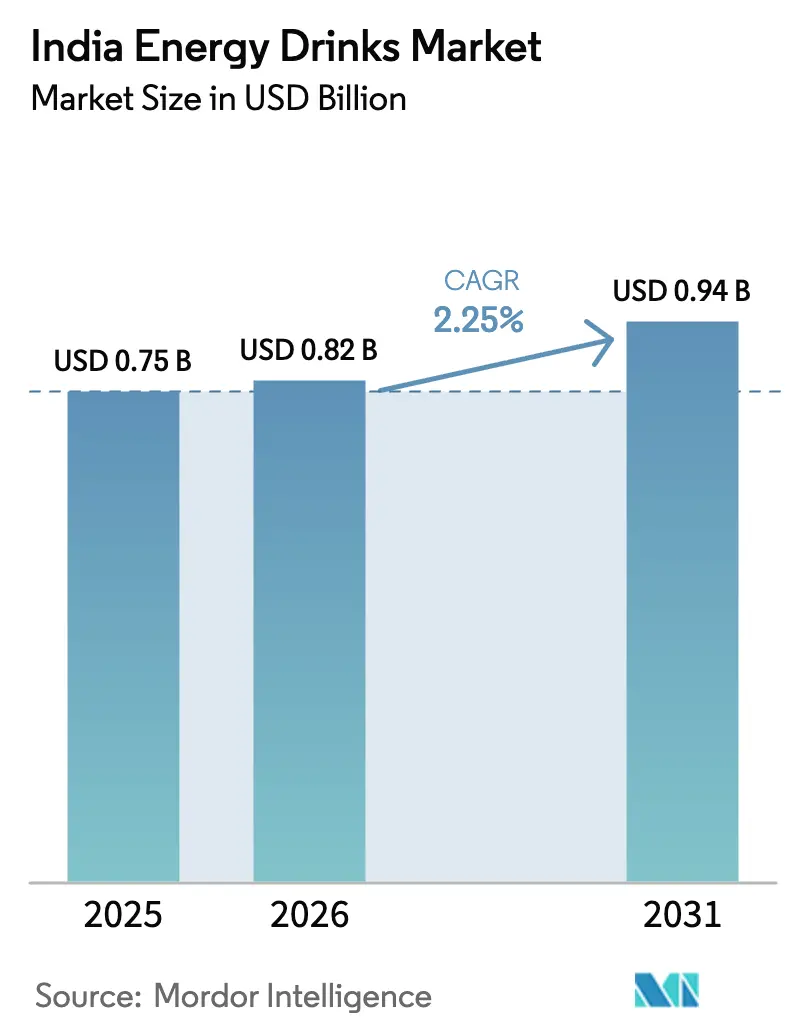
| 基準年の市場規模 (2025) | 0.75 十億米ドル |
| 市場規模 (2026) | 0.82 十億米ドル |
| 市場規模 (2031) | 0.94 十億米ドル |
| 成長率 (2026 - 2031) | 2.25% CAGR |
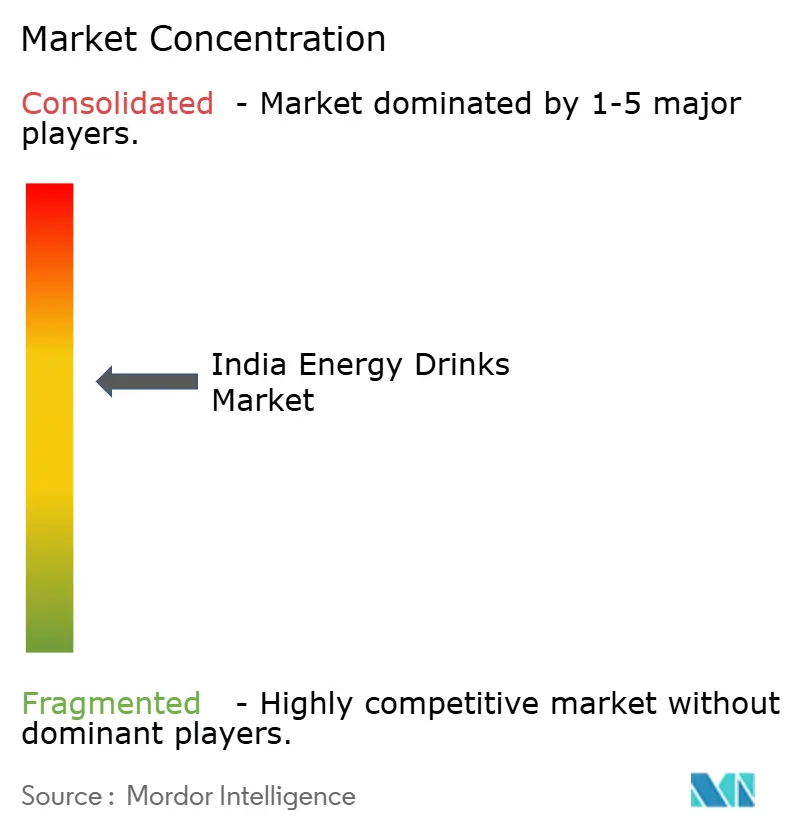
| 市場集中度 | 中 |
主要プレーヤー *免責事項:主要選手の並び順不同 画像 © Mordor Intelligence。再利用にはCC BY 4.0の表示が必要です。 | |
Mordor Intelligenceによるインドエナジードリンク市場分析
インドエナジードリンク市場規模は2026年に8億2,000万米ドルと評価されており、2025年の7億5,000万米ドルから成長し、2031年までに9億4,000万米ドルに達すると予測され、CAGR 2.25%で拡大しています。市場の成長は、外出先での飲料に対する消費者の嗜好の高まり、eスポーツへの参加増加、ゼロシュガーおよびクリーンラベルを訴求した天然成分を含むプレミアム製品への需要拡大によって牽引されています。大衆価格帯のSKUのマージンを圧迫する40%のGST負担にもかかわらず、主要プレイヤーは広範な流通ネットワーク、クイックコマースプラットフォームとのパートナーシップ、戦略的スポーツスポンサーシップを通じて市場シェアを維持しています。各社は第2・第3層都市へのボトリング事業を拡大し、物流コストを削減するとともに、冷蔵製品の入手可能性を確保しています。インドの食品安全基準局(FSSAI)のカフェイン制限やrPET(リサイクルポリエチレンテレフタレート)義務化などの規制要因はコンプライアンスコストを増加させましたが、強固な財務基盤を持つ既存プレイヤーに有利な参入障壁も生み出しています。また、市場では砂糖中心のエナジードリンクから、機能性・シュガーフリー・ナチュラルバリアントの多様なポートフォリオへのシフトも見られます。
主要レポートのポイント
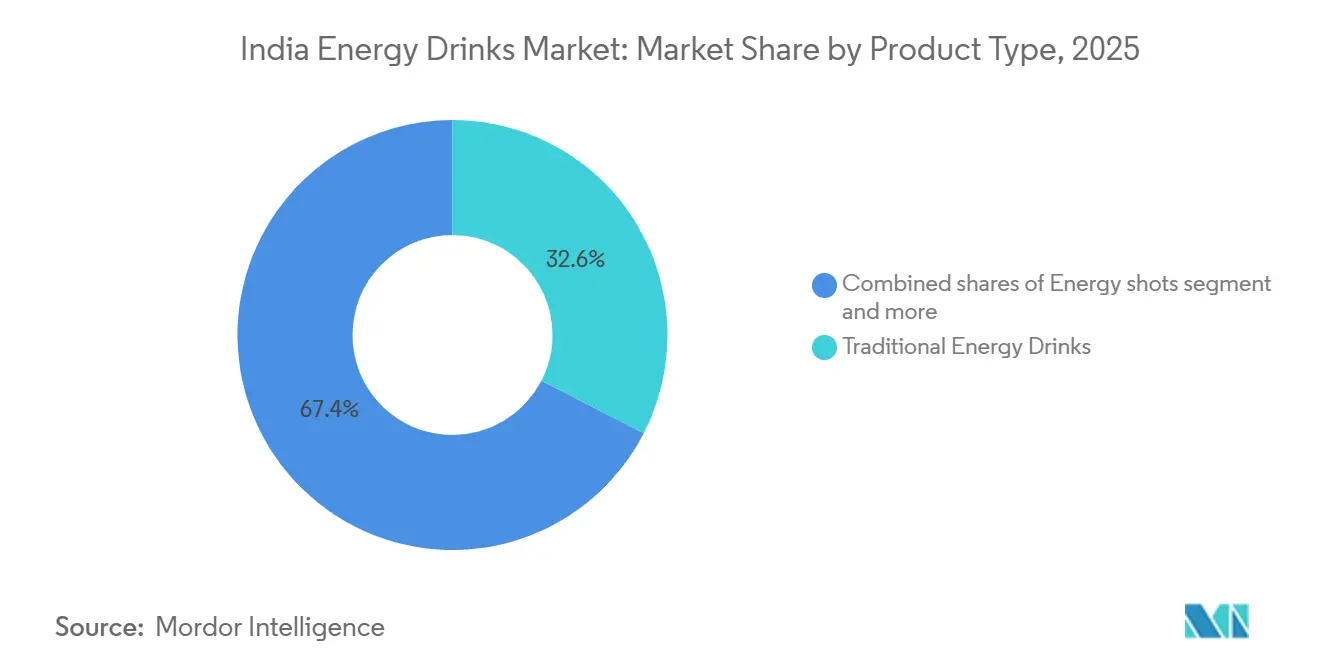
- 製品タイプ別では、トラディショナルエナジードリンクが2025年のインドエナジードリンク市場シェアの32.56%をリードし、ナチュラル・オーガニックエナジードリンクは2031年にかけてCAGR 4.21%で成長する見込みです。
- 包装別では、PETボトルが2025年に市場シェアの51.25%を占め、ガラスボトルはCAGR 3.79%(2031年まで)で最も急速に拡大するフォーマットとなっています。
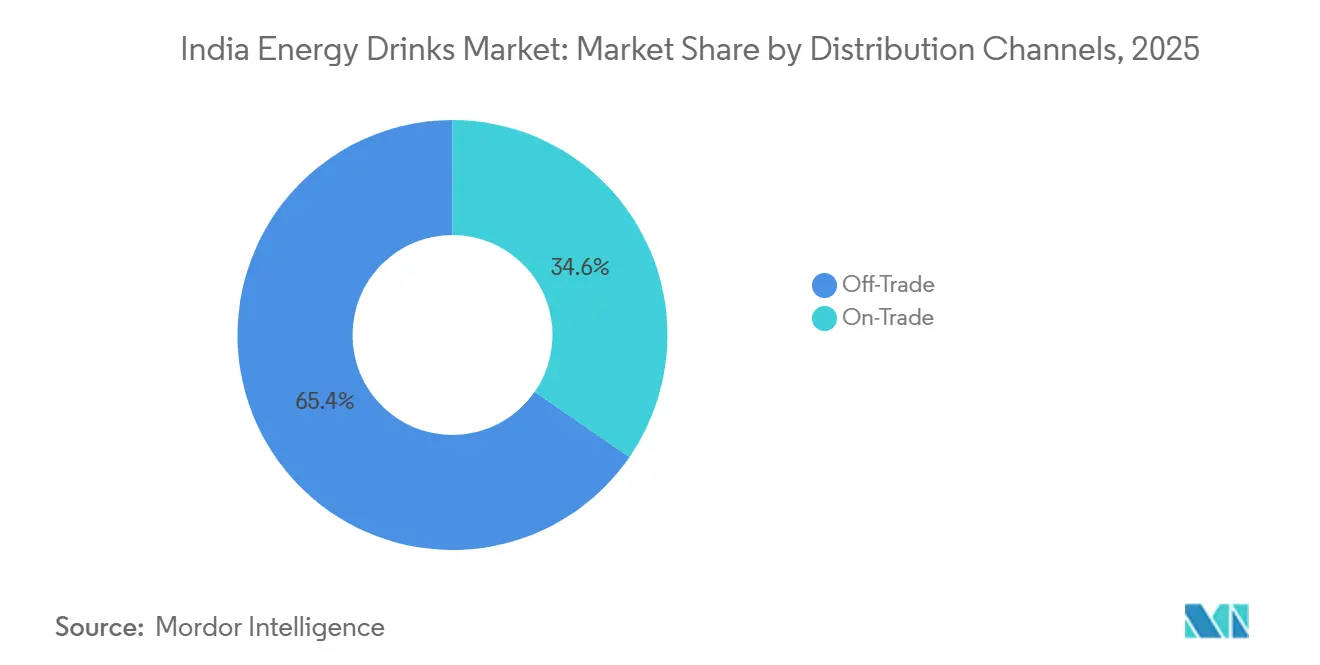
- 流通チャネル別では、オフトレードチャネルが2025年のインドエナジードリンク市場の65.38%を占め、オントレードは2031年にかけてCAGR 4.48%で拡大する見込みです。
注:本レポートの市場規模および予測数値は、Mordor Intelligence 独自の推定フレームワークを使用して作成されており、2026年1月時点の最新の利用可能なデータとインサイトで更新されています。
インドエナジードリンク市場のトレンドとインサイト
ドライバーの影響分析*
| ドライバー | (~)% CAGRへの影響 | 地理的関連性 | 影響の時間軸 |
|---|---|---|---|
| 外出先での労働力の増加と便利なエネルギー補給オプションへの需要 | +0.6% | 都市部の主要都市および第1層都市、第2層ハブへの拡大 | 中期(2〜4年) |
| フィットネスおよびスポーツ参加文化の拡大 | +0.5% | 都市部インド、主要都市および州都に集中 | 中期(2〜4年) |
| eスポーツおよびゲームの急増によるカフェイン飲料の需要拡大 | +0.3% | 都市部の若年層で最も高い強度を持つ全インド | 短期(2年以内) |
| 第2・第3層都市へのコールドチェーン普及による冷蔵RTDフォーマットの実現 | +0.4% | 中部・東部インドの第2・第3層都市、農村周辺部回廊 | 長期(4年以上) |
| ナチュラル・シュガーフリー・機能性バリアントへのシフト | +0.4% | 都市部の主要都市および富裕層の第1層セグメント | 中期(2〜4年) |
| 就労専門家の急速な都市化と可処分所得の増加 | +0.5% | 都市部に集中した全インド | 長期(4年以上) |
| 情報源: Mordor Intelligence | |||


外出先での労働力の増加と便利なエネルギー補給オプションへの需要
インドのギグエコノミーとモバイルワーカーは飲料消費パターンに大きな影響を与えており、エナジードリンクを時折の余暇的リフレッシュメントではなく、生産性向上のための必須ツールとして位置づけています。統計・計画実施省によると、2023〜24年の都市部の月間一人当たり消費支出はINR 6,996に達し、飲料・リフレッシュメント・加工食品が都市部世帯の総支出に占める割合は増加しています[1]出典:統計・計画実施省、「家計消費支出調査:2023〜24年」、pib.gov.in。Zepto、Blinkit、Swiggy Instamartなどのクイックコマースプラットフォームは、勤務時間中の衝動買いをさらに促進し、エナジードリンクを時折の消費に限定するのではなく、日常のルーティンに組み込んでいます。このシフトは、ブランドが外出先での需要のより大きなシェアを獲得するために、シングルサーブの冷蔵フォーマットを最適化し、モダントレードおよびデジタルチャネルでの配置を確保することの重要性を浮き彫りにしています。さらに、INR 20の手頃な価格のシングルサーブ冷蔵ボトルを提供するブランドは、このカテゴリーを日常の消費機会に組み込み、エナジードリンクを都市部消費者の定番品にしています。
フィットネスおよびスポーツ参加文化の拡大
インドは世界最大の若年人口の一つを有しており、消費パターンに大きな変化をもたらしています。このデモグラフィックにおける健康・フィットネスへの意識の高まりが、エナジードリンクを含む機能性飲料への需要を促進しています。インドのフィットネス・スポーツ産業も急速に拡大しています。2025年、青少年スポーツ省は323件の新たなスポーツインフラプロジェクトと、アスリートのトレーニング・育成のための1,041か所のケロ・インディア・センターを承認しました[2]出典:青少年スポーツ省、「インドの青少年とスポーツへの注力の高まり」、pib.gov.in。ジムの会員数は増加しており、ブティックフィットネススタジオは、特殊な処方に対してプレミアム価格を支払う意欲のある富裕層の都市部消費者に対応しています。これには、電解質、アミノ酸、天然カフェイン源を豊富に含む製品が含まれます。エナジードリンクは、ジムの自動販売機、カフェカウンター、スポーツ栄養ストアで入手可能なプレワークアウトまたはリカバリー飲料として位置づけられるようになっています。これにより、炭酸飲料との差別化を図る機能的なユースケースが生まれています。さらに、このフィットネスに関連した消費トレンドは、砂糖を多く含む清涼飲料水に関連する健康上の懸念からエナジードリンクブランドを守るのに役立っています。
就労専門家の急速な都市化と可処分所得の増加
インドの都市・農村間の消費格差は2023〜24年に70%まで縮小しましたが、都市部世帯は依然として月間一人当たり支出においてプレミアムを維持しており、プレミアム飲料の集中した購買基盤を形成しています。一方、農村部世帯の下位5%の月間一人当たり消費支出は2023〜24年に22%上昇しており、これは家計消費支出調査2023〜24年で強調されています。これは、購買力が都市部の拠点を超えて拡大していることを示しています。飲料・リフレッシュメント・加工食品は、農村・都市部の両方で家計の食料支出への最大の貢献者として浮上しており、パッケージ飲料が裁量的購入から日常的購入へと移行したことを示しています。このシフトは、手頃な価格のエナジードリンクのアドレサブル市場が拡大しており、INR 100以上のプレミアムフォーマットよりも低価格で機能的なベネフィットを提供できるブランドに有利であることを示唆しています。このトレンドは、PepsiCoのStingやCoca-ColaのThums Up Chargedなどのブランドがすでに参入している半都市部市場における需要の高まりを示しています。さらに、健康・ウェルネスに対する消費者意識の高まりが、クリーンラベル成分を含むエナジードリンクへの需要を促進しており、ブランドがこの進化する嗜好に対応するためにイノベーションを行う機会を生み出しています。
eスポーツおよびゲームの急増によるカフェイン飲料の需要拡大
インドは2025年6月時点で10億200万人のインターネットユーザーを有し、世界最大のデジタル市場の一つとなっています。同国はまた、400以上のゲーミング組織と4億2,000万人を超えるデジタルゲーマー基盤を誇っています。これは、主に18〜35歳の年齢層をターゲットとするエナジードリンク市場と完全に一致しています。eスポーツトーナメント、ストリーマーとのコラボレーション、ゲーム内広告は、ゲーミング文化内での強固なプレゼンスを確立しようとするエナジードリンクブランドにとって不可欠なマーケティング戦略となっています。深夜のゲームセッションや競争的なオンラインプレイの人気の高まりが、集中力を高め疲労を軽減するカフェイン飲料への安定した需要を生み出しています。このポジショニングは、フィットネス関連チャネルでよく使われる身体的パフォーマンスの物語とは異なります。さらに、ブランドはInstagramなどのプラットフォームでのインフルエンサーパートナーシップとユーザー生成コンテンツを活用して、このテクノロジーに精通した層の間での認知度を高めています。このデモグラフィックはまた、デジタルコマースとクイックデリバリープラットフォームへの強い嗜好を示しており、エナジードリンクの販売成長をさらに促進しています。エナジードリンクのゲーミングおよびデジタルライフスタイルへの統合は、利便性と機能性が主要な購買動機となりつつあるインドにおける消費者行動の進化を浮き彫りにしています。
抑制要因の影響分析*
| 抑制要因 | (~)% CAGRへの影響 | 地理的関連性 | 影響の時間軸 |
|---|---|---|---|
| 高カフェイン・砂糖・人工添加物に関する健康上の懸念 | -0.4% | 全インド、健康意識の高い都市部の教育層で増幅 | 短期(2年以内) |
| ラベリング・カフェイン制限・若者向け広告に関する厳格な規制 | -0.3% | 全国、FSSAIによる施行、州レベルでのコンプライアンス厳格度の差異あり | 中期(2〜4年) |
| 植物性原料およびビタミンの原材料価格の急騰 | -0.2% | 全国 | 短期(2年以内) |
| コンブチャやノートロピクスなどの代替機能性飲料の台頭 | -0.2% | 都市部の主要都市および富裕層の第1層都市 | 長期(4年以上) |
| 情報源: Mordor Intelligence | |||
高カフェイン・砂糖・人工添加物に関する健康上の懸念
インドのエナジードリンク市場は、消費者の嗜好の変化と健康・ウェルネスへの意識の高まりに牽引され、著しい成長を遂げています。FSSAIの栄養補助食品規制は、成人に対してカフェインを1日300mg、1回摂取量200mgに制限し、包装への警告ラベルの義務付けを定めており、ブランドは有効性と規制コンプライアンスのバランスを取ることを余儀なくされています。高カフェイン・砂糖・人工添加物に関する健康上の懸念の高まりが、消費者の嗜好に大きな影響を与えています。このトレンドにより、より健康的な代替品への需要が高まり、ブランドは緑茶エキスやグアラナなどの天然カフェイン源を取り入れることで製品を再処方するよう促されています。さらに、メーカーは砂糖含有量を削減し、人工添加物を排除し、健康意識の高いデモグラフィックに対応するためにクリーンラベルおよびオーガニック認証に注力しています。特に都市部の消費者は、購買決定において透明性とウェルネスを優先することで、このシフトを牽引しています。これらの進化する嗜好に合わせるため、ブランドは「エネルギーブースト」から機能的ウェルネス
へとオファリングを再ポジショニングし、刺激のみに焦点を当てるのではなく、ビタミン・電解質・水分補給・認知サポートなどのベネフィットを強調しています。
ラベリング・カフェイン制限・若者向け広告に関する厳格な規制
インド食品安全基準局(FSSAI)は、エナジードリンクに対してリットルあたり145〜300mgのカフェイン制限を施行し、すべての包装にカフェイン含有量と健康警告の目立つ開示を義務付けています[3]出典:インド食品安全基準局、「第2章 食品製品基準 2.10」、fssai.gov.in。これらの規制は、市場で事業を展開するブランドにコンプライアンスコストをもたらし、処方の柔軟性を制限しています。これらの課題に対処するため、多くの企業はクリーンラベル製品に対する消費者の嗜好に合致する緑茶エキスやグアラナなどの天然カフェイン源を含むよう製品を再処方しています。ただし、ブランドはFSSAIの要件を満たすためにカフェイン含有量を目立つように開示する必要があります。若者をターゲットとした広告規制は規制上のグレーゾーンとして残っており、業界関係者は近い将来、放送およびデジタルキャンペーンに対するより厳格な規制が導入されることを予期しています。例えば、Hector BeveragesのTzingaは、ジンセン含有量に関するFSSAIからの異議申し立てにより、複数回のリコールと再処方を余儀なくされており、インドの進化する規制環境を乗り越える中で小規模ブランドが直面する施行リスクを浮き彫りにしています。
*当社の予測では、推進要因および抑制要因の影響を加算的ではなく方向性のあるものとして扱います。影響予測は、ベースライン成長、構成効果、および変数間の相互作用を反映しています。
セグメント分析
製品タイプ別:手頃な価格がトラディショナルの優位性を支える
トラディショナルエナジードリンクは、強い消費者認知度と競争力のある価格設定に牽引され、2025年に市場シェアの32.56%を占めました。PepsiCoのStingやCoca-ColaのThums Up Chargedなどの製品は、250mlパックでINR 20という価格設定で、Red BullのINR 125の製品と比較して大幅に手頃です。この価格優位性により、これらのブランドは特に伝統的な食料品店や屋台を通じて広範な普及を達成し、より広い消費者基盤にアクセス可能となっています。手頃な価格と確立されたブランド認知度の組み合わせにより、エナジードリンクは都市部・農村部の両市場の消費者に好まれる選択肢であり続けています。
ナチュラル・オーガニックエナジードリンクは2031年にかけてCAGR 4.21%で拡大しており、手頃な価格を維持しながらクリーンラベルの信頼性を効果的に訴求できるブランドにプレミアム化の機会を提供しています。シュガーフリーおよび低カロリーバリアントへの需要の高まりは、耽溢よりも機能的なベネフィットを重視する消費者の嗜好のシフトを反映しています。さらに、エナジーショットはニッチなセグメントではあるものの、コンパクトなフォーマットで濃縮されたカフェインブーストを求める外出先の専門家の間で人気を集めています。コーヒーエナジーブレンドや電解質強化バリアントなどのハイブリッドフォーマットを含むその他のエナジードリンクカテゴリーは、マイクロセグメントとして台頭しています。これらの製品は、プレワークアウトエネルギー、運動後のリカバリー、認知的集中などの特定のユースケースに対応し、市場ランドスケープをさらに多様化しています。


包装タイプ別:サステナビリティ義務が素材選択を再形成
PETボトルは、手頃な価格、携帯性、インドの分散した流通インフラとの適合性に牽引され、2025年に市場シェアの51.25%を占めました。しかし、ガラスボトルはサステナビリティへの懸念とプレミアムポジショニングの重要性が高まる中、2031年にかけてCAGR 3.79%という最も急速な成長が見込まれています。インドの環境省は2025年4月に硬質包装における再生プラスチック含有量30%を義務付け、2028〜29年度までに60%に達するよう年間10%の増加を定めました。これに対応して、Indorama VenturesとVarun Beveragesは、カトゥアとコルダにPETリサイクル施設を建設するために協力しており、全施設で年間10万メトリックトンのリサイクルPET能力の達成を目指しています。
メタル缶は、リサイクル可能性とプレミアムな印象から西洋市場では主流ですが、インドでは単位コストの高さとリサイクルインフラの限界から課題に直面しています。その採用は主に都市部のモダントレードおよびオンプレミスチャネルに集中しており、冷蔵消費とブランド視認性が価格プレミアムを正当化しています。一方、ガラスボトルは、持続可能な包装と棚での訴求力の向上を通じて差別化を図るプレミアムおよびナチュラルエナジードリンクブランドの間で支持を集めています。しかし、重量の重さと破損しやすさにより、流通効率が収益性の鍵となる市場では物流コストが増加します。これらの課題にもかかわらず、環境に優しい包装に対する消費者の嗜好の高まりが、ニッチセグメントにおけるガラスボトルの採用を促進すると予想されています。
流通チャネル別:フィットネスとフードサービスの拡大によるオントレードの成長
オフトレードチャネルは2025年に流通シェアの65.38%を占め、食料品店・コンビニエンスストア・屋台が日用消費財の流通において重要な役割を果たすインドの小売ランドスケープの優位性を反映しています。オフトレードセグメント内では、スーパーマーケットおよびハイパーマーケットがブランド視認性の向上と冷蔵保管オプションを提供していますが、地理的なリーチの限界が全体的な影響を制限しています。一方、コンビニエンスストアと屋台は、人通りの多いエリアでの存在感と衝動買いへの対応能力により、大量販売を牽引しています。しかし、常温保管への依存がプレミアム製品ポジショニングの可能性を制限しています。eコマースおよびクイックコマースプラットフォームを含むオンライン小売は、主要な流通チャネルとして台頭しています。これにより、ブランドは流通上の課題を克服し、当日配送サービスを通じて特に専門家などの都市部消費者を直接ターゲットにすることができます。
カフェ・バー・ジム・レストランなどのオントレード会場は、2031年にかけてCAGR 4.48%という最も急速な成長が見込まれています。この成長は、フードサービスセクターの拡大と、フィットネスおよびソーシャルな機会に適した機能性飲料としてのエナジードリンクの再ポジショニングによって促進されています。オントレードチャネルは、販売量を超えた戦略的なベネフィットを提供します。ジムやフィットネススタジオへの配置は、エナジードリンクを理想的なプレワークアウトまたはリカバリーオプションとして位置づけ、ブランドが潜在的な健康上の懸念を軽減するのに役立ちます。さらに、カフェやバーはミクソロジーとプレミアム価格設定の機会を提供し、エナジードリンクをライフスタイル製品として認識させます。進化する流通ランドスケープは、オフトレードとオントレードの両チャネルを効果的に活用するための戦略を調整することの重要性を浮き彫りにしており、ブランドが多様な消費者ニーズを満たしながら市場浸透を最大化できるようにしています。
地理的分析
インドのエナジードリンク市場は顕著な都市集中を示しており、高い可処分所得、充実した小売インフラ、外出先でのライフスタイルとの強い親和性から、主要都市および第1層都市が消費の大部分を占めています。2023〜24年の都市部の月間一人当たり消費支出はINR 6,996に達し、農村部の月間一人当たり消費支出INR 4,122を70%上回っています。飲料・リフレッシュメント・加工食品は都市部世帯支出の11.09%を占め、農村部の9.84%を上回っており、都市部における世帯当たりの支出ポテンシャルが高いことを示しています。例えば、Hell Energy Drinkのブラックチェリーはムンバイやプネー、デリーNCR、ベンガルール、ハイデラバード、チャンディーガルなど、確立されたモダン小売とクイックコマースインフラを持つ主要都市および第1層都市をターゲットとして発売されており、新製品導入における都市部拠点の戦略的優先度を反映しています。
第2・第3層都市は次の成長フロンティアを代表していますが、コールドチェーンの限界と分散した小売ネットワークが市場浸透を制約しています。インドの冷蔵保管能力は2025年に3,850万トンに達しましたが、中部・東部インドは依然として供給不足です。Varun Beveragesが2024年にスパ、ゴーラクプル、コルダにグリーンフィールド施設を稼働させたことで、以前は十分にサービスが行き届いていなかった地域へのコールドチェーンリーチが拡大し、地域市場でのStingおよびその他のPepsiCoブランドの冷蔵流通が可能になりました。さらに、第2層都市でのクイックコマースプラットフォームの台頭がアクセシビリティのギャップを徐々に埋めており、ブランドが半都市部の需要を取り込めるようになっています。INR 20〜30の価格帯で機能的なベネフィットを提供し、伝統的な食料品店や屋台を通じた流通を確保できるブランドが、この新興の農村・半都市部需要を獲得するでしょう。
地域別の消費パターンも文化的・気候的な違いを反映しており、南部・西部の州は温暖な気候と高い都市化率から一人当たりの飲料消費量が多い傾向があります。一方、北部・東部の州はインフラ整備が進むにつれて浸透率は低いものの成長率は高くなっています。手頃な価格のエナジードリンクのアドレサブル市場は拡大しており、主要都市を超えた流通を拡大できるブランドに有利です。戦略的な命題は、モダントレード・オンプレミス・eコマースを活用した都市部のプレミアム化(高マージン)と、手頃な価格フォーマットと流通チャネルを通じた第2・第3層都市および農村周辺部回廊でのマスマーケット浸透のバランスを取ることです。さらに、全地域にわたる健康・ウェルネストレンドへの意識の高まりが、低カロリーおよびシュガーフリーエナジードリンクバリアントへの需要を促進し、製品多様化の機会を生み出すと予想されています。
競合ランドスケープ
インドエナジードリンク市場は中程度に集約されており、PepsiCoのStingが以前の年に価格ベンチマークを破壊し、市場の主要シェアを獲得したランドスケープを反映しています。しかし、Tata ConsumerのSay Never!、BisleriのUrzza、Hector BeveragesのTzingaなどのローカルチャレンジャーは、地域の風味、手頃な価格設定、機能的なポジショニングを活用して主要プレイヤーと競争しています。PepsiCo最大のフランチャイジーであるVarun Beveragesは、2018〜2023年の間に売上をINR 16,042.6クローレへと3倍に増加させました。これは、ボトラー主導の流通インフラが市場アクセスの決定において重要な役割を果たすことを浮き彫りにしています。
多国籍プレイヤーは現在、フレーバーイノベーション、ローカライズされたエンドースメント、地理的拡大を通じて市場シェアを守っています。例えば、Red Bullは価格に敏感な消費者に対応するために小型パックサイズを導入し、Coca-ColaのThums Up Chargedはインドでの強いブランドエクイティの活用に注力しています。インドの18社の食品グレードリサイクルPETメーカーのうちFSSAI認証を取得しているのは5社のみであり、垂直統合されたボトラーに有利なサプライボトルネックを生み出し、規模の経済を持たない小規模ブランドへの参入障壁となっています。新興ブランドはデジタルファーストの市場参入戦略を採用し、クイックコマースプラットフォームとインフルエンサーマーケティングを活用して流通のボトルネックを回避し、都市部のミレニアル世代とZ世代の消費者をターゲットにしています。
エナジードリンクへのGSTはマージンを圧迫し、イノベーションへの投資を抑制しています。しかし、税負担を吸収するスケールを持たない新規参入者への参入障壁を高めることで、既存プレイヤーを保護する効果もあります。これらの課題にもかかわらず、機能性飲料への消費者意識の高まりとより健康的なライフスタイルへのシフトに牽引され、市場は成長を続けています。テクノロジーの採用はまだ初期段階にあり、ほとんどのブランドは高度な分析や直接消費者向けデジタルプラットフォームではなく、営業部隊の自動化と販売店管理システムに依存しています。これは、優れた需要予測、ターゲットを絞ったプロモーション、強化された消費者エンゲージメント戦略を通じて市場シェアを獲得するテクノロジー活用型チャレンジャーに機会をもたらしています。
インドエナジードリンク産業リーダー
Anheuser-Busch InBev SA/NV
Monster Beverage Corporation
PepsiCo, Inc.
Red Bull GmbH
The Coca-Cola Company
- *免責事項:主要選手の並び順不同

最近の業界動向
- 2025年9月:プレミアムエナジードリンクブランドの28 BLACKがインドでエナジードリンクを発売。インド向けの初期フレーバーには、ベストセラーのアサイー(フルーティーなベリーテイスト)と、地域の嗜好に合わせたグミベアが含まれます。
- 2025年9月:ハンガリー発の急速に拡大するグローバルブランドHell Energy Drinkが、インドにプレミアムブラックチェリーフレーバーを導入。複数のビタミンB群を配合し、保存料不使用のオリジナルエナジーフォーミュラによる濃厚なブラックチェリーテイストが特徴です。
- 2025年2月:Reliance Consumer Products Limitedが、クリケット選手ムッティア・ムラリタランとの共同開発による低価格スポーツドリンク「Spinner」をボトル1本INR 10で発売。レモン、オレンジ、ニトロブルーのフレーバーで展開し、複数のIPLチームとのパートナーシップを通じて認知度を確保しました。
- 2024年9月:Indorama VenturesとVarun Beveragesがインドに複数のPETリサイクル施設を建設すると発表。カトゥア(ジャンムー・カシミール)とコルダ(オディシャ)に2工場を設置。合弁事業は、増大する需要に対応するため、全施設で年間10万メトリックトンのリサイクルPET能力を目標としています。


インドエナジードリンク市場レポートの範囲
エナジードリンクは、主にカフェインなどの刺激物質を高濃度に配合し、タウリン、ビタミンB群、グアラナなどの成分を含む非アルコール性機能性飲料です。即時の精神的覚醒と身体的エネルギーを提供し、炭酸または非炭酸のレディ・トゥ・ドリンク(RTD)缶、ボトル、ショットとして販売されています。インドエナジードリンク市場は、製品タイプ、包装、流通チャネルによってセグメント化されています。製品タイプに基づき、市場はエナジーショット、ナチュラル・オーガニックエナジードリンク、シュガーフリー・低カロリーエナジードリンク、トラディショナルエナジードリンク、その他のエナジードリンクにセグメント化されています。包装別では、市場はPETボトル、ガラスボトル、メタル缶、その他にセグメント化されています。流通チャネル別では、市場はオントレードとオフトレードチャネルにセグメント化されています。各セグメントについて、市場規模と予測は金額(米ドル)ベースで行われています。
| エナジーショット |
| ナチュラル・オーガニックエナジードリンク |
| シュガーフリー・低カロリーエナジードリンク |
| トラディショナルエナジードリンク |
| その他のエナジードリンク |
| PETボトル |
| ガラスボトル |
| メタル缶 |
| その他 |
| オントレード | |
| オフトレード | スーパーマーケット・ハイパーマーケット |
| コンビニエンスストア | |
| 専門店 | |
| オンライン小売 | |
| その他の流通チャネル |
| 製品タイプ別 | エナジーショット | |
| ナチュラル・オーガニックエナジードリンク | ||
| シュガーフリー・低カロリーエナジードリンク | ||
| トラディショナルエナジードリンク | ||
| その他のエナジードリンク | ||
| 包装タイプ別 | PETボトル | |
| ガラスボトル | ||
| メタル缶 | ||
| その他 | ||
| 流通チャネル別 | オントレード | |
| オフトレード | スーパーマーケット・ハイパーマーケット | |
| コンビニエンスストア | ||
| 専門店 | ||
| オンライン小売 | ||
| その他の流通チャネル | ||


市場の定義
- 炭酸清涼飲料(CSD) - 炭酸清涼飲料(CSD)とは、炭酸化され、通常フレーバーが付けられた非アルコール飲料で、二酸化炭素を溶解させて発泡性を生み出したものを指します。これらの飲料には一般的にコーラ、レモンライム、オレンジ、各種フルーツフレーバーのソーダが含まれます。缶、ボトル、またはファウンテンディスペンスで販売されます。
- ジュース類 - 当社は、果物、野菜、またはその組み合わせから得られ、ボトル、カートン、パウチなどの様々な包装形態で加工・密封されたパッケージジュースを対象としています。生ジュースを除き、この市場セグメントには商業的に調製・保存されたジュースが含まれ、多くの場合保存料やフレーバーが添加されています。
- レディ・トゥ・ドリンク(RTD)ティーおよびRTDコーヒー - レディ・トゥ・ドリンク(RTD)ティーおよびRTDコーヒーは、さらに希釈することなく消費できるように醸造・調製された、事前にパッケージされた非アルコール飲料です。RTDティーには通常、フレーバーや甘味料を加えた様々な茶の種類が含まれ、ボトル、缶、またはカートンで提供されます。同様に、RTDコーヒーは事前に醸造されたコーヒー処方を含み、多くの場合ミルク、砂糖、またはフレーバーと混合され、外出先での消費に便利にパッケージされています。
- エナジードリンク - エナジードリンクは、エネルギーと覚醒の素早いブーストを提供するために処方された非アルコール飲料です。一方、スポーツドリンクは、特に身体的な運動、エクササイズ、または激しい活動の後に水分補給と電解質の補充を目的として設計された飲料です。
| キーワード | 定義#テイギ# |
|---|---|
| 炭酸清涼飲料 | 炭酸清涼飲料(CSD)は、炭酸水とフレーバーを組み合わせ、砂糖または非砂糖甘味料で甘みをつけたものです。 |
| スタンダードコーラ | スタンダードコーラとは、コーラソーダのオリジナルフレーバーと定義されます。 |
| ダイエットコーラ | 砂糖を含まないまたは少量しか含まないコーラベースの清涼飲料 |
| フルーツフレーバー炭酸飲料 | 果汁・果実フレーバーと炭酸水から調製され、砂糖、ブドウ糖、転化糖または液糖を単独または組み合わせて含む炭酸飲料。果皮油と果実エッセンスを含む場合があります。 |
| ジュース | ジュースとは、果物や野菜に含まれる天然液体を抽出またはプレスして作られた飲み物です。 |
| 100%ジュース | 果物をそのジュースの形で使用し、量を補うための水を加えない果物・野菜ジュース。果汁に砂糖、甘味料、保存料、香料、着色料を添加することは認められていません。 |
| ジュースドリンク(ジュース含有量24%以下) | 果物・野菜エキスを24%以下含む果物・野菜ジュースドリンク。 |
| ネクター(ジュース含有量25〜99%) | 果物を25〜99%含むことができるジュースで、最低法定限度は果物の種類によって定義されます。 |
| ジュース濃縮物 | ジュース濃縮物とは、液体の大部分を除去することで、ジュース濃縮物として知られる濃厚でシロップ状の製品となったジュースの形態です。 |
| RTDコーヒー | 購入時点で消費可能な状態で販売される、調製済みのパッケージコーヒー飲料。 |
| アイスコーヒー | アイスコーヒーとは、通常ホットエスプレッソとミルクを組み合わせ、氷を加えたコーヒーの冷たいバージョンです。 |
| コールドブリューコーヒー | コールドブリューは、コールドウォーター抽出またはコールドプレスとも呼ばれ、挽いたコーヒーを室温の水に数時間浸漬して作られます。 |
| RTDティー | レディ・トゥ・ドリンク(RTD)ティーは、醸造や調製なしに即時消費できる状態のパッケージ茶製品です。 |
| アイスティー | アイスティーとは、ミルクなしで砂糖と時にはフルーツフレーバーを加えた冷たい状態で飲む茶から作られた飲み物です。 |
| 緑茶 | 緑茶は、精神的な覚醒を促進し、消化器症状を緩和し、体重減少を促進する茶飲料です。 |
| ハーブティー | ハーブティー飲料は、ハーブ、スパイス、またはその他の植物素材を熱湯に浸出または煎じて作られます。 |
| エナジードリンク | 精神的・身体的刺激を提供するとして販売される、通常カフェインなどの刺激物質を含む飲料の一種。炭酸入りまたは非炭酸の場合があり、砂糖、その他の甘味料、またはハーブエキスなど多数の可能な成分を含む場合もあります。 |
| シュガーフリーまたは低カロリーエナジードリンク | シュガーフリーまたは低カロリーエナジードリンクは、砂糖不使用で人工甘味料を使用したカロリーがほとんどないまたは全くないエナジードリンクです。 |
| トラディショナルエナジードリンク | トラディショナルエナジードリンクは、消費者のエネルギーを高めるために設計された成分を含む機能性清涼飲料です。 |
| ナチュラル・オーガニックエナジードリンク | ナチュラル・オーガニックエナジードリンクは、人工甘味料や合成着色料を使用しないエナジードリンクです。代わりに、緑茶、イェルバマテ、植物エキスなどの天然由来成分を含んでいます。 |
| エナジーショット | 大量のカフェインおよび・またはその他の刺激物質を含む、小型で高濃度のエナジードリンク。量はエナジードリンクと比較して相対的に少量です。 |
| スポーツドリンク | スポーツドリンクは、運動前・中・後の水分、炭水化物、電解質の迅速な補給のために特別に設計された飲料です。 |
| アイソトニック | アイソトニックドリンクは、人体と同様の塩分と糖分の濃度を含み、運動中に失われた水分を素早く補給するとともに炭水化物を増加させるために設計されています。 |
| ハイパートニック | ハイパートニックドリンクは、人体よりも高い塩分と糖分の濃度を持っています。運動後にグリコーゲンレベルを素早く補充することが重要なため、運動後に飲むのが最適です。 |
| ハイポトニック | ハイポトニックドリンクは、運動中に失われた水分を素早く補給するために設計されています。炭水化物含有量が非常に低く、人体よりも低い塩分と糖分の濃度を持っています。 |
| 電解質強化水 | 電解質水とは、ナトリウム、カリウム、カルシウム、マグネシウムなどの電気的に帯電したミネラルを注入した水です。 |
| プロテインベーススポーツドリンク | プロテインベーススポーツドリンクとは、パフォーマンスを向上させ筋タンパク質の分解を軽減するためにプロテインを添加したスポーツドリンクです。 |
| オントレード | オントレードとは、バー、レストラン、パブなど、施設内での即時消費のために飲料を販売する場所を指します。 |
| オフトレード | オフトレードとは通常、酒類販売店、スーパーマーケット、その他の飲料をその場で消費しない場所を意味します。 |
| コンビニエンスストア | 消費者が様々な消費財やサービス(一般的に食品やガソリン)を素早く購入できる便利な場所を提供する小売業。 |
| 専門店 | 専門店とは、比較的狭いカテゴリーの商品の中でブランド、スタイル、またはモデルの深いアソートメントを取り扱う店舗です。 |
| オンライン小売 | オンライン小売とは、企業がウェブサイトから消費者に直接商品やサービスを販売するeコマースの一形態です。 |
| 無菌包装 | 無菌包装とは、冷たく商業的に無菌の製品を、微生物を効果的に排除するシールを形成するために、無菌条件下で事前に滅菌されたコンテナとクロージャーに充填することを指します。テトラパック、カートン、パウチなどが含まれます。 |
| PETボトル | PETボトルとは、ポリエチレンテレフタレートで作られたボトルを意味します。 |
| メタル缶 | アルミニウムまたはスズメッキもしくは亜鉛メッキ鋼で作られた金属容器で、食品、飲料、その他の製品の包装に一般的に使用されます。 |
| 使い捨てカップ | 使い捨てカップとは、水、冷たい飲み物、温かい飲み物、アルコール飲料などの飲料を提供するために一回使用するために設計されたカップまたはその他の容器を意味します。 |
| Z世代 | 1990年代後半から2000年代初頭に生まれた人々のグループを指す呼び方。 |
| ミレニアル世代 | 1981年から1996年の間に生まれた人(2019年時点で23〜38歳)はミレニアル世代と見なされます。 |
| タウリン | タウリンは、免疫の健康と神経系機能をサポートするアミノ酸です。 |
| バー・パブ | 施設内でのアルコール飲料の消費を提供するライセンスを持つ飲酒施設。 |
| カフェ | リフレッシュメント(主にコーヒー)と軽食を提供するフードサービス施設。 |
| 外出先で | 何かに忙しく従事しながら行動・対処することを意味します。 |
| インターネット普及率 | インターネット普及率とは、特定の国または地域の総人口のうちインターネットを使用する割合に対応します。 |
| 自動販売機 | コインまたはトークンを投入すると食品、飲料、タバコなどの小物を販売する機械。 |
| ディスカウントストア | ディスカウントストアまたはディスカウンターは、原則として実際のまたは想定される「通常小売価格」よりも低い価格で製品を販売する小売フォーマットを提供します。ディスカウンターはコストを抑えるために大量購入と効率的な流通に依存しています。 |
| クリーンラベル | 飲料市場におけるクリーンラベルとは、天然由来の少ない成分で作られ、加工されていないまたはわずかにしか加工されていない飲み物です。 |
| カフェイン | 中枢神経系の刺激物質であるアルカロイド化合物。主に覚醒度と注意力パフォーマンスを高める軽度の認知機能向上剤として娯楽目的で使用されます。 |
| エクストリームスポーツ | アクションスポーツ、アドベンチャースポーツ、またはエクストリームスポーツは、高度なリスクを伴うと認識される活動です。 |
| 高強度インターバルトレーニング | 最大心拍数の少なくとも80%まで心拍数を大幅に上昇させる数分間の高強度動作と、短時間の低強度動作を交互に繰り返す複数のラウンドを組み込んでいます。 |
| 賞味期限 | アイテムが使用可能、消費に適した、または販売可能な状態を維持する期間。 |
| クリームソーダ | クリームソーダは甘い清涼飲料です。一般的にバニラフレーバーで、アイスクリームフロートの味をベースにしています。 |
| ルートビア | ルートビアは甘い北米の清涼飲料で、伝統的にサッサフラスの木Sassafras albidumの根皮またはSmilax ornataのつるを主要フレーバーとして使用して作られます。ルートビアは通常、ただし必ずしもそうではなく、ノンアルコール、カフェインフリー、甘く、炭酸入りです。 |
| バニラソーダ | バニラフレーバーの炭酸清涼飲料。 |
| 乳製品フリー | 牛、羊、ヤギのミルクまたは乳製品を一切含まない製品。 |
| カフェインフリーエナジードリンク | カフェインフリーエナジードリンクは、エネルギーを高めるために他の成分に依存しています。人気の選択肢にはアミノ酸、ビタミンB群、電解質が含まれます。 |


研究方法論
Mordor Intelligenceは、すべてのレポートで4段階の方法論に従います。
- ステップ1:主要変数の特定: 堅牢な予測方法論を構築するために、ステップ1で特定された変数と要因を利用可能な過去の市場数値に対してテストします。反復プロセスを通じて、市場予測に必要な変数を設定し、これらの変数に基づいてモデルを構築します。
- ステップ2:市場モデルの構築: 予測年の市場規模推定は名目値で行います。インフレは価格設定に含まれず、平均販売価格(ASP)は各国の予測期間を通じて一定に保たれます。
- ステップ3:検証と確定: この重要なステップでは、すべての市場数値、変数、アナリストの判断が、調査対象市場の一次調査専門家の広範なネットワークを通じて検証されます。回答者は、調査対象市場の全体像を生成するために、レベルと機能を横断して選定されます。
- ステップ4:調査アウトプット: シンジケートレポート、カスタムコンサルティング業務、データベース・サブスクリプションプラットフォーム


