Xylene Market Size and Share
Market Overview
| Study Period | 2021 - 2031 |
|---|---|
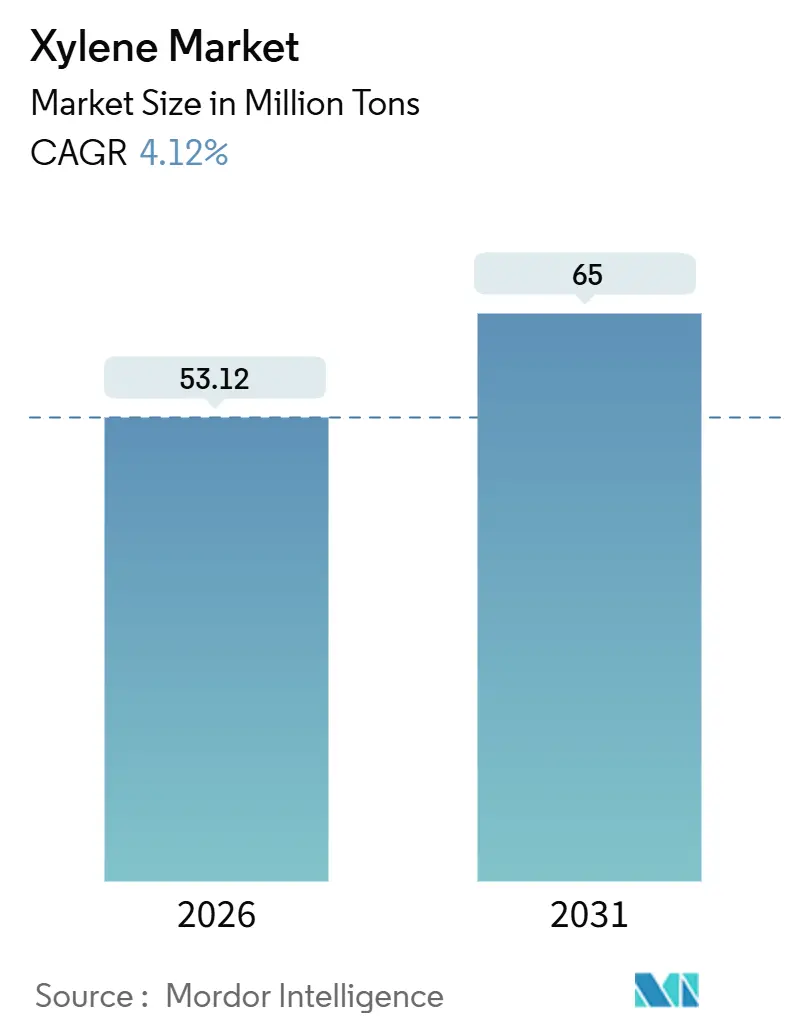
| Market Volume (2026) | 53.12 Million tons |
| Market Volume (2031) | 65 Million tons |
| Growth Rate (2026 - 2031) | 4.12% CAGR |
| Fastest Growing Market | Asia Pacific |
| Largest Market | Asia Pacific |
| Market Concentration | Medium |
Major Players *Disclaimer: Major Players sorted in no particular order Image © Mordor Intelligence. Reuse requires attribution under CC BY 4.0. | |
Xylene Market Analysis by Mordor Intelligence
The Xylene Market size is estimated at 53.12 Million tons in 2026, and is expected to reach 65 Million tons by 2031, at a CAGR of 4.12% during the forecast period (2026-2031). Strong pull-through from polyethylene terephthalate (PET) and polyester fiber production, rising integration of crude-to-chemicals complexes that achieve aromatics yields near 40%, and brand-owner mandates for lower-carbon packaging underpin this growth trajectory. Asia-Pacific dominates current demand and new capacity, while North American and European producers rationalize assets in response to margin pressure. Bio-based routes are scaling, aided by long-term offtake agreements from beverage and apparel brands, yet petroleum feedstocks still command 97.22% share in 2025. Integrated refiners in Saudi Arabia, China, and India continue to widen their cost advantage as standalone naphtha crackers in Japan and South Korea run below 60% utilization. Volatile naphtha prices and tightening volatile-organic-compound (VOC) regulations in Europe and North America temper solvent-grade growth but do not derail the upward slope of global demand.
Key Report Takeaways
- By type, para-xylene captured 90.12% of the xylene market share in 2025; ortho-xylene is forecast to expand at a 4.11% CAGR through 2031.
- By grade, technical-grade held 85.33% volume share in 2025, while high-purity grade is set to grow at a 4.78% CAGR to 2031.
- By source, petroleum-based streams accounted for 97.22% of the xylene market size in 2025; bio-based alternatives are projected to climb 5.78% annually to 2031.
- By application, solvent use represented 66.78% of the xylene market size in 2025 and is advancing at a 4.31% CAGR through 2031.
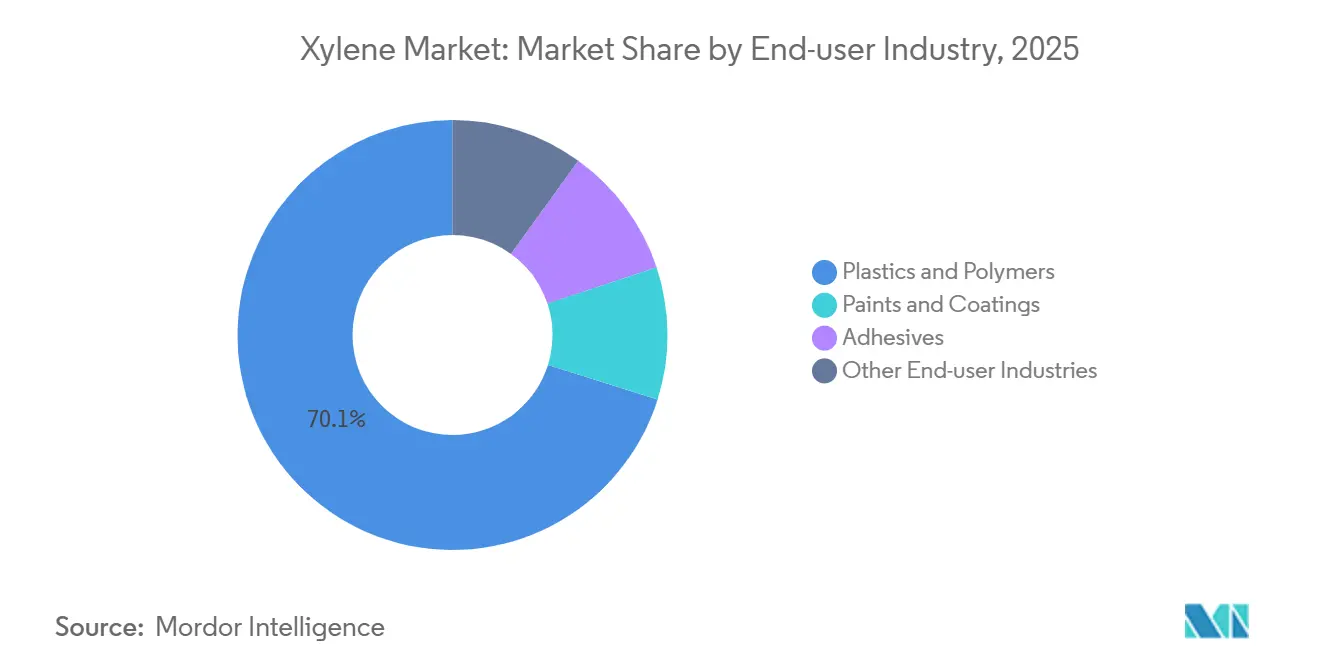
- By end-user industry, plastics and polymers commanded 70.14% share of the xylene market size in 2025 and are rising at a 4.66% CAGR to 2031.
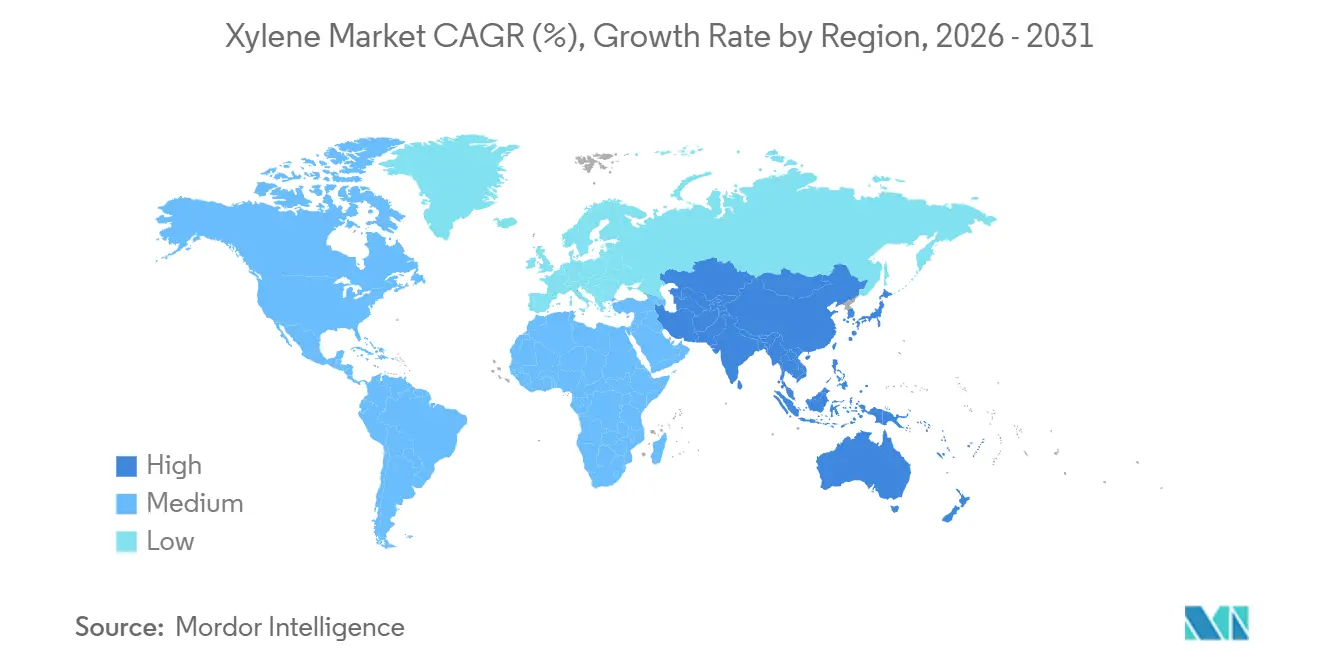
- Asia-Pacific led with 55.22% xylene market share in 2025 and is expected to post the fastest regional CAGR at 4.55% to 2031.
Note: Market size and forecast figures in this report are generated using Mordor Intelligence’s proprietary estimation framework, updated with the latest available data and insights as of January 2026.
Global Xylene Market Trends and Insights
Driver Impact Analysis*
| Drivers | (~) % Impact on CAGR Forecast | Geographic Relevance | Impact Timeline |
|---|---|---|---|
| Surging PET and Polyester Fiber Demand (PX-PTA Value Chain) | +1.8% | Asia-Pacific core, spill-over to Middle East and South America | Long term (≥ 4 years) |
| Capacity Expansions in Integrated Aromatics Complexes (Middle East and Asia) | +1.2% | Middle East (Saudi Arabia, Qatar), China, India, Malaysia | Medium term (2-4 years) |
| Automotive Lightweighting Boosting Engineering Plastics (North America) | +0.5% | North America, Europe | Medium term (2-4 years) |
| Strategic Stockpiling of Solvents by Pharma Amid supply-chain Shocks | +0.3% | Global, with concentration in North America and Europe | Short term (≤ 2 years) |
| Carbon-Aware Procurement by Brand-Owners Favoring Bio-Xylene Blends | +0.4% | Europe, North America, early adoption in Asia-Pacific | Long term (≥ 4 years) |
| Source: Mordor Intelligence | |||
Surging PET and Polyester Fiber Demand (PX-PTA Value Chain)
Sustained growth in PET packaging and polyester textiles continues to amplify upstream para-xylene requirements. Sinopec Yizheng’s 3.0 million-ton per annum PTA unit and SASA Polyester’s 1.75 million-ton facility in Turkey, both started in 2024, anchor this linkage. Asia’s PET consumption climbed 4% to 88 million tons in 2023 as Indonesia, Vietnam, and Thailand posted double-digit gains, while India’s PET demand surged 13% in the same year[1]Company Release, “Reliance FY 2025 PET Highlights,” Reliance Industries, ril.com. Yet China’s vast slate of PTA and PET capacity - roughly 71 million tons by 2022 - has created local overcapacity, compressing PX margins and prompting plant closures in Japan and Europe.
Capacity Expansions in Integrated Aromatics Complexes (Middle East and Asia)
Crude-to-chemicals configurations bypass traditional refinery bottlenecks and yield up to 40% aromatics. Saudi Aramco and Sinopec’s planned Yanbu complex will add 1.5 million tons per annum of aromatics by 2030. ChemOne Malaysia’s USD 3.5 billion Pengerang project, scheduled for 2028 completion, exemplifies this greenfield wave. Hengli Petrochemical and Zhejiang Petroleum & Chemical already operate mega-sites that are redrawing global trade flows and pushing Chinese ortho-xylene into export markets.
Automotive Lightweighting Boosting Engineering Plastics (North America)
Automakers are replacing metal with PBT and allied resins derived from PTA to offset battery weight in electric vehicles. Gulf Coast aromatics producers supply para-xylene that meets polymer-grade purity, supporting demand growth in the United States, Canada, and Mexico. European uptake is slower due to higher energy costs and stricter VOC norms.
Strategic Stockpiling of Solvents by Pharma Amid Supply-Chain Shocks
Red Sea shipping disruptions and typhoon damage to Asian solvent plants in 2024 led North American and European drug manufacturers to build multi-month xylene inventories, lifting spot demand into 2025. Regulatory requirements under FDA and EMA guidelines make substitution costly, reinforcing precautionary buying through 2026.
Restraint Impact Analysis*
| Restraints | (~) % Impact on CAGR Forecast | Geographic Relevance | Impact Timeline |
|---|---|---|---|
| Stringent VOC Norms Limiting Aromatic Solvent Use in Europe and North America | -0.9% | Europe, North America | Medium term (2-4 years) |
| Health-Toxicity Concerns Prompting Shift to Oxygenated Solvents | -0.6% | Global, with early impact in Europe and North America | Long term (≥ 4 years) |
| Volatile Naphtha Prices Compressing Producer Margins | -0.7% | Global | Short term (≤ 2 years) |
| Source: Mordor Intelligence | |||
Stringent VOC Norms Limiting Aromatic Solvent Use in Europe and North America
The EU’s CLP Regulation 2024/2865 and the UK’s Environmental Permitting framework impose tighter exposure limits and digital labeling for xylene-containing formulations[2]Official Journal, “Regulation 2024/2865 on CLP,” European Union, eur-lex.europa.eu. Small formulators face higher compliance costs, accelerating reformulation toward water-borne coatings and exempt solvents, while U.S. NESHAP rules add permitting burdens.
Health-Toxicity Concerns Prompting Shift to Oxygenated Solvents
Lower occupational exposure limits and REACH obligations encourage the use of ethyl acetate and glycol ethers. The EU REACH and CLP amendments, effective 2027, require stricter hazard communication, nudging paint and adhesive makers away from xylene streams.
*Our forecasts treat driver/restraint impacts as directional, not additive. The impact forecasts reflect baseline growth, mix effects, and variable interactions.
Segment Analysis
By Type: PX Dominance Masks OX Overcapacity
Para-xylene retained a commanding 90.12% xylene market share in 2025 owing to its direct conversion into PTA and the downstream polyester chain. Mixed additions in China and the Middle East keep para-xylene margins volatile, yet absolute volumes grow in tandem with PET. Ortho-xylene, despite a 4.11% forecast CAGR, grapples with phthalic anhydride utilization near 57% and plant closures such as Koppers’ Stickney site. Meta-xylene demand remains niche, focused on isophthalic acid and high-performance fibers, and suffered from Mitsubishi Gas Chemical’s Rotterdam shutdown in 2025.
Overcapacity in ortho-xylene is most acute in China, where domestic supply displaced imports, sending exports up 29.4% year-on-year in 2024. Meta-xylene prices followed mixed-xylene declines, pushing producers out of the value chain. Para-xylene, by contrast, benefits from new PTA plants across Asia and Turkey, maintaining the growth engine for the xylene market.


By Grade: High-Purity Gains Track Semiconductor Migration
Technical grade held 85.33% share in 2025, addressing bulk solvents, coatings, and agrochemicals. High-purity grade expands at 4.78% through 2031 as chip fabrication shifts to India and Southeast Asia, requiring sub-ppm impurity specifications. India’s USD 10 billion semiconductor incentive drives local high-purity solvent demand.
Regulatory constraints in Europe and North America weigh on technical-grade growth, steering formulators toward water-borne systems. Pharmaceutical synthesis also favors reagent-grade material to satisfy FDA and EMA solvent limits, locking in premiums of 15-25% over industrial grades.
By Source: Bio-Xylene Economics Narrow as Scale Arrives
Petroleum-based streams captured a 97.22% share in 2025, aided by integrated facilities such as Saudi Aramco and Sinopec’s planned Yanbu expansion. Bio-based xylene volumes grow at 5.78% annually as projects from BioBTX, Anellotech, and Origin Materials progress to commercialization. Production costs below USD 2,500 per ton are within reach once 20,000+ ton assets achieve full utilization, narrowing the cost gap to petroleum products.
Brand-owner procurement targets - 25-30% bio-content in PET packaging by 2030 - underpin long-term offtake contracts, improving bankability for bio-aromatics ventures. Nonetheless, feedstock flexibility and scale advantages continue to cement petroleum’s dominance in the xylene market.
By Application: Solvent Demand Bifurcates on Regulation
Solvent use accounted for 66.78% of 2025 volumes and will rise 4.31% a year, split between regions tightening VOC rules and those still favoring solvent-borne coatings. Europe and North America accelerate shifts to water-based and high-solids systems, while Asia-Pacific and the Middle East sustain traditional formulations in industrial maintenance and automotive refinishing.
Pharmaceutical stockpiling after 2024 supply disruptions compressed regional balances, highlighting xylene’s irreplaceability in certain chemistries. Adhesives and specialty chemicals preserve demand where performance outweighs emissions constraints.
By End-User Industry: Plastics Anchor Growth, Coatings Retreat
The plastics and polymers segment dominated 70.14% of 2025 consumption and is projected to grow with a CAGR of 4.66% through 2031. India’s PET boom and Southeast Asia’s quick-commerce packaging sustain the upward curve. Engineering plastics for electric-vehicle components further lift para-xylene offtake in North America and Europe.
Paints and coatings confront strict VOC limits that favor water-borne alternatives, trimming aromatic solvent use in architectural finishes. Industrial and refinish markets in emerging economies continue to rely on xylene for durability and processing ease, cushioning the overall decline.
Geography Analysis
Asia-Pacific held 55.22% xylene market share in 2025 and is projected to grow at 4.55% through 2031. Massive expansions such as Zhejiang Petroleum & Chemical’s 11.8 million-ton aromatics hub and Hengli Petrochemical’s 4.5 million-ton PX unit underscore the region’s dominance. India’s Jamnagar complex and Malaysia’s Pengerang project deepen regional self-sufficiency.
North America benefits from shale-gas economics but adds minimal new xylene capacity. Gulf Coast complexes remain supply linchpins, though growth prospects rest on engineering-plastics demand linked to electric vehicles. Europe, grappling with high energy costs and stricter environmental rules, has shuttered roughly 14 million tons of aromatics capacity since 2023.
The Middle East leverages low-cost feedstocks to mount export-oriented capacity. Saudi Aramco and Sinopec’s Yanbu build-out exemplifies the region’s strategic push to capture value along the aromatics chain. South America and Africa remain small contributors, with domestic supply largely meeting local demand.

Competitive Landscape
The xylene market is moderately consolidated. Integration and scale drive competitive advantage. ChemOne Malaysia’s USD 3.5 billion LD Parex-based unit illustrates appetite for large-scale, technology-driven cost leadership. Bio-aromatics innovators - including BioBTX and Anellotech - target niche, high-margin contracts with brand owners seeking lower-carbon packaging. Lagging assets are concentrated in Japan and South Korea, where naphtha-fed crackers face chronic under-utilization. Mitsubishi Gas Chemical’s exit from the ortho-xylene chain and Mitsui Chemicals’ phenol closure typify defensive retrenchment.
Xylene Industry Leaders
China Petrochemical Corporation
Exxon Mobil Corporation
Reliance Industries Limited
SK Geocentric Co., Ltd.
TotalEnergies
- *Disclaimer: Major Players sorted in no particular order


Recent Industry Developments
- September 2025: Mitsubishi Gas Chemical shut its 20,000-ton meta-xylenediamine plant in Rotterdam, recording a EUR 50.2 billion impairment amid weak mixed-xylene prices.
- January 2025: Saudi Aramco and Sinopec agreed to construct a 1.8 million-ton ethylene cracker and 1.5 million-ton aromatics facility at Yanbu, targeting 2030 start-up.


Research Methodology Framework and Report Scope
Market Definitions and Key Coverage
Our study defines the xylene market as the worldwide sale of ortho-, meta-, para-, and mixed xylenes that leave aromatics units in refineries or steam crackers and enter merchant channels for use as solvents, monomer feeds, or gasoline-blending components.
Exclusion: Volumes consumed internally in fully integrated PTA or PET complexes are outside this scope.
Segmentation Overview
- By Type
- Ortho-xylene
- Meta-xylene
- Para-xylene
- Mixed xylene
- By Grade
- Technical Grade
- High-Purity Grade (99.9 %)
- By Source
- Petroleum-based Xylene
- Bio-based Xylene
- By Application
- Solvents
- Monomer
- Other Applications
- By End-user Industry
- Plastics and Polymers
- Paints and Coatings
- Adhesives
- Other End-user Industries
- Geography
- Asia-Pacific
- China
- India
- Japan
- South Korea
- Rest of Asia-Pacific
- North America
- United States
- Canada
- Mexico
- Europe
- Germany
- United Kingdom
- France
- Italy
- Rest of Europe
- South America
- Brazil
- Argentina
- Rest of South America
- Middle-East and Africa
- Saudi Arabia
- South Africa
- Rest of Middle-East and Africa
- Asia-Pacific
Detailed Research Methodology and Data Validation
Primary Research
To plug gaps, we interview aromatics traders, refinery planners, PTA and PET resin producers in Asia-Pacific, North America, Europe, and the Middle East. Surveys with coatings formulators and adhesive blenders provide real-world consumption patterns that help us test desk-based ratios and average selling prices.
Desk Research
We begin by pulling production and trade statistics from tier-one bodies such as the U.S. Energy Information Administration, International Energy Agency, UN Comtrade, Eurostat, and the International Council of Chemical Associations. Price curves, capacity lists, and demand ratios are enriched through industry journals and technical papers. Our team next validates company financials and expansion plans through D&B Hoovers, news archives on Dow Jones Factiva, and shipment traces on Volza, which are then matched to customs codes for xylene and downstream derivatives. Macroeconomic drivers, regulatory texts from the European Chemicals Agency, and patent trends via Questel complete the desk work. The sources cited above are illustrative only, and many additional open and proprietary documents guide data collection, cross-checks, and clarification.
Market-Sizing & Forecasting
Mordor analysts create a top-down model that reconstructs global supply from refinery reformate output, xylene yield factors, and net exports, followed by selective bottom-up validation through producer capacity multiplied by utilization and typical para-xylene split ratios. Key variables include naphtha-aromatics spread, polyester fiber production, PTA operating rates, refinery run cuts, and announced PX debottlenecks. A multivariate regression links those drivers with historical xylene demand, so forecasts to 2030 adjust logically to GDP and packaging growth before being stress-tested with scenario analysis. Any country where bottom-up rolls differ materially is re-estimated through channel checks.
Data Validation & Update Cycle
Outputs pass variance and plausibility screens, senior analysts review anomalies, and results are compared with independent price and trade signals. Reports refresh each year, with off-cycle updates when feedstock shocks or capacity restarts materially move the baseline.
Why Mordor's Xylene Benchmark Is the Safer Compass
Published figures often diverge because firms select unlike units, derivative scopes, or refresh cadences. We anchor our baseline on traceable production statistics and cross-market interviews, which keeps estimates stable yet responsive.
Key gap drivers include: rival studies convert to USD values that swing with crude prices, fold downstream polyester resins into headline numbers, or rely on dated 2022 bases, whereas Mordor presents a 2025 volume core that cleanly isolates merchant xylene.
Benchmark comparison
| Market Size | Anonymized source | Primary gap driver |
|---|---|---|
| 52.34 million tons (2025) | Mordor Intelligence | - |
| USD 85.85 billion (2025) | Global Consultancy A | Value model sensitive to oil price, excludes meta-xylene trade flows |
| USD 33.1 billion (2023) | Trade Journal B | Earlier base year and limited capacity additions captured |
| USD 64.12 billion (2025) | Industry Association C | Bundles polyester resin revenue and applies uniform ASP across regions |
The comparison shows that when scope, unit of measure, and update rhythm vary, totals shift widely. By focusing on physically verifiable volumes and annually refreshed inputs, Mordor's baseline offers decision-makers a balanced, transparent figure they can reuse with confidence.


Key Questions Answered in the Report
How large is the xylene market in 2026?
The xylene market size is estimated at 53.12 million tons in 2026 and is forecast to reach 65 million tons by 2031.
What is driving future xylene demand?
Expansion of PET packaging and polyester textiles, especially in the Asia-Pacific region, is the primary engine for para-xylene consumption.
Which region leads xylene capacity growth?
Asia-Pacific leads, with major additions in China, India, and Malaysia supported by crude-to-chemicals integration.
How are VOC regulations affecting solvent use?
European and North American rules on VOCs and digital labeling are pushing paint and adhesive makers toward water-borne or exempt solvent systems.
Are bio-based xylene routes commercially viable?
Projects backed by BioBTX, Anellotech, and Origin Materials are narrowing the cost gap, supported by brand-owner offtake commitments targeting 25-30% bio-content in PET bottles by 2030.
Page last updated on:


