
Polyethylene Wax Market Size and Share
Market Overview
| Study Period | 2020 - 2031 |
|---|---|
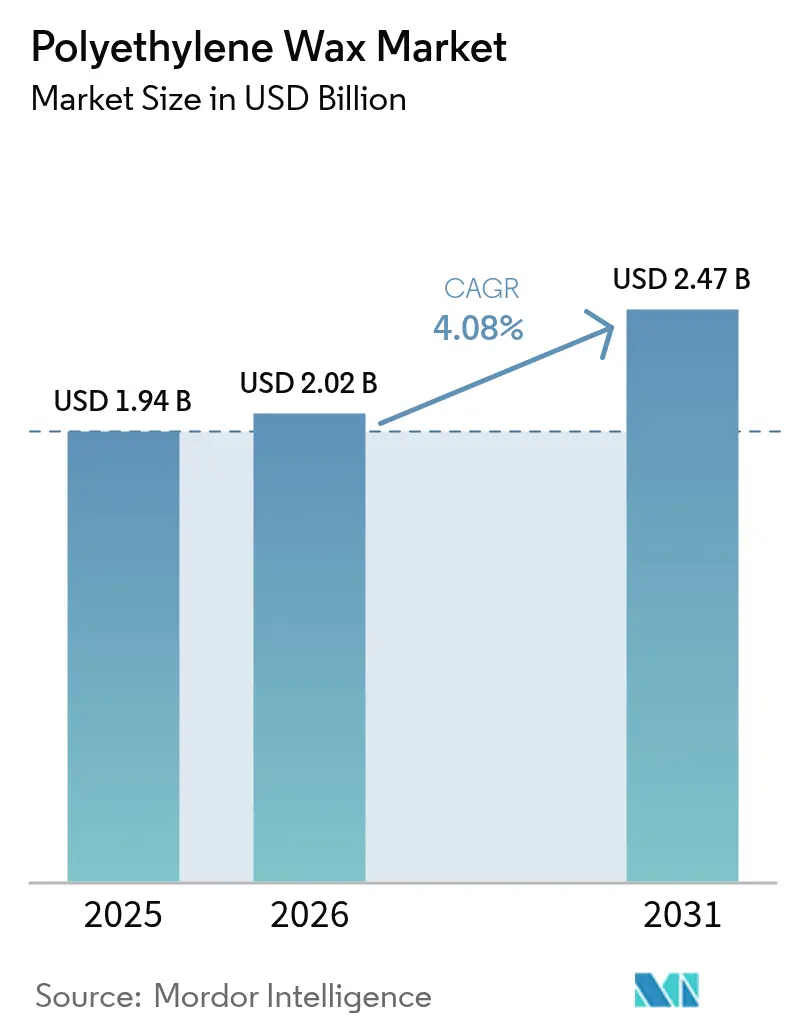
| Market Size (2026) | USD 2.02 Billion |
| Market Size (2031) | USD 2.47 Billion |
| Growth Rate (2026 - 2031) | 4.08 % |
| Fastest Growing Market | Asia Pacific |
| Largest Market | Asia Pacific |
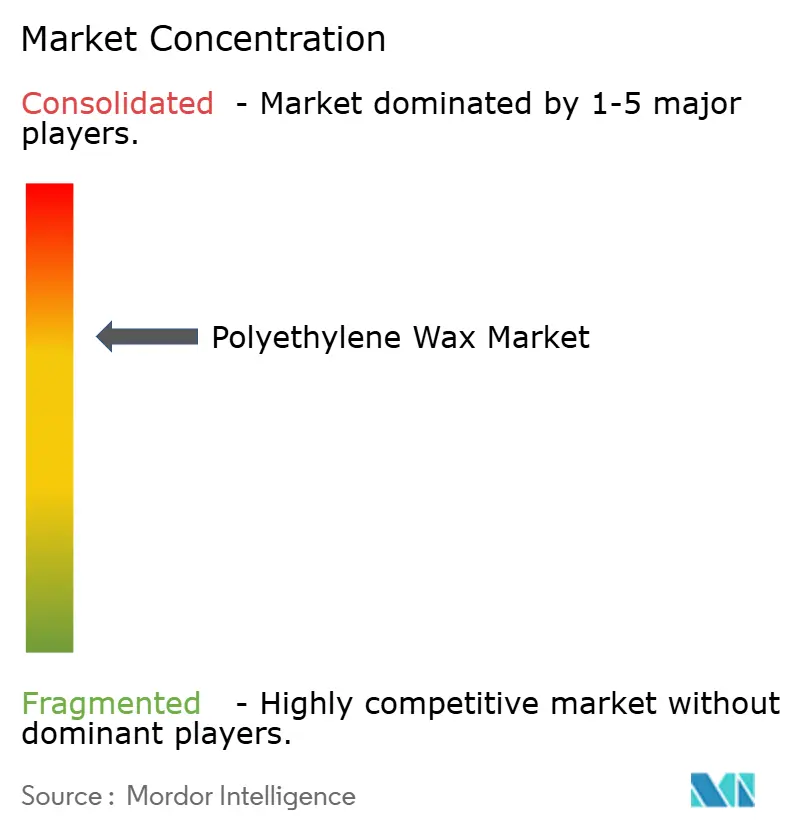
| Market Concentration | Medium |
Major Players *Disclaimer: Major Players sorted in no particular order Image © Mordor Intelligence. Reuse requires attribution under CC BY 4.0. | |
Polyethylene Wax Market Analysis by Mordor Intelligence
Polyethylene Wax market size in 2026 is estimated at USD 2.02 billion, growing from 2025 value of USD 1.94 billion with 2031 projections showing USD 2.47 billion, growing at 4.08% CAGR over 2026-2031. This growth is supported by persistent demand from PVC processing plants, the rapid scale-up of hot-melt adhesive capacity, and the steady expansion of printing inks and coatings lines across Asia-Pacific manufacturing hubs. Rising investments in Indian petrochemicals, new bio-ethylene projects in Thailand, and continuous capacity additions in Chinese PVC compounding reinforce regional consumption, even as ethylene and naphtha price swings compress margins. Over the next five years, producers are expected to prioritize oxidative and other high-value grades to meet tightening European microplastic controls while simultaneously hedging raw-material risk through multi-feedstock sourcing strategies. Competitive momentum is shifting toward companies that can guarantee performance, sustainability and supply continuity in a market where incremental product differentiation now outweighs sheer volume expansion.
Key Report Takeaways
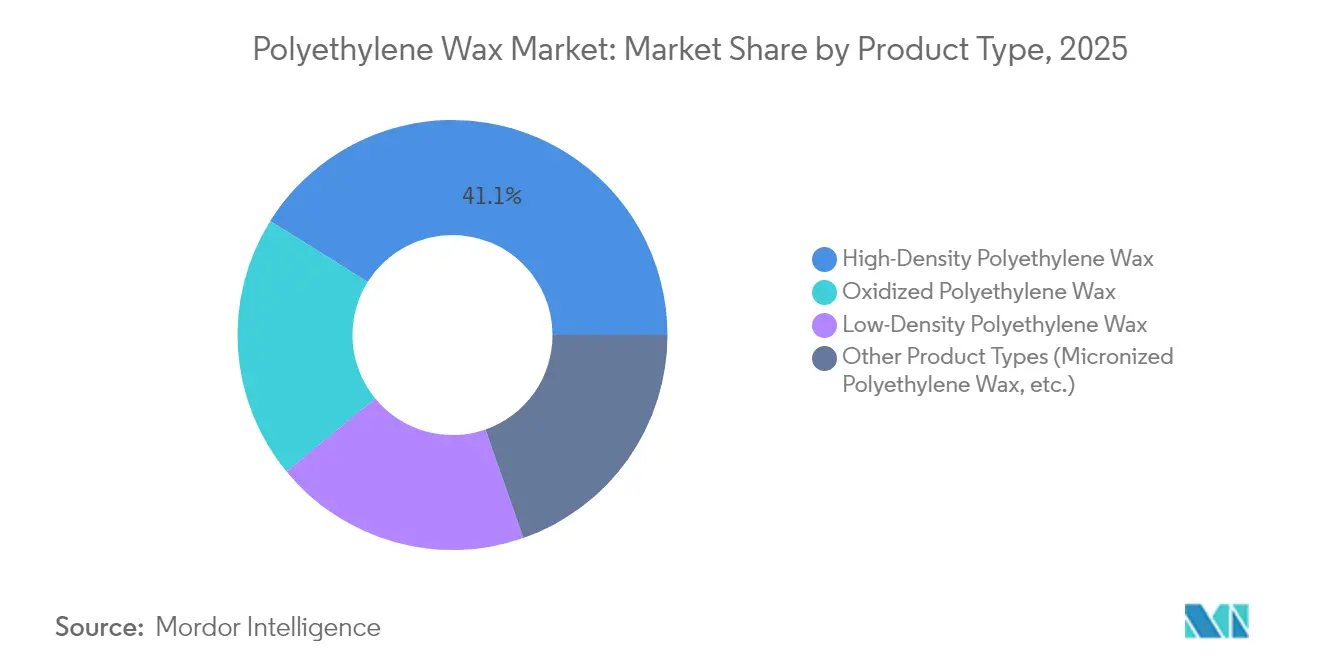
- By product type, high-density grades led with 41.10% of polyethylene wax market share in 2025, whereas oxidized grades are set to record the fastest 4.70% CAGR to 2031.
- By process, polymerization routes accounted for 56.90% of the polyethylene wax market size in 2025, while modification processes are projected to expand at a 4.86% CAGR through 2031.
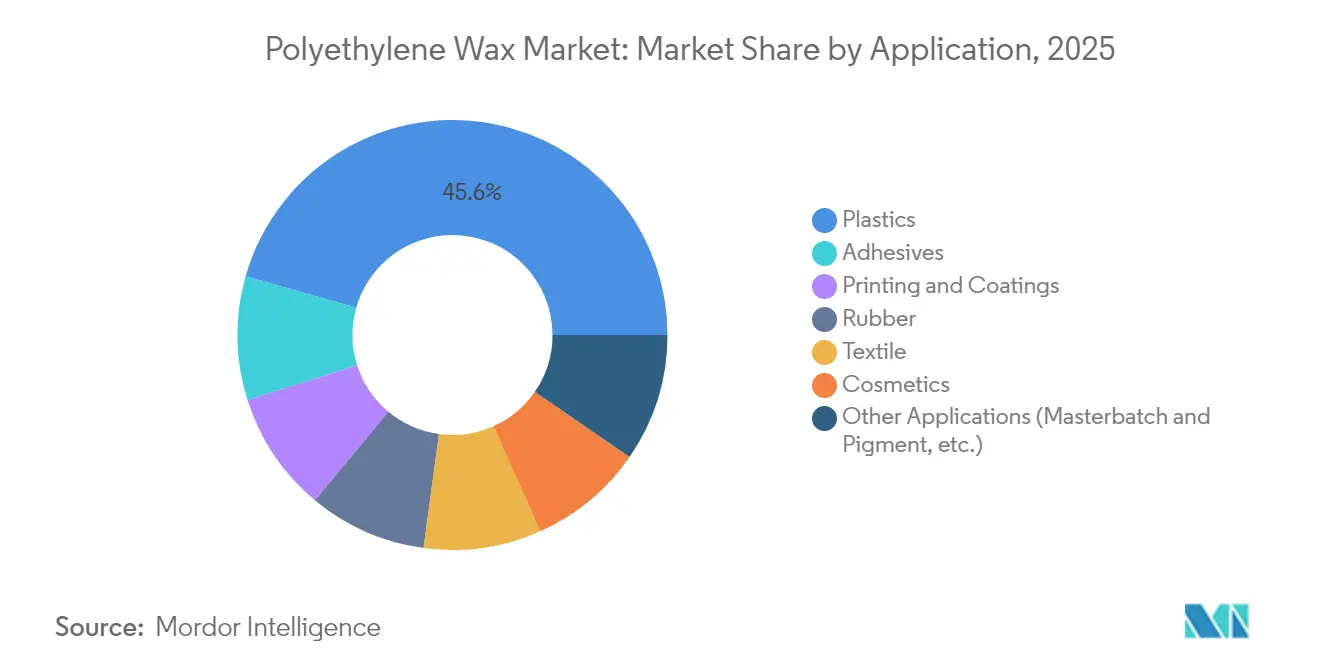
- By application, plastics processing commanded 45.60% share of the polyethylene wax market size in 2025, yet adhesives applications are advancing at a 4.95% CAGR over the forecast period.
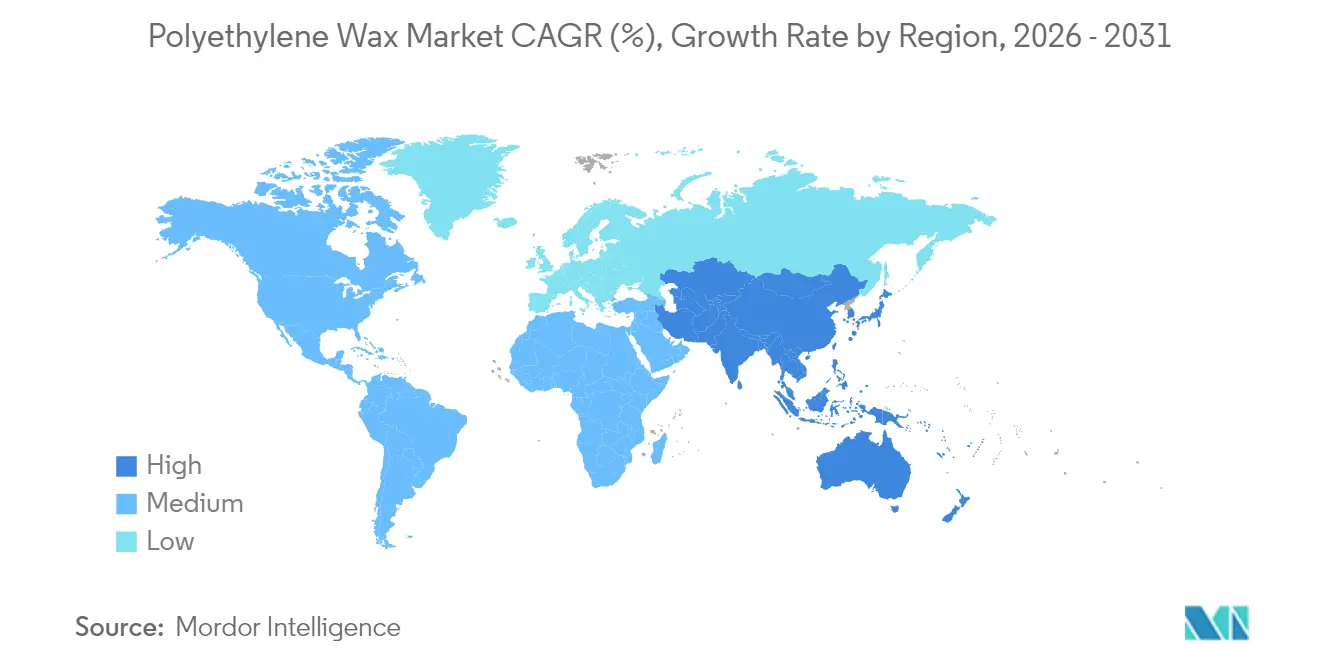
- By geography, Asia-Pacific held 51.70% of the polyethylene wax market share in 2025 and is on course for a 4.88% CAGR to 2031.
Note: Market size and forecast figures in this report are generated using Mordor Intelligence’s proprietary estimation framework, updated with the latest available data and insights as of 2026.
Global Polyethylene Wax Market Trends and Insights
Drivers Impact Analysis*
| Driver | (~) % Impact on CAGR Forecast | Geographic Relevance | Impact Timeline |
|---|---|---|---|
| Rising PVC processing volumes in Asia | +1.20% | Asia-Pacific core, spill-over to MEA | Medium term (2-4 years) |
| Surging demand for hot-melt adhesives | +0.80% | Global, with concentration in North America & EU | Short term (≤ 2 years) |
| Expansion of printing inks and coatings sector | +0.60% | Global, led by Asia-Pacific manufacturing | Medium term (2-4 years) |
| Industrial rubber compounding growth | +0.40% | Global, automotive-driven in APAC & North America | Long term (≥ 4 years) |
| Additive-manufacturing filament lubrication needs | +0.30% | North America & EU early adoption | Long term (≥ 4 years) |
| Source: Mordor Intelligence | |||
Rising PVC Processing Volumes in Asia
Robust infrastructure programmes in China, India and Vietnam continue to underpin PVC throughput, lifting demand for polyethylene wax as a key processing aid. New Chinese PVC units retain strong run rates despite overall polyethylene oversupply, thanks to government-backed civil works spending. India’s mandatory quality norms on virgin polyethylene, effective January 2024, raise material consistency standards, indirectly spurring greater uptake of high-purity waxes. Thailand’s Braskem-SCG venture is accelerating bio-ethylene integration, ensuring a more stable feedstock base that shields regional converters from oil price gyrations. Vietnam’s USD 700 million ethane upgrade at the Long Son complex adds resiliency to local supply chains. These developments enhance feedstock optionality yet heighten exposure to geopolitical and logistics risks that can ripple through the polyethylene wax market.
Surging Demand for Hot-Melt Adhesives
Rapid e-commerce growth and evolving hygiene-product formats fuel hot-melt adhesive volumes, intensifying polyethylene wax consumption as formulators fine-tune viscosity and thermal-resistance parameters. Polyethylene wax helps balance set-time, bond strength, and heat stability in packaging lines shifting to PFAS-free chemistries. Clariant’s PFAS-free AddWorks PPA illustrates how sustainability targets dictate additive choice, while Sasol’s LC100 shows that decarbonisation can coexist with performance. Although adhesive formulators can pass some feedstock hikes downstream, prolonged ethylene price spikes could squeeze margins, forcing a sharper focus on high-efficiency wax grades. As brand owners adopt recyclable mono-material packaging, demand is likely to favour oxidised waxes that enhance bonding to polar substrates.
Expansion of Printing Inks & Coatings Sector
Growth in digital printing and industrial coatings requires waxes that can deliver scratch resistance, slip, and dispersibility under faster curing conditions. BASF’s Luwax series satisfies high-shear dispersion needs for pigment-rich masterbatches, while Clariant’s rice-bran wax platform achieves up to 80% lower lifecycle emissions compared with montan alternatives. Micronised biowax powders now outperform PTFE in bio-based epoxy topcoats, reinforcing the transition toward non-fluorinated solutions. The drive for lower volatile-organic-compound coatings in Asia’s appliance factories is further expanding the polyethylene wax market as formulators migrate to waterborne systems that still need slip promoters. Nevertheless, accelerating European eco-label thresholds oblige suppliers to validate every additive against end-of-life microplastic criteria.
Industrial Rubber Compounding Growth
Automotive recovery and electrified-vehicle tyre design are lifting demand for waxes that can serve as internal lubricants and mould-release agents in high-performance rubber blends. Graphene-reinforced composites require tailored wax chemistries to ensure uniform filler dispersion and optimum cure profiles. Tin(II) oxide cross-linked CR/SBR systems likewise benefit from controlled low-molecular-weight waxes that ease demoulding without compromising flame retardancy. OEM pressure to curb rolling resistance is pushing compounders to adopt additive packages that improve flow while limiting heat buildup, thereby elevating wax functionality beyond basic processing aids. Asia-Pacific tyre expansions offset slower European output, but any downturn in global light-vehicle production could trim growth in this segment.
Restraints Impact Analysis*
| Restraint | (~) % Impact on CAGR Forecast | Geographic Relevance | Impact Timeline |
|---|---|---|---|
| Volatile ethylene and naphtha prices | -0.70% | Global; sharp in regions reliant on imported feedstock | Short term (≤ 2 years) |
| Price competition from paraffin and Fischer-Tropsch Waxes (FT) waxes | -0.50% | Global; cost-sensitive end-uses | Medium term (2-4 years) |
| Stricter micro-plastic limits in cosmetics | -0.30% | EU primary, spill-over to North America & APAC | Medium term (2-4 years) |
| Source: Mordor Intelligence | |||
Volatile Ethylene & Naphtha Prices
Ethylene and naphtha price gyrations continue to compress producer margins, especially for facilities still tied to liquid crackers. Asia’s oversupplied olefins chain has pushed ethylene prices to multiyear lows, eroding integrated profitability. In contrast, North American polymer-grade propylene values are trending higher on supply tightness, adding further volatility for modifiers derived from refinery streams. Decarbonising ethylene via electrically heated steam crackers or CCS retrofits could lift cash costs to nearly GBP 2,900 per ton, a hurdle that only large players can absorb[1]Royal Society of Chemistry, “Decarbonization Approaches for Ethylene Production,” rsc.org . Smaller wax producers lacking hedging programmes risk margin erosion whenever naphtha spikes, prompting some to explore bio-based or recycled-carbon feedstocks. Effective inventory planning and diversification into oxidative grades that use alternative feedstreams can soften the blow but cannot fully eliminate raw-material exposure.
Price Competition from Paraffin & Fischer-Tropsch Waxes
End-users in price-sensitive PVC and textile segments continue to evaluate paraffin and Fischer-Tropsch waxes as functional substitutes, exerting downward pressure on polyethylene wax premiums. Chinese FT capacity has grown steadily since 2023, driving more competitive offers into Southeast Asia and South America[2]STLE, “Market Trends,” stle.org . Petroleum-derived paraffin remains attractive in applications where low-melt hardness suffices, despite recent pressure on refinery wax pools. Producers of specialty polyethylene wax are responding by promoting superior thermal stability, lower viscosity, and regulatory compliance, but must also manage sticker-shock among converters facing tight working-capital cycles. Over the medium term, the pricing gap is expected to narrow as synthetic wax producers refine product positioning, although any prolonged slump in crude pricing could again tilt the cost equation in favour of paraffin competitors.
*Our forecasts treat driver/restraint impacts as directional, not additive. The impact forecasts reflect baseline growth, mix effects, and variable interactions.
Segment Analysis
By Product Type: High-Density Dominance Faces Oxidized Innovation
High-density grades maintained 41.10% of polyethylene wax market share in 2025, benefiting from their well-documented mechanical strength and high-temperature endurance that remain indispensable in PVC fusion and industrial-coating lines. The segment’s commanding volume continues to anchor multiples across Asia-Pacific converters that value consistent melt-point control. Oxidized waxes, though still a smaller base, are registering a 4.70% CAGR as formulators move to grades that improve adhesion, printability, and pigment wetting while meeting PFAS-free directives emanating from the EU.
Innovation within oxidized offerings focuses on balanced acid-number ranges that let processors raise recycled PVC loadings without compromising surface finish. Clariant’s Licolub PED 1316 targets exactly this need, demonstrating how suppliers are synchronising product attributes with circular-economy mandates. Meanwhile, micronised polyethylene wax is carving out niche positions in cosmetics and powder coatings thanks to its ability to deliver anti-blocking and matting at very low dosages. Although regulatory scrutiny around microplastics could temper cosmetic uptake, suppliers are repositioning these grades around bio-based claims and higher bio-carbon content. As a result, product differentiation rather than bulk volumes will dictate profitability trajectories within the polyethylene wax market.



By Process: Polymerization Leadership Challenged by Modification Growth
Polymerization routes delivered 56.90% of the polyethylene wax market size in 2025, relying on mature reactors, advantaged ethane feed and robust economies of scale that keep cost curves low. The pathway also underpins the bio-based capacity that Braskem is scaling in Brazil and Thailand, enhancing low-carbon options that resonate with brand-owner decarbonisation charts. Modification processes—embracing peroxide grafting, controlled oxidation and thermal cracking—are expanding at a 4.86% CAGR as customers request tighter molecular-weight windows and polar functionalities that improve compatibility with polar polymers.
Mitsui Chemicals’ Hi-Wax range shows how incremental functionalisation delivers value, offering acid-value and Fischer-Tropsch-type grades for specialised melt-viscosity profiles. In parallel, solution-state peroxide techniques are opening pathways for semi-telechelic structures that broaden adhesion while avoiding crosslinking into thermosets. Although thermal-cracking baskets remain a modest slice, they cater to high-CI, low-MW niches such as cable-filler compounds. Capex allocation is increasingly tilting toward incremental upgrades that boost line flexibility, enabling producers to pivot between high-density and oxidized output responsive to near-term order patterns.
By Application: Plastics Dominance Yields to Adhesives Momentum
Plastics processing absorbed 45.60% of the polyethylene wax market size in 2025, anchored by PVC extrusion, masterbatch dispersion, and polyolefin compounding lines that rely on waxes to lower melt viscosity and improve throughput. Even so, the adhesives segment is accelerating at a 4.95% CAGR on the back of robust hot-melt demand from packaging, e-commerce fulfilment, and hygiene disposables. This shift underscores a propensity for end-use diversification as processors search for higher-margin outlets less exposed to polymer pricing cycles.
Wax grades tailored for hot-melt formulations must provide consistent hardness and narrow MW spreads to fine-tune set speed—features oxidized and low-density grades can deliver. In printing and coatings, digital press adoption drives formulations that need abrasion resistance without sacrificing flow, further solidifying wax penetration. Rubber-compound usage is stepping up with the automotive rebound, yet any drop in vehicle builds could dent demand. Cosmetics remain a wildcard: European microplastic restrictions challenge traditional polyethylene wax but simultaneously create white-space for bio-based or functionalised offerings that comply with new thresholds. Textile fibre lubricants retain a slim but stable slice of consumption as Asia’s filament producers sustain value-added yarn output.
Geography Analysis
Asia-Pacific anchored 51.70% of polyethylene wax market share in 2025 and is tracking a 4.88% CAGR through 2031, driven by persistent infrastructure spending, expanding petrochemical footprints, and competitive production costs. China’s PVC conduit and window-profile plants continue to consume large volumes even as broader polyethylene oversupply dents price realisation, while Vietnam’s and Thailand’s bio-ethylene upgrades enhance regional feedstock autonomy. India has set aside USD 87 billion for new petrochemical complexes, ensuring downstream wax demand remains buoyant in tandem with domestic pipe and packaging growth. Japan and South Korea contribute high-value demand for coating and battery components, reinforcing Asia-Pacific’s leadership across both volume and value metrics.
North America displays a mature but resilient profile, aided by low-cost shale-gas ethane that underpins competitive polymerization wax output. Planned PVC expansions at Formosa and Shintech could lift domestic wax off-take, although volatile propylene pricing may temper profitability. Canada’s focus on circular-economy polymers and Mexico’s growing packaging-film cluster complete the regional picture, maintaining steady yet slower growth relative to Asia. Europe faces a dual-track future: strict microplastic legislation and an accelerated green-deal agenda are compelling reformulations toward bio-based waxes while simultaneously raising compliance costs. Honeywell’s partnership with Vioneo on a EUR 1.5 billion fossil-free plastics complex in Belgium underscores a pivot toward low-carbon feedstocks, signalling potential bumps for traditional wax imports. Germany, the UK and France remain strong adopters of high-performance coatings and engineered compounds that rely on specialty wax grades. South America, led by Brazil’s Braskem expansions, and the Middle East & Africa, leveraging Saudi downstream ambition, represent emerging demand pockets; however, logistical challenges and currency fluctuations are likely to keep these regions at mid-single-digit growth rates for the medium term.

Value Chain Analysis
Polyethylene wax value creation starts upstream with ethylene production (from naphtha- or ethane-based crackers) and, in some cases, comonomers such as alpha-olefins. Producers then select among three main routes: controlled direct polymerization to low molecular weight wax, thermal degradation (cracking) of higher molecular weight polyethylene, or recovery and purification of low-MW fractions from polyethylene resin streams. Catalysts (for example, Ziegler-Natta or metallocene families), hydrogen for molecular-weight control, and purification systems (often solvent-based) determine achievable grade windows and cost. Integrated petrochemical players can reduce feedstock volatility by leveraging internal olefins and polyethylene infrastructure.
Midstream processing and finishing typically includes oxidation or other modification steps to add polarity, supporting adhesion, pigment wetting, and compatibility with polar substrates. Pelleting, flaking, or micronizing then tailors product handling to downstream needs. Distribution runs through direct sales to large compounders and formulators and through specialty chemical distributors serving inks, coatings, and adhesives customers, where technical service and consistent supply are differentiators for processing-sensitive applications. Downstream pull is concentrated in PVC processing aids and masterbatches, hot-melt adhesives, and printing inks and coatings, with product qualification and logistics (iso-containers, bags, and bulk) acting as practical bottlenecks that favor multi-regional manufacturers and established additive networks such as BASF, Clariant, SCG Chemicals, Mitsui Chemicals, Honeywell, and Gulbrandsen.
Competitive Landscape
The polyethylene wax market is moderately consolidated. BASF leverages its global additive network to embed waxes into broad masterbatch solutions, enhancing customer lock-in. Clariant continues to differentiate through bio-based additive launches such as the Licocare RBW Vita series, introducing renewable carbon content without sacrificing functionality. Braskem maintains first-mover advantage in renewable waxes, having upscaled green-ethylene capacity to 260 ktpa and released the world’s first sugar-cane-based polyethylene wax in 2025.
Strategic moves in 2024-2025 highlight a pivot from volume expansion toward sustainability and speciality focus. Honeywell’s spin-off of its Advanced Materials business, rebranded as Solstice Advanced Materials, positions the new entity to target high-margin engineered waxes within a USD 3.7-3.9 billion revenue bracket at 25% EBITDA margins. Mitsui Chemicals is upgrading modification reactors to raise output of acid-value Hi-Wax grades, aiming to capture growth in polar-polymer coupling agents. Emerging Asian producers are backing Fischer-Tropsch routes that can flex between synthetic paraffin and polyethylene wax cuts, a tactic geared toward cost-sensitive markets in textiles and PVC. Patent filings indicate heightened activity around peroxide functionalisation and bio-carbon grafting, suggesting future competition will reside in molecular-level engineering rather than greenfield capacity races.
Supply-chain agility is becoming a core competitive parameter. Producers are augmenting rail and iso-container logistics to cushion ethylene and naphtha shocks, while simultaneously implementing scope-3 carbon transparency to satisfy downstream brand owners. Companies with multi-regional production grids can redirect volumes to offset regional feedstock dislocations, a capability that smaller firms often lack. As a result, competitive positioning is shifting toward integrated, sustainability-ready portfolios that can weather raw-material volatility while meeting stringent customer performance specifications within the polyethylene wax market.
Polyethylene Wax Industry Leaders
BASF SE
Clariant
DEUREX
Honeywell International Inc.
MITSUI CHEMICALS,INC.
- *Disclaimer: Major Players sorted in no particular order

Market Opportunities and Future Outlook
White-space is strongest where end users are looking for both performance and compliance. Oxidized and other functionalized polyethylene waxes that improve adhesion and dispersibility are gaining traction in packaging adhesives, inks, and waterborne coatings as formulators reformulate around PFAS-free and microplastic-related requirements. This supports the report’s mix shift toward higher-value grades, and it is reinforced by named supplier activity such as Clariant positioning oxidized grades (including Licolub PED 1316) for higher recycled content and process-efficiency needs.
On the supply side, opportunities cluster around localized capacity additions and production flexibility close to fast-growing conversion hubs. Gulbrandsen announced a Dahej, India expansion combining additional polyethylene wax capacity with a new functional polymers plant, targeted for mid-2026 operations, which aligns with demand for specialty portfolios rather than only commodity volumes. Producers also have room to capture incremental gains through debottlenecking and upgrades, including a 3,500 t/a polyethylene wax unit upgrade and first deliveries of new product batches at Jilin Petrochemical, which can improve responsiveness in applications such as PVC processing and hot-melt adhesives where consistency and lead times matter.
Recent Industry Developments
- May 2026: Dushanzi Petrochemical reported a construction milestone for its 1.2 million tons/year Phase II ethylene project in the Korla Shangku High-tech Industrial Development Zone, where polyethylene wax can be generated as a value-added by-product from the broader olefins chain. Linking wax availability to large cracker expansions can shift regional supply elasticity and pricing dynamics for standard grades. The development also highlights how integrated complexes can monetize low-molecular-weight streams instead of treating them as secondary cuts.
- September 2025: Jilin Petrochemical completed technical upgrades on its 3,500 t/a polyethylene wax plant and delivered the first batch of Y80 polyethylene wax products. The upgrade underscores a trend toward efficiency-led capacity release through revamps rather than new builds, with direct impacts on local availability for converters needing tighter quality consistency. It also signals increasing product differentiation at the plant level following modernization.
- April 2024: EDO Waxes (a subsidiary of Shamrock Technologies) and South Carolina Polymer Group (SCPG) formed a joint venture, NeuWax, in Cowpens, South Carolina, to manufacture and distribute oxidized polyethylene wax. Establishing a dedicated oxidized-wax platform in the United States supports faster qualification cycles and shorter lead times for inks, coatings, and plastics customers using polar wax grades. The JV structure also broadens go-to-market reach by pairing manufacturing with distribution focus.


Research Methodology Framework and Report Scope
Market Definition and Coverage
For this study, the polyethylene wax market is defined as revenue generated from the sale of PE wax (including oxidized grades) used as a processing and performance additive across plastics, coatings and inks, adhesives, rubber, and other industrial uses, tracked on a global basis.
Scope exclusions: Excludes non-PE wax chemistries and internal captive transfers that do not represent an arm's length market transaction.
Segmentation Overview
- By Product Type
- High-Density Polyethylene Wax
- Low-Density Polyethylene Wax
- Oxidized Polyethylene Wax
- Other Product Types (Micronized Polyethylene Wax, etc.)
- By Process
- Polymerization
- Modification
- Thermal Cracking
- By Application
- Plastics
- Adhesives
- Printing and Coatings
- Rubber
- Cosmetics
- Textile
- Other Applications (Masterbatch and Pigment, etc.)
- By Geography
- Asia-Pacific
- China
- Japan
- India
- South Korea
- ASEAN Countries
- Rest of Asia-Pacific
- North America
- United States
- Canada
- Mexico
- Europe
- Germany
- United Kingdom
- France
- Italy
- Spain
- Russia
- NORDIC Countries
- Rest of Europe
- South America
- Brazil
- Argentina
- Rest of South America
- Middle East and Africa
- Saudi Arabia
- South Africa
- Rest of Middle East and Africa
- Asia-Pacific
Data Sources, Market Sizing, and Validation
Desk Research
Our desk research starts by mapping the demand context and the supply chain flow for polyethylene wax, so later assumptions can be tied to observable industrial activity. We use public sources such as USGS materials context notes and UN Comtrade trade statistics for relevant wax and polymer related flows, then supplement with national customs and port statistics where available. Regulatory and safety documents (including SDS conventions and regional chemical inventories) are used to confirm product definitions and usage patterns.
After that, the model inputs are tightened using company annual reports, investor presentations, and press releases that describe capacity additions, grade positioning, and end use focus. For checks on company financials, news, and patent activity, we also refer to paid subscriptions that consolidate filings, corporate actions, and patent families, which helps reduce the risk of missing smaller but fast growing product lines. The desk sources listed here are illustrative only, and we used additional public references during data collection, validation, and clarification across the analysis.
Primary Interviews and Surveys
Primary work is used to pressure test the desk assumptions around product mix, average selling price movement, and the split of demand between coatings and inks versus plastics processing and adhesives. We spoke with producers, distributors, compounders, and end users across APAC, EMEA, and the Americas to validate typical grade splits, procurement cycles, and how feedstock volatility affects pricing and substitution behavior.
Distribution of primary research fieldwork respondents
| Company type | Respondent position | Region |
|---|---|---|
| Top tier: 29% | CXOs: 17% | APAC: 48% |
| Mid tier: 50% | Functional/Unit leaders: 39% | EMEA: 30% |
| Smaller Players: 21% | Managers: 44% | Americas: 22% |
Market-Sizing & Forecasting
Sizing is built using a top-down approach where polymer and additives consumption signals, manufacturing activity, and trade flows are translated into a realistic demand pool for polyethylene wax, then filtered by application usage rates and typical dosage patterns. We corroborate those totals with selective bottom-up approximations, including sampled price bands by grade, distributor channel checks, and a supplier roll up for regions where disclosure is clearer, and we adjust the totals when the two views do not reconcile.
Key inputs used in the model include regional plastics and masterbatch output trends, coatings and printing ink production indicators, hot melt adhesive demand direction, and feedstock and energy linked price movement. We also account for the observed shift toward oxidized and micronized grades for performance requirements. Where data is uneven by country, we use proxy indicators such as industrial production indices and import dependence, followed by a recheck with interview feedback.
For forecasting, scenario analysis is applied around feedstock cost cycles, manufacturing growth, and end use demand strength, and the selected path is aligned to what industry participants describe as their planning case. The final forecast keeps pricing and volume logic separate, so growth is not overstated when price softens in a given year.
Data Validation & Update Cycle
Outputs are validated through repeated triangulation between the model, independent industry signals, and what respondents describe as actual buying patterns. Large variances trigger follow ups, and outliers are reviewed to confirm whether they reflect real events such as plant outages, new capacity, or temporary trade distortions.
Before sign off, the dataset and calculations go through multi step analyst reviews, including unit consistency checks, currency conversion timing checks, and region level reasonableness tests against known downstream activity. Reports are refreshed annually, and interim updates are made when material events occur. Right before delivery, an analyst runs a fresh pass so clients receive the latest updated view.
Mordor Intelligence's Polyethylene Wax Market Size Compared Against Other Published Estimates
Published market size numbers for polyethylene wax rarely match perfectly because each publisher draws the line differently on product scope, base year selection, and how pricing is treated across grades and regions. Differences also show up when forecasts assume a steady price rise versus a more cyclical path tied to feedstock and manufacturing conditions.
The main gap comes from whether oxidized PE wax and micronized grades are counted fully, and whether demand is built from end use dosage logic versus broader chemicals benchmarks. In our scope, Mordor Intelligence treats the market as polyethylene wax revenues tied to specific application demand pools, with grade level price progression checked through interviews. Currency timing and refresh cadence also matter, since some estimates convert using a single annual rate even when price swings are visible within the year.
Benchmark comparison
| Source | Market Size | Gaps in Research Methodology |
|---|---|---|
| Mordor Intelligence | USD 2.02 B (2026) | |
| Global Research Publisher A | USD 1.77 B (2024) | Uses an earlier base year and can understate the market when later capacity additions and grade mix upgrades are not reflected, and the pricing build is often presented as a single blended number across regions. |
| Industry Research Group B | USD 2.58 B (2024) | Reports a larger 2024 value that may reflect broader inclusions and a more aggressive volume growth assumption into multiple applications, with less visible separation between price effects and real volume expansion. |
The spread in the table is mainly explained by scope and timing, followed by how volume and price are combined across grades and regions. By keeping inputs tied to observable downstream activity and then rechecking them with market participants, the final number stays traceable to clear steps that can be repeated when new data points emerge.


Key Questions Answered in the Report
What is the current polyethylene wax market size?
The polyethylene wax market size is USD 2.02 billion in 2026 and is projected to reach USD 2.47 billion by 2031.
Which region leads the polyethylene wax market?
Asia-Pacific accounts for 51.70% of global demand and is also the fastest-growing region at a 4.88% CAGR through 2031.
Which product segment is growing the fastest?
Oxidized polyethylene wax is the fastest-expanding product segment, registering a 4.70% CAGR on the back of rising demand for adhesion-enhancing and PFAS-free solutions.
Why are hot-melt adhesives important to the polyethylene wax market?
Hot-melt adhesives require polyethylene wax for viscosity control and set-time optimisation, and their rapid growth—particularly in sustainable packaging—is propelling wax consumption at a 4.95% CAGR in this application segment.
How are feedstock price fluctuations affecting the market?
Volatile ethylene and naphtha prices squeeze producer margins, making supply-chain diversification and bio-based feedstock integration critical strategic priorities.
What sustainability trends influence future demand?
European microplastic regulations and brand-owner decarbonisation goals are pushing producers toward bio-based, oxidized and high-functionality wax grades that can meet both performance and environmental criteria.
Page last updated on:


 Your data is secure and never sold or shared.


