
X-Ray Tube Market Size and Share
Market Overview
| Study Period | 2020 - 2031 |
|---|---|
| Market Size (2026) | USD 3.78 Billion |
| Market Size (2031) | USD 4.77 Billion |
| Growth Rate (2026 - 2031) | 4.76% CAGR |
| Fastest Growing Market | Asia-Pacific |
| Largest Market | North America |
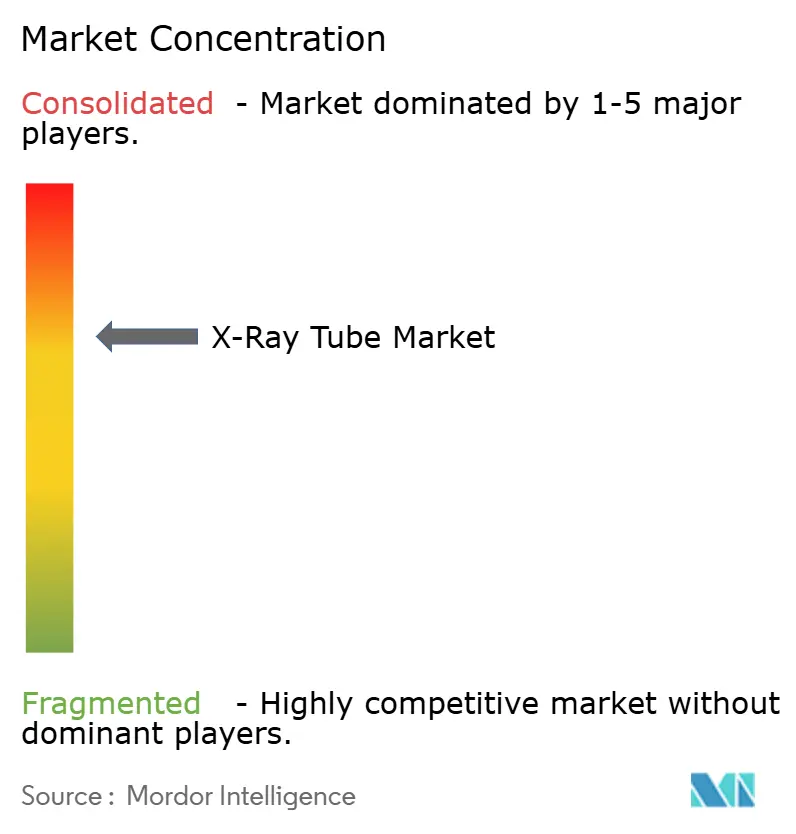
| Market Concentration | Medium |
Major Players *Disclaimer: Major Players sorted in no particular order Image © Mordor Intelligence. Reuse requires attribution under CC BY 4.0. | |
X-Ray Tube Market Analysis by Mordor Intelligence
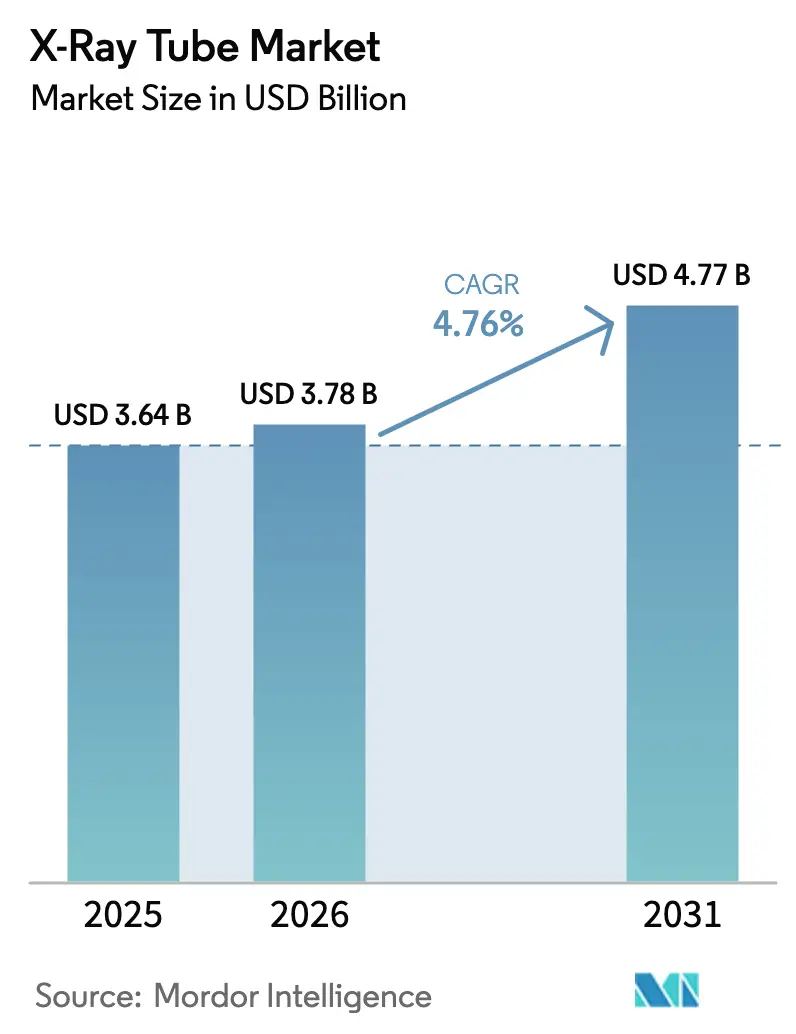
The X-Ray Tube market size stood at USD 3.64 billion in 2025, USD 3.78 billion in 2026 and is projected to reach USD 4.77 billion by 2031, translating into a 4.76% CAGR over the forecast period. Demand is underpinned by surging chronic disease incidence, hospital upgrades to photon-counting CT systems, and the diffusion of predictive maintenance contracts that lengthen replacement cycles while expanding the installed base. Vendor emphasis on high-heat rotating-anode designs that withstand multi-slice duty cycles, coupled with cold-cathode field-emission launches for next-generation stationary gantries, is expanding the solution choices for providers. Simultaneously, emerging-economy infrastructure programs and value-based-care mandates in mature markets keep procedure volumes resilient despite reimbursement pressure.
Key Report Takeaways
- By tube type, rotating anode designs led with 52.63% X-Ray Tube market share in 2025; cold-cathode field-emission tubes are forecast to expand at a 5.13% CAGR through 2031.
- By application, computed tomography captured 41.37% of the X-Ray Tube market size in 2025, whereas mobile C-arm and fluoroscopy segments are advancing at a 4.99% CAGR to 2031.
- By component, tube housing and envelope units held 30.26% share in 2025; cathode assemblies record the fastest growth at 5.21% CAGR through 2031.
- By end user, hospitals and health systems accounted for 55.48% of demand in 2025, while outpatient clinics are rising at a 4.89% CAGR amid site-of-care shifts.
- By geography, North America led with 40.26% revenue share in 2025; Asia-Pacific is the fastest region, expanding at a 6.33% CAGR.
Note: Market size and forecast figures in this report are generated using Mordor Intelligence’s proprietary estimation framework, updated with the latest available data and insights as of January 2026.
Global X-Ray Tube Market Trends and Insights
Drivers Impact Analysis*
| Driver | (~)% Impact on CAGR Forecast | Geographic Relevance | Impact Timeline |
|---|---|---|---|
| Escalating Global Burden of Chronic Diseases Necessitating Diagnostic Imaging | +1.2% | Global, with acute pressure in Asia-Pacific and Middle East | Medium term (2-4 years) |
| Rapid Performance Gains in High-Heat Rotating-Anode Designs | +0.9% | North America and Europe, spillover to Asia-Pacific | Short term (≤ 2 years) |
| Accelerating Upgrade Cycle to Digital Radiography and Multi-slice CT Systems | +1.1% | Global, led by North America and Western Europe | Medium term (2-4 years) |
| Healthcare-infrastructure Build-outs in Emerging Economies | +0.8% | Asia-Pacific core, Middle East and Africa secondary | Long term (≥ 4 years) |
| AI-enabled Predictive-maintenance Business Models Expanding Tube-replacement Demand | +0.5% | North America and Europe, early adoption in urban Asia-Pacific | Medium term (2-4 years) |
| Emergence of Cold-cathode Multi-source Arrays Creating New Demand Pockets | +0.3% | Global, niche adoption in research institutes and high-end clinical sites | Long term (≥ 4 years) |
| Source: Mordor Intelligence | |||


Escalating Global Burden of Chronic Diseases Necessitating Diagnostic Imaging
Cardiovascular, oncologic, and respiratory disorders now account for over 70% of global deaths, pushing CT angiography, chest radiography, and screening mammography volumes higher and directly stimulating X-Ray Tube market demand.[1]International Agency for Research on Cancer, “Cancer Statistics,” Iarc.who.int The International Agency for Research on Cancer projects 28.4 million new cancer cases annually by 2040, implying the need for 15,000 additional CT scanners and commensurate tube inventories worldwide. Populations aged 65 years and older undergo diagnostic imaging at triple the rate of younger cohorts, a demographic shift that maintains a long runway for volume growth. Governments in China and India place imaging capacity at the center of national health strategies, embedding tube procurement targets in policy roadmaps. In mature markets, value-based payment models reward early diagnosis, which paradoxically lifts exam counts even when reimbursement per scan tightens.
Accelerating Upgrade Cycle to Digital Radiography and Multi-slice CT Systems
Analog radiography units are retiring at an 8-10% annual clip in North America and Europe as providers pivot to detector-based workflows that mandate high-frequency generators and pulsed-exposure tubes. Multi-slice CT penetration nears 80% in developed economies, yet the leap from 64-slice to 256-slice platforms forces tube upgrades to handle faster gantry rotations and dual-energy protocols. Canon’s 0.25-millimeter focal-spot CT launched in 2024 spotlighted how scanner innovation pulls tube design along the performance curve. Emerging markets bypass film entirely, installing digital radiography in 90% of new rooms, thereby enlarging the replacement pool for entry-level tubes. EU regulations additionally require dose-reporting functions that obsolete legacy analog gear and its associated tube stock.
Rapid Performance Gains in High-Heat Rotating-Anode Designs
Contemporary rotating-anode assemblies shed 5-8 megajoules of energy via liquid-metal bearings, enabling continuous trauma imaging without thermal shutdowns. Nanophotonic coatings marketed by Varex radiate heat 30% more efficiently, lengthening tube life from 40,000 to 60,000 exposures and lowering per-scan costs. GE’s TubeWatch system uses telemetry to power predictive algorithms that schedule tube replacements before failures occur, helping keep CT scanners in service more than ninety percent of the time. Meanwhile, photon-counting detector deployments demand extremely high photon flux levels, a requirement that only high-heat tube designs can meet. As lifecycle economics replace sticker price in purchasing criteria, premium tubes capture growing share despite higher upfront cost.
Healthcare-Infrastructure Build-outs in Emerging Economies
China’s Healthy China 2030 and India’s Ayushman Bharat will collectively channel more than USD 200 billion into facility upgrades through 2030, with imaging suites prominent in spending plans. District-hospital orders for locally manufactured rotating-anode tubes signal rising self-sufficiency and price competitiveness in Asia-Pacific. Thailand, Singapore, and Malaysia pursue medical-tourism strategies that necessitate state-of-the-art CT and interventional platforms, again boosting tube replacement cycles. African nations, backed by multilateral development banks, begin outfitting regional hospitals with first-generation CT units, creating a new installed base for tube vendors. Over the long term, these deployments anchor service contracts and aftermarket sales that underpin the growth trajectories of the X-Ray Tube market.
Restraints Impact Analysis*
| Restraint | (~) % Impact on CAGR Forecast | Geographic Relevance | Impact Timeline |
|---|---|---|---|
| Stringent Device-approval and Radiation-safety Regulations | -0.6% | Global, most acute in North America and Europe | Short term (≤ 2 years) |
| High Upfront and Service Costs of Advanced Tubes | -0.5% | Emerging markets in Asia-Pacific, Middle East, and Africa | Medium term (2-4 years) |
| Supply-chain Risk for High-purity Tungsten/Rhenium and Liquid-bearing Alloys | -0.4% | Global, with acute exposure in North America and Europe | Medium term (2-4 years) |
| Share-shift to Ultrasound and Low-field MRI for POC Imaging in Mature Markets | -0.3% | North America and Western Europe | Long term (≥ 4 years) |
| Source: Mordor Intelligence | |||
Stringent Device-Approval and Radiation-Safety Regulations
Updates to the IEC safety standard for diagnostic X-ray equipment have significantly reduced the allowable radiation leakage at a standard measurement distance, forcing manufacturers to redesign shielding and extend their compliance testing. These changes have commonly stretched validation timelines, pushing product launches back by as much as a year. FDA 510(k) review now demands continuous-duty thermal testing, forcing vendors to invest as much as USD 1 million in accelerated life-test rigs. Europe’s Medical Device Regulation imposes post-market surveillance and unique device identification requirements on every device, placing a disproportionate burden on smaller entrants in terms of compliance spending. China’s National Medical Products Administration rolled out domestic-content thresholds, compelling foreign suppliers to localize or cede share. Collectively, these rules slow product refresh cycles and raise fixed costs, tempering near-term X-Ray Tube market expansion.
High Upfront and Service Costs of Advanced Tubes
Liquid-metal-bearing, nanophotonic-coated tubes list 40-60% above conventional units, a premium many community hospitals and emerging-market facilities cannot absorb. Predictive-maintenance subscriptions add USD 15,000-25,000 annually per scanner, stretching thin operating budgets in rural settings. District hospitals in India and Indonesia typically earmark under USD 50,000 yearly for imaging service, an amount inadequate for even one CT tube swap. Currency depreciation risk compounds the challenge because tubes are invoiced in USD or EUR, exposing buyers to fluctuating import costs. The rise of refurbished-tube vendors who discount OEM prices by up to 70% highlights mounting cost sensitivity and margin compression in the X-Ray Tube market.
*Our forecasts treat driver/restraint impacts as directional, not additive. The impact forecasts reflect baseline growth, mix effects, and variable interactions.
Segment Analysis
By Tube Type: Cold-Cathode Designs Erode Thermionic Leadership
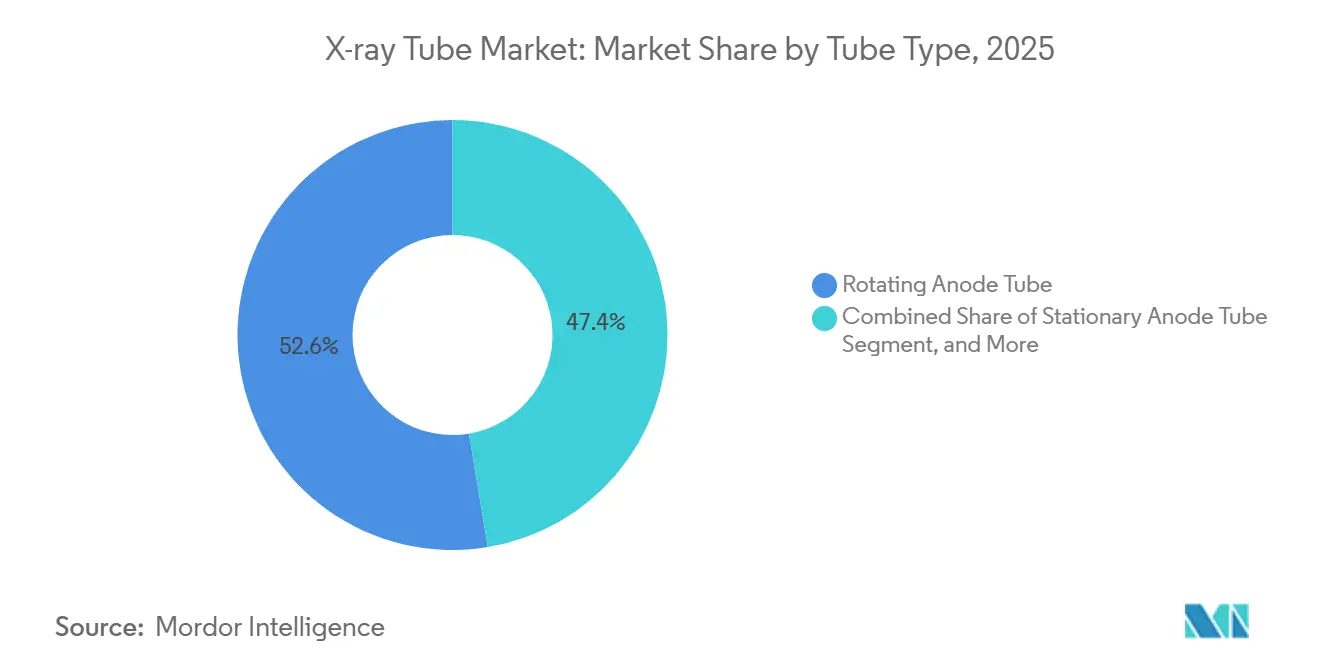
The segment generated the largest revenue from rotating anode variants, which held a 52.63% X-Ray Tube market share in 2025, due to its 5 megajoule heat capacity, suited to multi-slice CT workloads. Cold-cathode field-emission models are forecast to expand at a 5.13% CAGR, making them the most dynamic category as instant-on carbon-nanotube emitters eliminate filament burnout and permit compact multi-source arrays for stationary CT. Stationary-anode products remain prevalent in dental and portable imaging because their smaller footprints and lower power draw fit point-of-care scenarios, though their share gradually slips as digital detectors shorten exposure times. Micro-focus tubes anchor industrial nondestructive testing and research niches, delivering sub-10 µm focal-spots that resolve micro-cracks in composite airframes and biological samples.
Excillum’s MetalJet system exemplifies disruptive potential, utilizing a self-healing gallium-indium anode to tolerate ten times higher power density than solid targets, unlocking brightness once limited to synchrotrons. Carbon-nanotube cathodes in portable units eliminate warm-up delay and reduce battery draw by 30%, a critical feature for disaster-response deployment. Regulatory bodies recognize the merit of cold-cathode safety advantages, as eliminating filament circuits simplifies electrical isolation, thereby easing compliance with IEC 60601-1-2. The confluence of performance, uptime, and compliance benefits is expected to accelerate cold-cathode adoption, ultimately redefining competitive boundaries in the X-Ray Tube market.


By Component: Cathode Enhancements Propel Performance Gains
Tube housing and envelopes delivered 30.26% of 2025 revenue as the primary heat-sink and radiation-shield layers, yet cathode subassemblies are on a faster 5.21% CAGR track through 2031. Dispenser cathodes embed barium-oxide emitters in porous tungsten, maintaining stable emission for up to 50,000 hours and enabling tighter focal spots demanded by photon-counting CT. Tungsten-rhenium targets still account for roughly two-thirds of bill-of-materials cost, and with fewer than five suppliers globally, manufacturers pursue vertical integration to lock in feedstock and margin.
Liquid-metal bearings are quickly supplanting ball bearings in tubes rated above 4 megajoules, eradicating mechanical wear and vibration while extending life to 100,000 exposures. Canon’s molybdenum-underlayer anode design mitigates focal-track cracking in high-duty mammography, evidence of how micro-material tweaks translate into competitive differentiation. Rotor and stator systems now use magnetic levitation to support 4-revolution-per-second gantry spins without noise, a selling point for cardiac CT suites that operate around the clock. Modular architectures that allow in-field replacement of cathode or anode only, rather than the whole tube, reduce downtime and align with outcome-based service models that dominate the X-Ray Tube market.
By Application: Mobile C-Arm and Fluoroscopy Gain Momentum
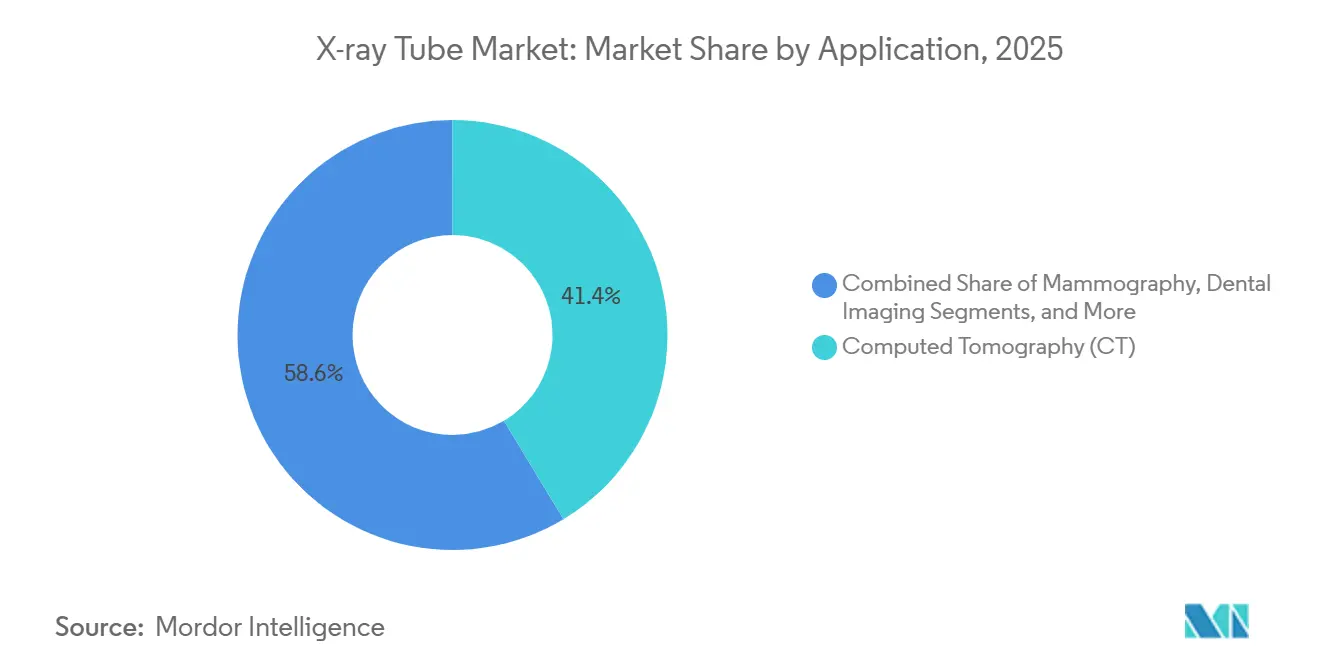
Computed tomography retained 41.37% of 2025 sales due to an installed base exceeding 50,000 scanners worldwide and a strong pipeline of photon-counting upgrades. Mobile C-arm and fluoroscopy are the growth engines, rising at a 4.99% CAGR, in line with the expansion of hybrid operating rooms and the increasing volumes of interventional cardiology cases that necessitate prolonged, continuous exposures. General radiography remains ubiquitous, yet price competition narrows margins and triggers supplier consolidation. Mammography utilization stabilizes in high-income countries, where screening intervals lengthen, while adoption in emerging markets increases as awareness programs proliferate.
Dental imaging continues to command premium per-unit pricing because stringent 0.5 mm focal-spot tolerances and practice fragmentation complicate servicing. Security and non-destructive testing applications advance at a 4.51% CAGR, driven by aviation composite inspection mandates and regulations governing foreign bodies in packaged food. Research applications, although small in revenue, push the technological frontier by demanding ultra-bright sources for laboratory micro-CT and crystallography, influencing future clinical-tube architectures. The blend of high-volume CT replacements and faster-growing perioperative segments ensures a balanced demand profile for the X-Ray Tube market.
By End User: Outpatient Shift Alters Procurement Patterns
Hospitals and health systems represented 55.48% of 2025 consumption, driven by multi-slice CT and interventional suites that rely on premium rotating-anode tubes. Yet outpatient clinics and ambulatory centers grow at 4.89% CAGR as payers incentivize site-of-care migration for cost containment. Freestanding imaging centers occupy the middle ground, but certificate-of-need statutes in certain U.S. states limit expansion. Aerospace and defense non-destructive testing labs are ramping up micro-focus tube purchases to inspect carbon-fiber fuselages and turbine blades, a trend echoed in food-processing lines where X-ray technology is superseding legacy metal detectors.
Research institutes and academia, while small in absolute volume, act as lighthouse customers that validate new tube chemistries and geometries through peer-reviewed studies, influencing broader adoption. Mobile imaging services utilizing truck-mounted systems for rural outreach necessitate ruggedized stationary-anode tubes designed to withstand vibration and temperature fluctuations. These diverse user profiles expand the addressable market, reinforcing steady growth in the X-Ray Tube market.
Geography Analysis
North America held 40.26% of 2025 revenue, buoyed by a replacement wave of CT scanners installed between 2010 and 2015 and a federal USD 3 billion rural-hospital modernization fund that prioritizes imaging equipment. Dose-index registries covering 30 million annual CT exams push providers to adopt tubes optimized for low-dose operation, adding another lever for upgrade activity. Group-purchasing consolidation in Canada compresses vendor margins yet standardizes tube models, simplifying supply chains and lifting service revenues.
Asia-Pacific is the fastest-growing region at 4.22% CAGR through 2031. China’s Healthy China 2030 earmarked USD 150 billion to add 10,000 community health centers, each with digital radiography and CT rooms stocked with locally manufactured tubes.[2]National Health Commission of China, “Healthy China 2030,” En.nhc.gov.cn India’s Ayushman Bharat subsidizes imaging for 5,000 district hospitals but often opts for refurbished scanners, expanding the secondary tube market.[3]Ministry of Health and Family Welfare India, “Ayushman Bharat,” Mohfw.gov.in Japan’s aging population sustains replacement volumes, though hospital mergers reduce site counts and amplify purchasing power. Medical tourism in Thailand and Singapore spurs demand for premium CT and fluoroscopy suites aimed at cash-pay international patients.
Europe plays a significant role in the global market, with Germany, France, and the United Kingdom being key contributors to the regional turnover. Eastern Europe is experiencing growth driven by EU structural funds allocated for healthcare infrastructure upgrades. The Middle East benefits from Saudi Vision 2030 and United Arab Emirates medical-tourism projects, though geopolitical risk tempers long-horizon orders. Africa remains under-penetrated with fewer than 2,000 CT scanners continent-wide, yet multilateral financing initiates the first significant procurement tranches, planting seeds for long-term X-Ray Tube market development.


Regulatory Landscape
X-ray tube makers operate under device-approval and radiation-safety regimes that connect component design and documentation to recognized standards and regulator expectations. In the United States, FDA-recognized consensus standards include IEC 60601-2-28:2017 for diagnostic X-ray equipment, shaping leakage limits, shielding approaches, and verification testing used in premarket submissions and ongoing design-control updates.
In Europe, compliance execution is shaped by the EU Medical Device Regulation (MDR 2017/745), including transition milestones around May 26, 2026, that require manufacturers to maintain eligibility through Notified Body engagement and technical documentation readiness. Industry bodies such as Team-NB reinforced documentation rigor with its April 2026 Best Practice Guide update for MDR technical files, while trade-policy uncertainty also sits alongside product compliance, as the US Department of Commerce opened a Section 232 investigation in September 2025 covering medical equipment imports, prompting stakeholder input from the American College of Radiology on potential tariff impacts for imaging components.
Value Chain Analysis
The x-ray tube value chain begins with high-purity raw materials, notably tungsten and rhenium for targets, plus specialty alloys for bearings, and then moves to ceramics and glass/metal envelopes, along with precision electro-mechanical subassemblies such as rotors, stators, and high-voltage interfaces. These inputs feed into vacuum processing, high-temperature joining, and endurance testing, before integration into imaging systems (CT, DR, fluoroscopy, dental) by OEMs. Distribution then runs through direct OEM channels, service organizations, and refurbishment or aftermarket specialists that support hospitals and industrial users.
Manufacturing depends on specialized equipment and skilled labor for vacuum metallurgy and precision joining, which can stretch lead times and qualification capacity for rotating-anode tubes compared with simpler components. Supply risk concentrates upstream where rhenium sourcing is highly concentrated, while downstream buyers increasingly procure tubes through bundled service models (uptime and predictive maintenance), shifting value capture toward long-term service contracts and installed-base management rather than one-off tube sales.
Competitive Landscape
The X-Ray Tube market displays moderate concentration, with Varex Imaging, GE Healthcare, Siemens Healthineers, and Canon collectively holding about a 60% share. Meanwhile, specialists like Comet Holding dominate micro-focus NDT niches, while Micro X-Ray leads the way in battery-powered portable units. Leading OEMs pivot toward annuity-style service contracts that bundle tubes, analytics, and uptime guarantees, locking in customers and smoothing revenue. Cold-cathode field-emission architectures represent white space where carbon-nanotube innovators such as Excillum challenge rotating-anode economics.
Patent portfolios cluster around thermal management and bearing innovations, with Varex holding 47 granted patents on liquid-metal systems and Siemens owning 38 on nanophotonic coatings, creating tangible entry barriers. Vertical integration intensifies as firms acquire tungsten-rhenium refiners to shield against raw-material volatility. Additive manufacturing of custom anode tracks emerges as a differentiator, reducing lead times for bespoke tube geometries. Outcome-based contracts shift competitive metrics from raw exposure capacity to guaranteed uptime and dose consistency, favoring vendors with large installed bases capable of training predictive-analytics models.
X-Ray Tube Industry Leaders
Varex Imaging Corporation
GE Healthcare Technologies Inc.
Siemens Healthineers AG
Canon Electron Tubes & Devices Co., Ltd.
Koninklijke Philips N.V.
- *Disclaimer: Major Players sorted in no particular order

Market Opportunities and Future Outlook
Technology whitespace is opening around electronically controlled sources and multi-beam architectures that reduce reliance on mechanical motion while enabling new imaging geometries and faster workflows. Varex Imagings June 2026 introduction of Multi-Beam X-ray (MBX) technology highlights a pathway for differentiated tube and source designs that pair with high-throughput clinical and industrial platforms, particularly where scan-time reduction and flexible beam control support measurable productivity.
Localization and capacity build-out also remain active opportunity areas where procurement policy and installed-base expansion intersect, especially in Asia-Pacific. Healthy China 2030 and Ayushman Bharat keep imaging-suite additions and replacements in focus, and manufacturers are responding with investment and footprint moves, such as Varexs announced USD 45 million Salt Lake City expansion (October 2025) to add cold-cathode tube capacity. At the same time, industrial inspection demand is pulling for higher-performance sources and detectors, illustrated by March 2026 detector expansion announcements from Rayence for semiconductor AXI and 3D CT inspection, which can support complementary source and tube upgrades in electronics manufacturing lines.
Recent Industry Developments
- March 2026: Varex Imaging entered into a new USD 490 million credit facility to refinance existing debt. The transaction supports balance-sheet flexibility for capital-intensive tube and component programs, including scaling manufacturing and funding advanced tube architectures that require specialized test and vacuum-processing infrastructure.
- July 2025: Siemens Healthineers received FDA clearance for the Luminos Q.namix R fluoroscopy and radiography platform. Clearance of new-generation radiography and fluoroscopy systems feeds demand for compatible tube configurations and validated performance profiles, while also tightening competitive requirements around compliance documentation and system-level integration.
- December 2024: Siemens Healthineers introduced the Luminos Q.namix platform for next-generation fluoroscopy and radiography, incorporating a 180 cm source-to-image distance design to reduce geometrical distortions. Platform refresh cycles at the system level typically cascade into tube qualification updates and replacement demand patterns as providers standardize on newer rooms and service models.


Research Methodology Framework and Report Scope
Market Definition and Coverage
For this study, the market covers revenues generated from x-ray tubes sold for medical, industrial, and research imaging uses, including replacements and OEM fitment, and measured in USD at manufacturer or supplier selling prices.
Scope exclusions: We exclude complete imaging systems, detectors, software, service contracts, and facility installation work, even when they are bundled in procurement.
Segmentation Overview
- By Tube Type
- Rotating Anode Tube
- Stationary Anode Tube
- Micro-focus Tube
- Cold-cathode Field-Emission Tube
- By Component
- Cathode Assembly
- Anode/Target
- Tube Housing and Envelope
- Rotor and Stator
- Other Components
- By Application
- Computed Tomography (CT)
- Digital Radiography (DR)/General Radiography
- Mobile C-arm/Fluoroscopy
- Mammography
- Dental Imaging
- Security and Non-Security Testing
- Scientific and Research
- By End-User Industry
- Hospitals and Health Systems
- Diagnostic Imaging Centers
- Outpatient Clinics and Ambulatory Care
- Aerospace and Defense NDT Facilities
- Food and Beverage Inspection
- Research Institutes and Academia
- By Geography
- North America
- United States
- Canada
- Mexico
- South America
- Brazil
- Argentina
- Rest of South America
- Europe
- Germany
- United Kingdom
- France
- Italy
- Spain
- Rest of Europe
- Asia-Pacific
- China
- Japan
- India
- South Korea
- ASEAN
- Rest of Asia-Pacific
- Middle East
- Saudi Arabia
- United Arab Emirates
- Rest of Middle East
- Africa
- South Africa
- Nigeria
- Rest of Africa
- North America
Data Sources, Market Sizing, and Validation
Desk Research
Desk research was used to set the fact base for where tubes are used, how demand moves over time, and how pricing normally behaves by modality. We reviewed public health statistics and imaging utilization signals from sources such as the World Health Organization, the US FDA device databases, the US Census Bureau trade statistics, and Eurostat, followed by country procurement notes and regulator updates that can shift replacement cycles.
On the supply side, we checked company filings, investor presentations, patents, and technical papers to understand product mix changes, for example rotating anode versus stationary, and performance requirements that differ between CT and dental use cases. Where needed, paid subscriptions for company financials and intelligence, patent databases, and shipment-level import and export checks were used to cross-verify manufacturer exposure and trade flows. These desk sources are illustrative only, and many other public and paid references were also used to collect data, validate assumptions, and clarify open questions.
Primary Interviews and Surveys
Primary work focused on interviews and structured surveys with tube manufacturers, component suppliers, imaging system OEM ecosystem participants, distributors, hospital imaging administrators, and industrial NDT users across major regions. The discussions helped confirm replacement timing, typical pricing movements by application, and where demand is shifting between CT, digital radiography, mobile fluoroscopy, mammography, dental, and security and NDT. When gaps showed up in desk signals, follow-up calls were used to pressure-test assumptions and align the final model outputs with real buying behavior.
Distribution of primary research fieldwork respondents
| Company type | Respondent position | Region |
|---|---|---|
| Top tier: 37% | CXOs: 14% | APAC: 41% |
| Mid tier: 44% | Functional/Unit leaders: 37% | EMEA: 37% |
| Smaller Players: 19% | Managers: 49% | Americas: 22% |
Market-Sizing & Forecasting
Sizing started from a top-down build that reconstructs the installed base of imaging equipment and its tube replacement need, and then converts that demand pool into value using application-specific price ranges. The model was then corroborated with selective bottom-up approximations, such as sampled supplier revenue splits, channel checks by region, and volume times average selling price for high-usage modalities, which were used to adjust totals when the first pass looked off.
Key inputs used in the model included modality mix (CT versus DR versus dental), replacement cycle timing, procedure and scan volume trends, average tube life assumptions by application, and observed price movement linked to performance specifications and material costs. We also tracked region-level procurement patterns and the share of mobile and outpatient imaging, since these can shift demand toward certain tube types.
For forecasting, scenario analysis was used around imaging utilization growth, replacement cycle normalization, and price progression, and then a simple multivariate regression layer was applied to tie demand to health spending, procedure volumes, and equipment base growth. Where direct bottom-up detail was missing for smaller end users, ratios from better-covered countries were applied and then reviewed with expert feedback before finalizing.
Data Validation & Update Cycle
Outputs were checked through triangulation across independent signals, including trade movement patterns, installed-base direction, and qualitative demand comments captured in interviews. Outliers were flagged early, and assumptions were reworked when a region or application showed a variance that could not be explained by utilization or pricing logic.
Before sign-off, the model goes through multi-step analyst review, and re-contact is triggered when a key input like replacement cycle or CT share shifts materially versus earlier checks. Reports are refreshed annually, with interim updates when major regulatory, supply, or pricing events occur, and a final pre-delivery pass is completed so clients receive the most current view available.
Mordor Intelligence's X Ray Tube Market Size Compared Against Other Published Estimates
It is normal to see different market values for x-ray tubes, even when the same end use is discussed, because publishers do not always count the same revenue items or align the same base year. Differences also show up when pricing is modeled differently across applications, or when one estimate leans more on equipment growth while another emphasizes steady replacement-driven demand.
Complete x-ray imaging systems and detector bundles are excluded here, and that packaged hardware value sits outside Mordor Intelligence's scope. This is why some broader imaging totals reported elsewhere will look higher than this tube-only number.
Benchmark comparison
| Source | Market Size | Gaps in Research Methodology |
|---|---|---|
| Mordor Intelligence | USD 3.64 B (2025) | |
| Industry Publisher A | USD 3.27 B (2024) | Uses an earlier base year and may apply a slower replacement cycle assumption, which can understate value in periods where CT utilization and tube change-outs accelerate. |
| Industry Publisher B | USD 3.10 B (2025) | Limits type coverage in the headline scope (for example, focusing mainly on rotating and stationary anode tubes), and may smooth pricing without fully reflecting application mix shifts like CT versus dental. |
Overall, the spread is mainly explained by what gets counted as tube revenue versus adjacent imaging hardware, plus the timing of the base year and how pricing and replacement cycles are carried forward. By keeping the model traceable to installed-base growth, modality mix, and replacement behavior, the final number stays practical to reproduce and easier to compare across regions.


Key Questions Answered in the Report
What is the current value of the global X-Ray Tube market?
The X-Ray Tube market size reached USD 3.78 billion in 2026 and is forecast to grow steadily through 2031.
Which tube type is growing the fastest?
Cold-cathode field-emission tubes post the highest forecast CAGR of 5.13%, driven by instant-on carbon-nanotube emitters.
Why is Asia-Pacific the fastest-growing region?
Healthy China 2030 and Ayushman Bharat programs fund thousands of new imaging suites, lifting tube demand at a 6.33% regional CAGR.
How are predictive-maintenance contracts changing procurement?
Service models bundle tubes with analytics, turning sporadic replacements into subscription revenue and guaranteeing scanner uptime.
What is the main raw-material risk for manufacturers?
Supply of high-purity tungsten-rhenium alloys is concentrated among a handful of refiners, exposing vendors to price and geopolitical shocks.
Which companies dominate the market?
Varex Imaging, GE Healthcare, Siemens Healthineers, and Canon collectively hold about 60% global share, yet niche players thrive in specialized segments.
Page last updated on:






